Summary
Farmland values for the Seventh Federal Reserve District edged up 1 percent in the second quarter of 2018 from a year earlier. Moreover, values for “good” agricultural land in the District increased 2 percent from the first quarter to the second quarter of 2018, according to a survey of 177 agricultural bankers. Overall, District farmland values were steady in the first half of 2018 even amid ongoing trade disputes. About three-fourths of survey respondents expected District agricultural land values to be unchanged during the third quarter of 2018 (only 2 percent expected them to increase, while 22 percent expected them to decrease). Thus, the near-term outlook for District farmland values appeared to be stable.
In the second quarter of 2018, agricultural credit conditions for the District slid again. Repayment rates for non-real-estate farm loans were lower in the second quarter of 2018 than a year earlier. The proportion of the District’s agricultural loan portfolio reported as having repayment problems increased some from a year ago, reaching midyear levels not seen since 2002. Higher rates than a year ago for renewals and extensions of non-real-estate farm loans were reported by the bankers once more. For the April through June period of 2018, demand for non-real-estate farm loans was up from a year earlier; this marked the 19th straight quarter of stronger loan demand relative to a year ago. Meanwhile, the availability of funds for lending by agricultural banks was weaker compared with a year earlier for the fourth consecutive quarter. For the second quarter of 2018, the District’s average loan-to-deposit ratio was 77.4 percent—3.6 percentage points below the average level desired by the responding bankers. On average, nominal interest rates for agricultural real estate, feeder cattle, and operating loans moved higher during the second quarter of 2018, yet real agricultural interest rates moved lower.
Farmland values
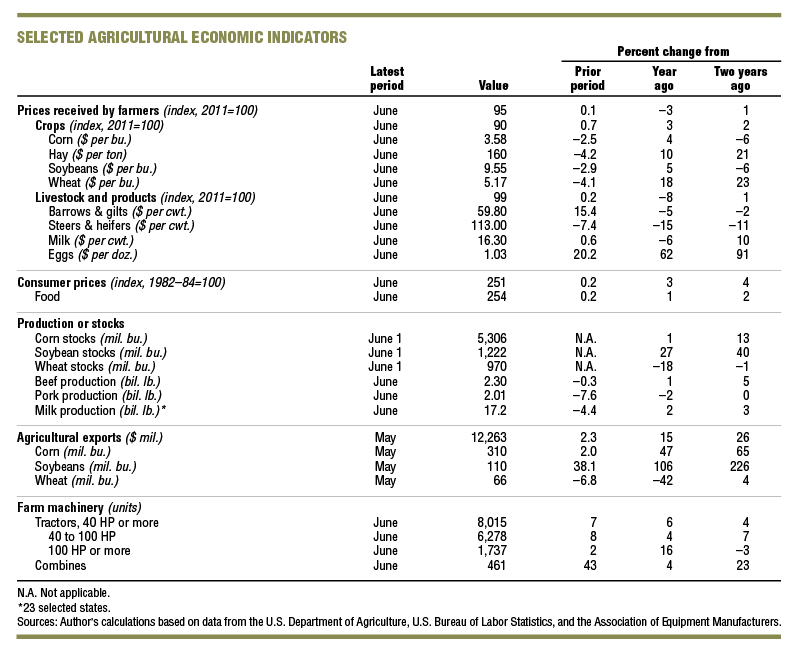
For the second quarter of 2018, there was a year-over-year gain of 1 percent in District agricultural land values (for the second quarter of 2017, a similar year-over-year gain had been seen). Among District states, only Illinois exhibited signs of a year-over-year decrease in farmland values (see map and table). District farmland values were up 2 percent in the second quarter of 2018 relative to the first quarter—the largest quarterly gain in four years. Agricultural land values remained fairly steady, assisted by an upturn in corn and soybean prices for the second quarter of 2018 as a whole. However, corn and soybean prices dipped in June (see final table) on account of a favorable start to the crop year, anticipated large ending stocks, and tariffs on agricultural exports.

Using long-term trend yields, the U.S. Department of Agriculture (USDA) estimated in July that 2018’s harvest of corn for grain would be 14.23 billion bushels (which would be the third largest ever, just behind the harvests of the previous two years) and that this year’s harvest of soybeans would be 4.31 billion bushels (only smaller than last year’s record). Although corn stocks relative to usage for 2018–19 would be the lowest in five years, soybean stocks relative to usage would be the highest in 12 years. Accounting for the impacts of recent tariffs on exports, the USDA estimated price intervals for the 2018–19 crop year to be $3.30 to $4.30 per bushel for corn and $8.00 to $10.50 per bushel for soybeans. When calculated with the midpoints of these price ranges, the projected revenues from the 2018 U.S. corn harvest would be up 8.9 percent from 2017 (still lower than expectations from earlier this year), whereas the 2018 U.S. soybean harvest would generate 2.9 percent less in projected revenues than a year ago. Hence, the expected profitability of corn and soybean farms took a hit in the second quarter of 2018. Moreover, livestock producers had to deal with prices lower than those of a year earlier. The USDA’s June index of prices received for livestock products was down 8 percent from a year ago (see final table).
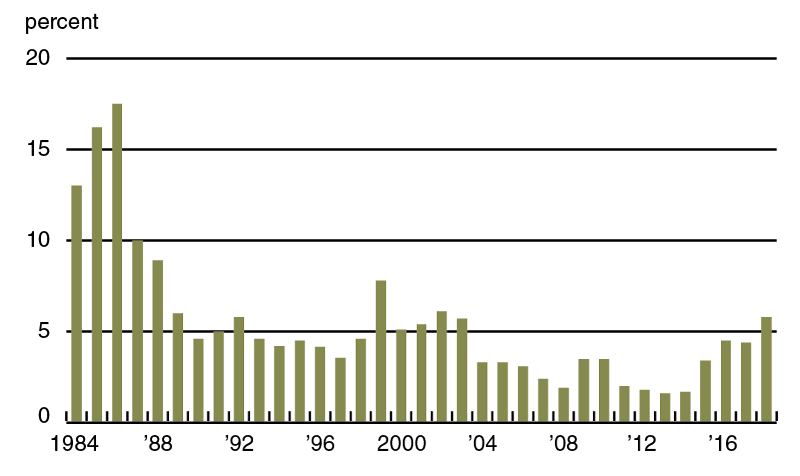
Given lowered farm income projections, anticipating declines in agricultural land values would not be out of order. According to an asset valuation model, the present price of an asset (such as farmland) should reflect both current profitability and expectations for discounted future earnings. The discount factor should move in the opposite direction of interest rates, such that higher interest rates tend to lower asset values (and vice versa). In the second quarter of 2018 and other recent quarters, nominal interest rates on agricultural loans moved up. As of July 1, 2018, District average interest rates on new farm operating loans, feeder cattle loans, and real estate loans had risen to 5.69 percent, 5.75 percent, and 5.28 percent, respectively. However, after being adjusted for inflation (which picked up in 2018) with the Personal Consumption Expenditures Price Index, all these interest rates ticked down over the second quarter of 2018. In particular, the average real interest rate for farm real estate loans dipped 13 basis points (see chart 1). On average, real interest rates on farm mortgages have remained low over the past two years (and have returned to the levels seen during the peak of farmland values in 2013). This divergence between nominal and real interest rates could help explain the general stability of farmland values since 2016, as the discount factor implied by lower real interest rates helped offset some of the weakness in farm incomes. Thus, the direction of average real interest rates on farm loans bears watching for a clue as to potential movements in agricultural land values.
1. Quarterly Seventh District farm mortgage interest rates

Credit conditions
Agricultural credit conditions in the second quarter of 2018 deteriorated relative to a year earlier yet again. Overall, repayment rates for non-real-estate farm loans were lower in the second quarter of 2018 compared with the second quarter of 2017; this marked the 19th consecutive quarter of deteriorating repayment rates relative to a year ago. The index of loan repayment rates was 64 for the second quarter of 2018 (1 percent of responding bankers noted higher rates of loan repayment than a year ago and 37 percent noted lower rates). The percentage of farm loans with “major” or “severe” repayment problems (5.8 percent of the District loan portfolio) was last higher in 2002, as measured every second quarter of the year (see chart 2). The highest concentrations of loans in these categories were found in Indiana and Michigan. Also, renewals and extensions of non-real-estate farm loans during the April through June period of 2018 were higher than during the same period of a year ago, as 35 percent of survey respondents reported more of them and 3 percent reported fewer of them.
2. Percentage of Seventh District farm loan portfolio with "major" or "severe" repayment problems
Furthermore, District banks had fewer funds available to lend in the second quarter of 2018 than a year ago. With 7 percent of responding bankers reporting their banks had more funds available to lend and 16 percent reporting their banks had less, the index of funds availability was 91 for the second quarter of 2018—the lowest such figure since the third quarter of 2000. Credit tightening was also evident in the second quarter of 2018, as 21 percent of the survey respondents reported that their banks required larger amounts of collateral than a year ago and none reported that their banks required smaller amounts. Since 2013, demand for non-real-estate loans compared with a year earlier has generally continued to escalate. With 36 percent of survey respondents noting demand for non-real-estate loans above the level of a year ago and 13 percent noting demand below that of a year ago, the index of loan demand was 123 for the second quarter of 2018. The District’s average loan-to-deposit ratio for the second quarter of 2018 moved up to 77.4 percent (with nearly half of the banks below the desired level reported by their respective survey respondents).
Over the first half of 2018, District banks issued an amount of farm operating loans that was higher than historically normal, but an amount of agricultural real estate loans that was lower than normal, according to responding bankers. In the first six months of 2018, merchants, dealers, and other input suppliers noticeably boosted agricultural lending. According to survey respondents, during the January through June period of 2018, lenders within the Farm Credit System also issued an above-normal amount of operating loans and mortgages. Meanwhile, life insurance companies reportedly issued an amount of agricultural loans in the District that was slightly below normal, although this trend was bucked in Illinois.

Looking forward
According to survey respondents, District farmland values were expected to be stable in the short term. With 22 percent projecting agricultural land values to decrease and only 2 percent projecting them to increase, around three-quarters of responding bankers projected no change in them for the third quarter of 2018. Farm loan volumes in the third quarter of 2018 were anticipated by survey respondents to increase from year-earlier levels for non-real-estate lending (notably for operating loans and loans guaranteed by the Farm Service Agency of the USDA) and to decrease for real estate lending.
Comments from District bankers emphasized their concerns (and farmers’ concerns) about the negative impacts to the agricultural sector from recent changes in trade policy. Additionally, an Indiana banker commented: “Commodity prices are becoming a greater concern. If they persist at present levels, it will cause some farmers to make major changes or exit their operations.”