Summary
In the first quarter of 2017, agricultural land values for the Seventh Federal Reserve District were unchanged from a year ago—the first pause in the current downturn since the third quarter of 2015. Moreover, “good” farmland values in the first quarter of 2017 were largely the same as in the fourth quarter of 2016, according to the survey responses of 198 District agricultural bankers. Cash rental rates for District farmland continued their decline in 2017, falling 7 percent from 2016. The demand to purchase agricultural land in the three- to six-month period ending with March 2017 was lower than in the same period ending with March 2016. Additionally, the amount of farmland for sale, the number of farms sold, and the amount of acreage sold were down during the winter and early spring of 2017 compared with a year ago. The responding bankers leaned heavily toward the view that farmland values would remain stable during the second quarter of 2017—a shift from the sentiment that farmland values would continue to decline held widely a year earlier.
District agricultural credit conditions continued to deteriorate during the first quarter of 2017. Again, repayment rates for non-real-estate farm loans fell compared with a year ago, and renewals and extensions of these loans were higher than a year earlier. Demand for non-real-estate loans in the first quarter of 2017 was up from that of a year earlier, while the availability of funds to lend was pretty much at the same level as a year ago. At 74.4 percent, the average loan-to-deposit ratio was higher than a year ago, but lower than in the previous quarter. Average nominal interest rates on farm loans were up a bit in the first quarter of 2017 from the previous quarter, yet real rates were down.
Farmland values
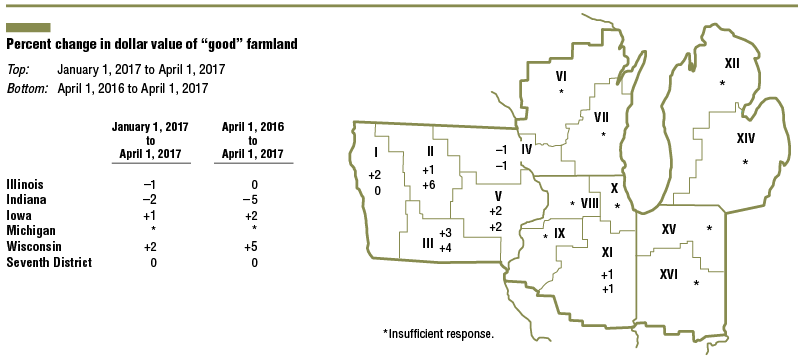
District farmland values were unchanged in the first quarter of 2017 relative to both the first and fourth quarters of 2016 (see table and map below). With no year-over-year change in agricultural land values, the District saw an end to five straight quarters of declines. One survey respondent commented that “prices of farmland have stayed surprisingly steady.” Also, Iowa had its first year-over-year increase in farmland values since the third quarter of 2013. In contrast, Indiana experienced its sharpest year-over-year decrease (–5 percent) of the current downturn. After adjusting for inflation with the Personal Consumption Expenditures Price Index (PCEPI), District farmland values were down 2 percent for the first quarter of 2017 relative to the first quarter of 2016. This year-over-year decline in the real values of District agricultural land was the 11th in a row (stretching back nearly three years).
There was a slowdown in farmland markets in the three- to six-month period ending with March 2017 compared with the same period ending with March 2016. Given 12 percent of the survey respondents reported higher demand to purchase farmland and 31 percent reported lower demand, there seemed to be less interest on the part of buyers. The supply of farmland for sale was down from a year earlier as well: There was a decrease in the amount of farmland for sale during the most recent winter and early spring relative to a year ago, as 13 percent of the responding bankers reported more farmland was up for sale in their areas and 38 percent reported less. Similarly, the number of farms and acreage sold declined in the winter and early spring relative to a year ago. Survey participants, on balance, observed farmers maintaining their share of farmland acres purchased (relative to that of investors) in the three- to six-month period ending in March 2017 versus the same period ending in March 2016 (11 percent noted farmers increased their share and 13 percent noted farmers decreased their share).
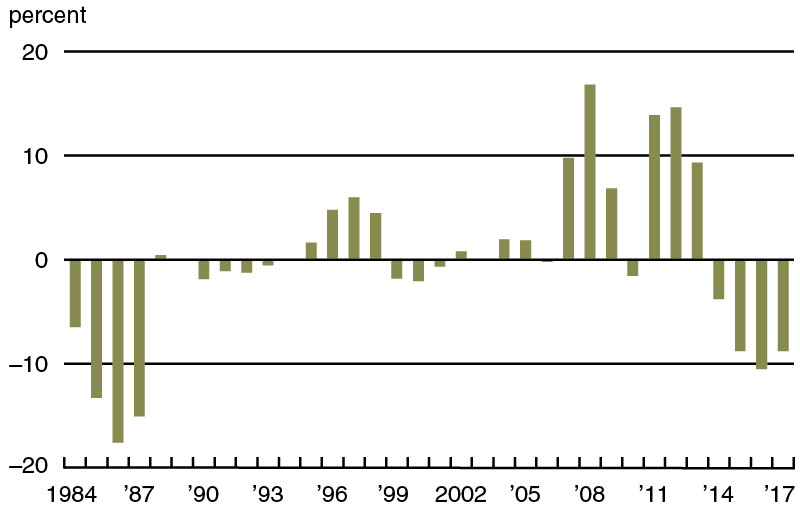
Around 80 percent of District farmland operated by someone other than the owner was rented out on a cash basis; 15 percent, on a crop-share basis; 2 percent, on a bushel basis; and 3 percent, on other terms. Cash rental rates for agricultural land in the District fell 7 percent for 2017 relative to 2016—somewhat less than the decline seen a year ago. For 2017, average annual cash rates to lease farmland were down 6 percent in Illinois, 8 percent in Indiana, 8 percent in Iowa, 5 percent in Michigan, and 4 percent in Wisconsin. After being adjusted for inflation using the PCEPI, District cash rental rates decreased 9 percent from 2016 (see chart 1)—the fourth consecutive negative result according to this measure (the longest streak of declines since 1990–94).
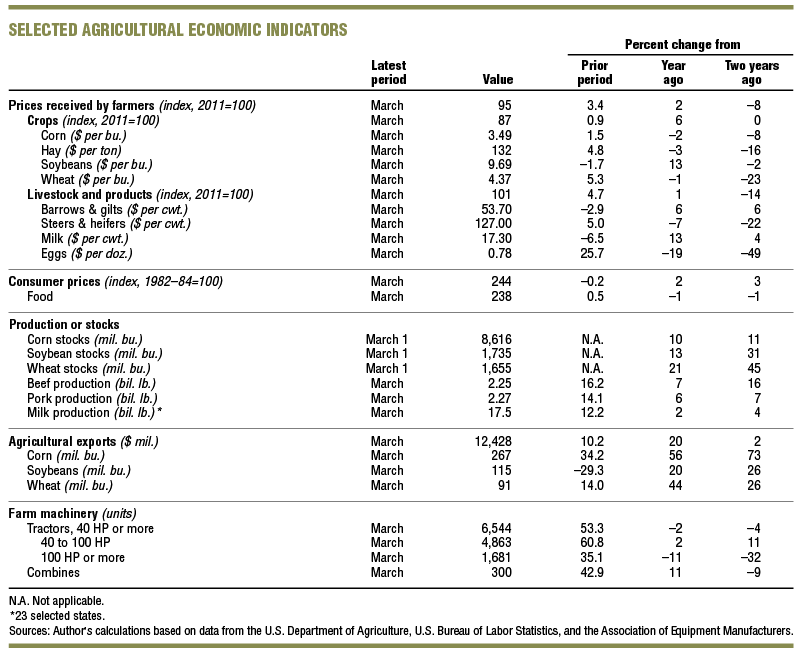
1. Annual percentage change in Seventh District farmland cash rental rates adjusted by PCEPI
The change in the index of inflation-adjusted farmland cash rental rates was larger than the change in the index of inflation-adjusted agricultural land values for the fourth year in a row (see chart 2). The result was that 2017’s real cash rental rates were 20 percent below their level in 1981, while real farmland values were still 69 percent above their 1981 level. In contrast, during the downturn of the 1980s, real farmland values fell more rapidly than did real cash rental rates. Given the implication that relatively weaker demand to own farmland than to lease it existed back then, the reverse would seem to hold true for the current situation. Agricultural land values have not fallen as much as the earnings potential of farmland (represented by cash rental rates). Compared with prices in March 2016, corn prices were down 2 percent and soybean prices were up 13 percent in 2017, according to data from the U.S. Department of Agriculture (USDA) (see final table). Real March corn prices have not been this low since 2006, although real soybean prices were lower in March 2016. So, for 2017, higher potential returns on soybean acres led to expectations of a 5.2 percent increase in soybean acres for the five District states and a 2.8 percent decrease in corn acres, based on the USDA survey of planting intentions.
2. Index of Seventh District farmland adjusted by PCEPI
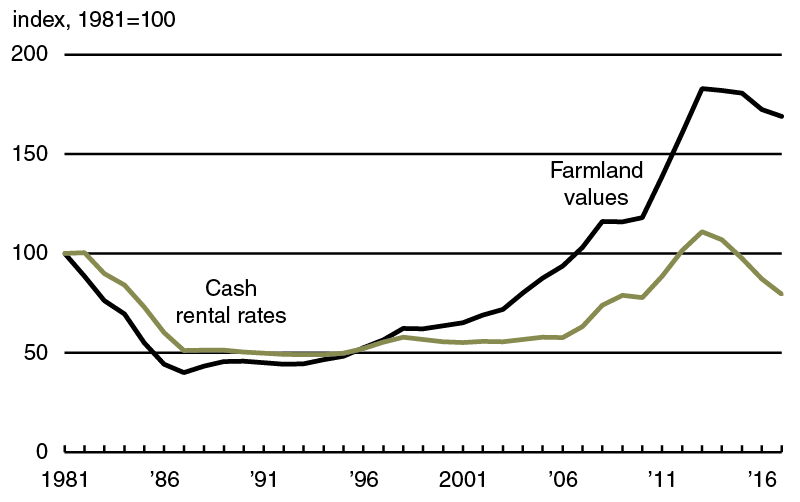
Sources: Author’s calculations based on data from Federal Reserve Bank of Chicago farmland value surveys; and U.S. Bureau of Economic Analysis, Personal Consumption Expenditures Price Index (PCEPI), from Haver Analytics.
Credit conditions
The District’s agricultural credit conditions slipped in the first quarter of 2017 relative to the first quarter of 2016. Falling from its value for the previous quarter, the index of repayment rates for non-real-estate farm loans was 57 for the first quarter of 2017, with 1 percent of responding bankers observing higher rates of repayment and 44 percent observing lower rates. In addition, 45 percent of the survey respondents noted higher levels of loan renewals and extensions over the January through March period of 2017 compared with the same period last year, while 2 percent noted lower levels of them. Credit tightening continued in the first quarter of 2017; 24 percent of survey respondents indicated that their banks required larger amounts of collateral for loans during the January through March period of 2017 relative to the same period of 2016, while none reported that their banks required smaller amounts. There was only a small rise (to 6.0 percent, on average) from a year ago in the share of loans guaranteed by the Farm Service Agency (FSA) of the USDA in the portfolios of reporting banks. These FSA guarantees assist banks in lending to some farm operations that may not otherwise hold adequate collateral.
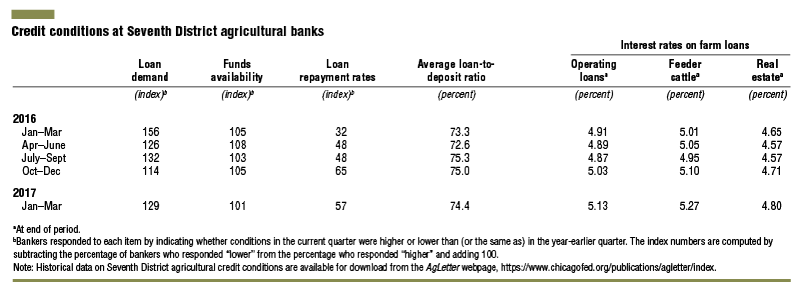
Climbing from its value in the previous quarter, the index of demand for non-real-estate farm loans was 129, as 41 percent of the reporting bankers noted higher loan demand compared with a year ago and 12 percent noted lower demand. At 101, the index of funds availability indicated there was practically no change in funding levels from a year ago; 10 percent of the survey respondents reported their banks had more funds available to lend and 9 percent reported their banks had less. The average loan-to-deposit ratio for the District was higher in the first quarter of 2017 than a year ago, yet decreased to 74.4 percent from 75.0 percent in the fourth quarter of 2016. As of April 1, 2017, there were increases from the end of the previous quarter in the average nominal interest rates on operating loans (to 5.13 percent), agricultural real estate loans (to 4.80 percent), and feeder cattle loans (to 5.27 percent). However, after being adjusted for inflation using the PCEPI, agricultural interest rates actually fell in the first quarter of 2017 as inflation moved higher: Real interest rates dropped 43 basis points for operating loans, 44 basis points for farm real estate loans, and 36 basis points for feeder cattle loans. In real terms, interest rates were last lower in the second quarter of 2014 for operating and feeder cattle loans and in the first quarter of 2012 for agricultural real estate loans.
Looking forward
Survey respondents anticipated agricultural land values to remain stable in the second quarter of 2017: 69 percent of responding bankers expected farmland values to be steady, 29 percent expected a decline, and a few Iowa bankers expected an increase. Farm real estate loan volumes were anticipated to decrease in the second quarter of 2017 relative to the second quarter of 2016, as 12 percent of survey respondents predicted higher levels of lending for farm real estate and 26 percent predicted lower levels.
In contrast, survey respondents projected that the overall volume of non-real-estate farm loans would increase during the April through June period of 2017 compared with the same period of 2016. While responding bankers forecasted lower volumes for grain storage loans, farm machinery loans, dairy loans, and feeder cattle loans, they forecasted higher volumes for operating loans and FSA-guaranteed loans in the District.