

This article presents evidence that Detroit’s economy is doing noticeably better than before the city filed for bankruptcy in July 2013. In order to track the city’s economic recovery following its bankruptcy, we use a new index that quantifies Detroit’s overall economic performance from 1998 to the present.
Since Detroit’s exit from bankruptcy in December 2014, there have been signs that its economy is improving.1 These include increased private investment, higher employment, less unemployment, rising incomes, and improving real estate values. Putting all of these signs together to form an overall impression of the city’s economic progress out of bankruptcy is the goal of this Chicago Fed Letter.
The Detroit Economic Activity Index
One way to measure Detroit’s economic progress since exiting bankruptcy would be to use the Federal Reserve Bank of St. Louis’s monthly Economic Conditions Index for Detroit–Warren–Dearborn, MI. The St. Louis Fed’s index—which we’ll refer to as the ECI for short—is constructed using a dynamic factor model that includes 12 data series measuring various aspects of growth in economic activity in the Detroit metropolitan statistical area (MSA) and is calibrated to its gross metropolitan product (GMP) growth.2 However, the ECI does not measure the economic conditions of the city of Detroit separately from those of the broader MSA. Because of this, we construct a new measure of Detroit-specific economic conditions that we call the Detroit Economic Activity Index (DEAI). Like the ECI, the DEAI is also constructed using a mixed-frequency dynamic factor model, but includes 23 Detroit-specific data series capturing income, employment, residential and commercial real estate activity, electric customer counts, tax revenues, and port activity.3 The DEAI is calibrated so that Detroit’s historical growth trend (average) equals zero, meaning that an index value greater than zero implies the city’s economic activity is growing faster than trend and, conversely, a value less than zero implies its activity is growing slower than trend. The index is then measured in standard deviation units from trend growth. The limited availability of many of the data series that make up the DEAI restricts how far back it goes in comparison with the ECI; the DEAI’s history extends back to only 1998.
1. Economic activity indexes for Detroit city and metropolitan statistical area
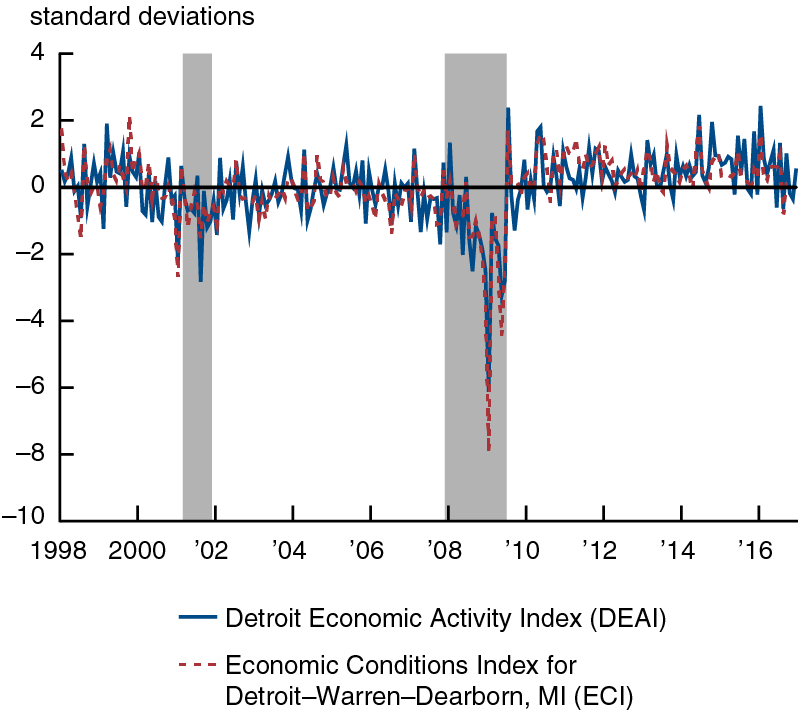
Figure 1 features both the DEAI and the ECI. For the sake of comparison, the ECI was scaled to match the construction of the DEAI. From this figure, it is easy to see that growth in the MSA’s economic activity correlates well with that of the city of Detroit. Both Detroit and the MSA suffered significantly during the 2008–09 recession. Following the recession, Detroit’s growth in economic activity kept falling below trend for an extended period of time. Moreover, the city’s economic growth more frequently dropped back into negative territory than the MSA’s: In fact, from the trough of the recession in June 2009 through September 2016, the DEAI slipped into negative territory 23 times, versus just 11 times for the ECI.
Gross city product for Detroit
Following the St. Louis Fed’s methodology for the ECI, we can use the GMP growth rate of the Detroit–Warren–Dearborn MSA as a basis for the trend growth rate of the DEAI. The mixed-frequency dynamic factor model underlying the DEAI can then be used to create a separate index for Detroit’s annual “gross city product” (GCP).4 The U.S. Bureau of Economic Analysis (BEA) does not currently produce such a measure for the city of Detroit, which necessitates our using the historical average of GMP growth to calibrate the DEAI’s trend growth rate. This assumption is defensible, however, based on the similarity between the ECI and DEAI observed in figure 1.
Figure 2 displays both an index for Michigan’s gross state product (GSP) and our estimated GCP index for Detroit. In comparing the two indexes, we note that the current economic outputs for both Michigan and Detroit remain below their respective previous peaks. Detroit’s GCP peaked in 2000 and continued on a general decline until bottoming out in 2010. In contrast, Michigan’s GSP suffered only a slight setback during the 2001 recession, recovering to a new peak in 2005.
2. Indexes of Michigan real gross state product (GSP) and Detroit real gross city product (GCP)
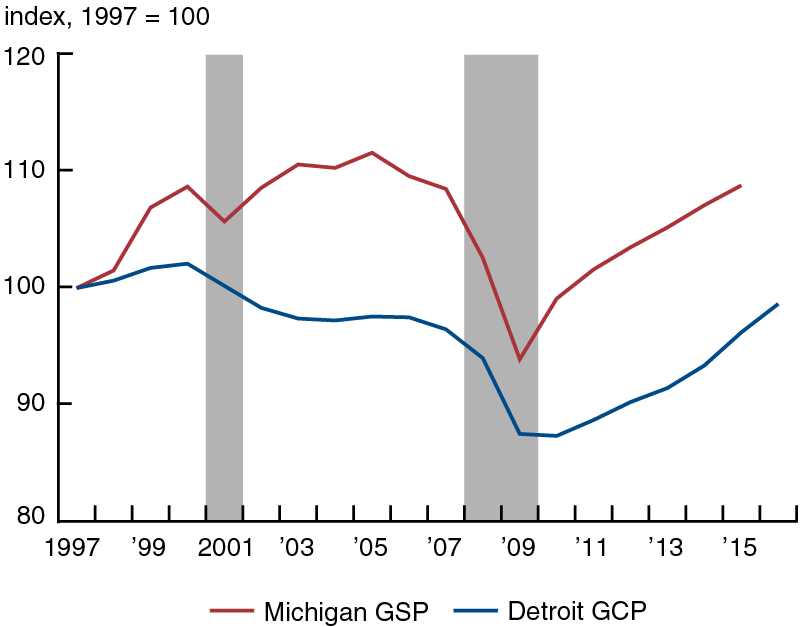
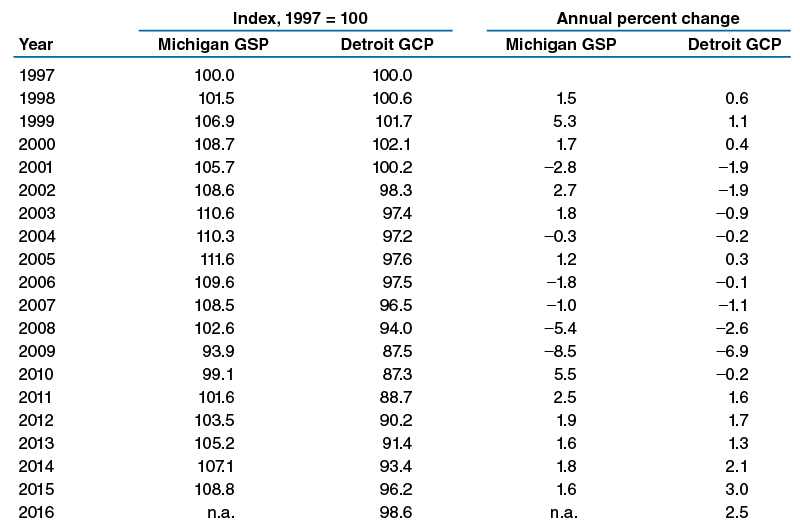
Figure 3 contains the index level and annual percent change for both Michigan GSP and Detroit GCP from 1997 through 2016 (corresponding to the data for figure 2). From figure 3, it is obvious that Detroit’s economy suffered greatly in the aftermath of both the 2001 and 2008–09 recessions: By 2010, Detroit GCP had fallen to just 87.3% of its 1997 level, while Michigan GSP had slipped to 99.1% of its 1997 level. Given the severity of Detroit’s economic decline during the first decade of the new millennium, it is perhaps not surprising then to see that annual growth for Detroit has exceeded that for Michigan in recent years. This is partly because Detroit has been growing from a much lower point than the state as a whole.
3. Michigan real gross state product (GSP) and Detroit real gross city product (GCP), by index level and annual percent change
Post-bankruptcy progress
Detroit entered bankruptcy in July 2013 and exited bankruptcy just 18 months later, in December 2014. This made it not only the biggest municipal bankruptcy by debt (estimated at $18 to $20 billion) in U.S. history but also one of the fastest resolved. In 2013, years of declining economic output and falling personal incomes made it seem inevitable that Detroit was headed for bankruptcy; and investors, betting on an eventual recovery, started to acquire large areas of the city. For instance, Detroit native and founder of Quicken Loans Dan Gilbert had already embarked on a project to revitalize a two-square-mile area of downtown Detroit prior to the bankruptcy. By April 2013, Gilbert had invested $1 billion to acquire nearly three million square feet of real estate in the downtown area.5
The influx of new capital and an improved attitude about Detroit’s recovery following its bankruptcy started to pay early dividends for the city. In fact, while Detroit’s municipal government was still working out the details for exiting bankruptcy, the city’s economic conditions were already starting to improve. When Detroit entered bankruptcy in July 2013, its economy was still almost 10% below its 1997 level according to our GCP estimates in figure 3. Starting in 2014, Detroit’s rate of growth in GCP began to recover, reaching a robust 3% rate in 2015 and remaining at above a 2% rate in 2016. Our estimates indicate that with annual growth above trend in recent years, Detroit’s GCP was actually down only 1.4% relative to its 1997 level as of December 2016, though it was still below its previous peak reached in 2000 by about 3%.
Another way to look at Detroit’s economic recovery that doesn’t depend on our estimate of its GCP is to examine the recent history of the city’s real per capita income (PCI) data. The city’s real PCI, derived from the U.S. Census Bureau’s American Community Survey, is released with a substantial lag such that final data for 2016 will not be available until the fall of this year. However, given that this data series is a component of the DEAI, we can already project it for 2016 with our dynamic factor model.
4. Detroit city real per capita income
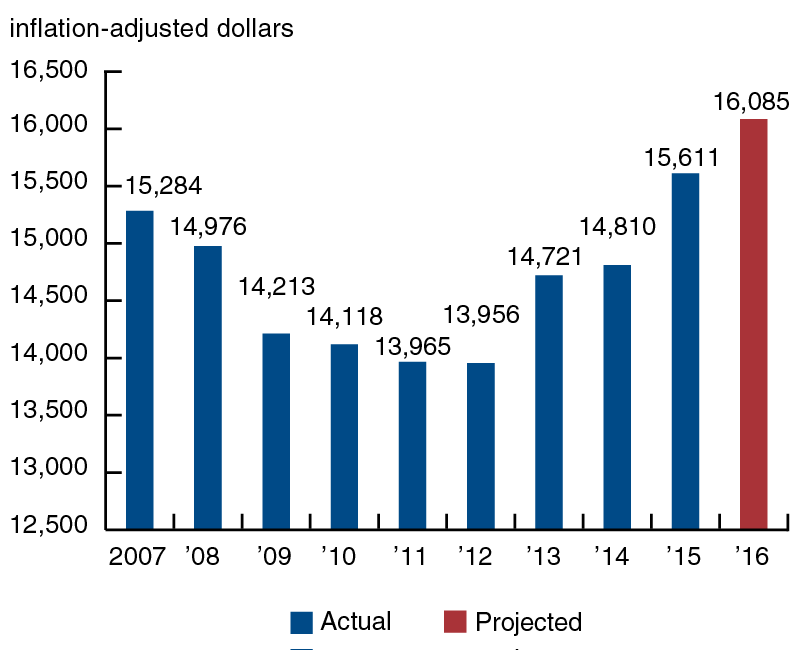
Source: Authors’ calculations based on data from the U.S. Census Bureau, American Community Survey 1-year estimates.
Figure 4 plots Detroit’s real PCI data over the period 2007–15, along with our 2016 estimate. Between 2007 and 2012, Detroit’s real PCI declined for five consecutive years. By 2012, it had fallen by about 9% relative to its 2007 level. During the years that Detroit was in bankruptcy (2013 and 2014), its real PCI was roughly flat. However, according to our estimates, after exiting bankruptcy, growth in Detroit’s real PCI averaged closer to 4% for the years 2015 and 2016—with PCI exceeding its previous peak in 2015 before reaching a level of $16,085 in 2016 (up from just $13,956 in 2012). Even with these gains, however, Detroit’s real PCI remains roughly half the size of real per capita income for the broader MSA ($29,736 in 2015).
5. Detroit city employment and unemployment rate
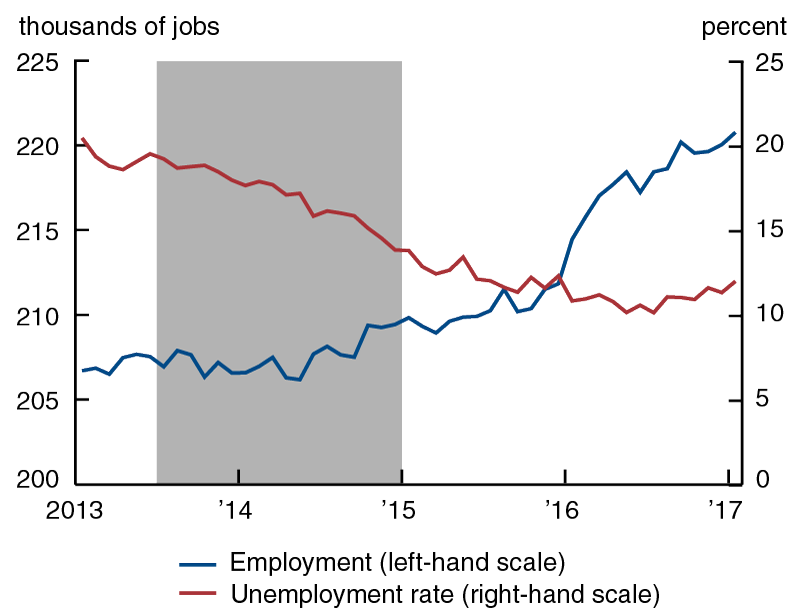
The increase in real per capita income for residents of the city of Detroit is consistent with the substantial improvement in its labor market shown in figure 5. Detroit employment and unemployment are two of the most significant variables in the DEAI, which drive much of its month-to-month variation. According to our estimates of seasonally adjusted data from the U.S. Bureau of Labor Statistics, Detroit has seen a steady increase in employment and a steady decrease in unemployment in recent years: Since exiting bankruptcy in late 2014, roughly 11,000 jobs have been added and the unemployment rate has declined a little more than 1.5 percentage points.6 To be fair, some of the decline in the unemployment rate was likely the result of a declining labor force; but according to our seasonally adjusted estimates, Detroit’s labor force stopped declining in September 2015, and has since increased by 6%.
Conclusion
In summary, the Detroit Economic Activity Index shows that Detroit’s economy has been improving since the city emerged from bankruptcy and has come a long way in just a few years. However, there remains room for improvement. As a recent article points out, not all of Detroit’s residents are experiencing the same benefits of the city’s economic rebound across its roughly 140 square miles.7 There are also other challenges for Detroit’s economy beyond what has been covered in this article—such as improving schools, access to affordable housing, and neighborhood safety, as well as creating a better regional transit system.8 We will continue developing the DEAI, and expect to make its results publicly available at a later date.
1 See, e.g., https://www.citylab.com/housing/2017/02/detroits-recovery-the-glass-is-half-full-at-most/517194/.
2 The ECI is available at https://fred.stlouisfed.org/series/DWLAGRIDX, and its methodology is described in Maria A. Arias, Charles S. Gascon, and David E. Rapach, 2016, “Metro business cycles,” Journal of Urban Economics, Vol. 94, July, pp. 90–108.
3 The estimation of mixed-frequency dynamic factor models is described in Marta Bańbura and Michele Modugno, 2014, “Maximum likelihood estimation of factor models on datasets with arbitrary pattern of missing data,” Journal of Applied Econometrics, Vol. 29, No. 1, January/February, pp. 133–160. The specific underlying data series used in constructing the DEAI are described in greater detail at https://www.chicagofed.org/~/media/others/people/research-resources/brave/cfl376-deai-indicators-list-pdf.pdf.
4 This process amounts to transforming the monthly DEAI into an annual growth rate and then scaling it to the annual GMP growth rate by linear regression.
5 See http://www.nytimes.com/2013/04/14/business/dan-gilberts-quest-to-remake-downtown-detroit.html.
6 We also adjust both labor measures for breaks in their time series resulting from the decennial censuses.
7 See http://www.nytimes.com/2013/04/14/business/dan-gilberts-quest-to-remake-downtown-detroit.html.
8 See, e.g., http://www.detroitmi.gov/How-Do-I/Obtain-Grant-Information/Choice-Neighborhoods/Housing-Plan and http://www.detroitmi.gov/How-Do-I/Obtain-Grant-Information/Choice-Neighborhoods/Neighborhood-Plan.


