

Since 1997, the catastrophe (CAT) bond market has provided the insurance industry with protections against natural disasters that have grown more frequent and costly. This article explains how CAT bonds work, and then looks at how the market for them has grown in size, coverage, and sophistication over the past two decades. It also explores how and why different types of institutions use CAT bonds to transfer insurance risks.
The catastrophe bond market was born during one of the most difficult periods for the property and casualty (P&C) insurance industry. In 1992 Hurricane Andrew struck Florida and the Gulf Coast, inflicting $27 billion in damages, of which $15.5 billion was covered by insurance.1 At the time, Andrew was the costliest hurricane to ever make landfall in the United States: It led to the failure of eight insurance companies and pushed others to the brink of insolvency.2 As a result of the losses suffered during Andrew, insurers reevaluated their risk exposure to coastal areas across the country. Homeowners’ insurance prices in coastal communities rose markedly to account for the possibility of significant losses, and many large insurers and reinsurers3 initially reduced their exposure to catastrophic events in coastal regions.
In an effort to boost insurance capacity, insurance companies bought greater amounts of reinsurance from reinsurers less affected by Andrew. Additionally, publicly funded state insurance programs were created to cover a portion of the losses specifically tied to catastrophic events. However, the demand for natural-disaster-related insurance by households and businesses meant that new capital had to flow into reinsurance. To increase the available capital, the insurance industry created a new financial instrument called a catastrophe bond. A CAT bond is a security that pays the issuer when a predefined disaster risk is realized, such as a hurricane causing $500 million in insured losses or an earthquake reaching a magnitude of 7.0 (on the Richter scale).4 The first CAT bonds were issued in 1997, giving insurers access to broader financial markets and offering institutional investors, such as hedge funds, pension funds, and mutual funds, the opportunity to earn an attractive return on investment uncorrelated with the returns of other financial market instruments in exchange for assuming catastrophe insurance risks.
This Chicago Fed Letter discusses how CAT bonds work; how the CAT bond market has evolved over the past 20 years; and how insurers, reinsurers, and state catastrophe funds use CAT bonds and why.
How CAT bonds work: The case of Mariah Re Ltd.
To understand how CAT bonds work, let’s examine a specific CAT bond issued by Mariah Re Ltd. on behalf of American Family Mutual Insurance Co. (AFMI) in November 2010. Mariah Re Ltd. was a special-purpose vehicle (SPV) that acted as an intermediary between the CAT bond investors and AFMI, the issuer of the CAT bond (see figure 1). This deal allowed AFMI to transfer insurance risks, related specifically to severe thunderstorms and tornadoes across the U.S., from its balance sheet to investors. The deal provided AFMI with up to $100 million in compensation if estimated losses to the P&C insurance industry from severe thunderstorms and tornadoes across the U.S. exceeded $825 million. This contractually agreed-upon threshold is known as the bond’s attachment point. After the $825 million attachment point was reached, AFMI would receive $1 in compensation for every $1 of additional covered losses up to the $100 million limit. In exchange for taking on this risk, investors received a 6.25% annual coupon over the bond’s three-year term.5
1. Catastrophe bond structure
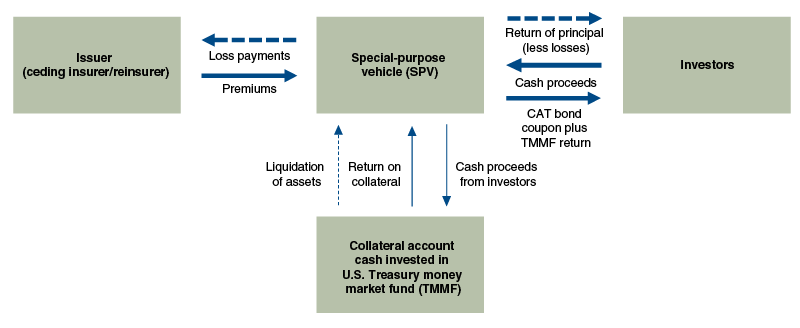
Source: Author's adaptation of information from Artemis.
As the SPV in this deal, Mariah Re Ltd. facilitated the catastrophe risk transfer between AFMI and the CAT bond’s investors by managing the cash transfers between the two parties (see figure 1). Under the terms of the deal, investors that purchased the bond collectively provided the SPV with $100 million in cash (i.e., the bond’s principal) to be used in case payouts to AFMI were due. The cash raised by selling the bonds was then invested in a U.S. Treasury money market fund. In turn, AFMI provided the SPV with annual premiums of $6.25 million (0.0625 × $100 million)—which, along with the returns on the invested cash from the Treasury money market fund, were passed on to the investors. In the event that no payouts to AFMI had been necessary, the $100 million in proceeds would have been liquidated from the collateral account at the end of the bond’s three-year term and returned to investors. However, investors in the Mariah Re Ltd. CAT bond were not so lucky.
In the spring of 2011, the Mariah Re Ltd. deal quickly turned south for investors when multiple tornadoes broke out in the Southeast and Midwest. In April and May alone, a total of 983 tornadoes touched down across the country, which led to 498 deaths and a total of $21 billion in damages.6
An independent third-party catastrophe modeler, AIR Worldwide, was charged with determining the amount of P&C insurance industry losses covered under the deal. During the tornado season of 2011 (the deadliest and costliest in U.S. history according to the National Oceanic and Atmospheric Administration), losses quickly piled up; and by October 31, AIR Worldwide’s estimate of industry losses had reached $836.6 million. Given the bond’s $825 million attachment point, this meant investors would face at least an $11.6 million loss in the bond’s principal. Then on November 28, 2011, the situation worsened for investors when AIR Worldwide changed the designation for losses due to a Kansas storm from “non-metro” to “metro.” Because AIR Worldwide’s industry loss estimates placed a higher weight on metro-area losses, this change caused estimated industry losses to rise to $954.6 million, completely wiping out the investors’ principal and providing AFMI with the full $100 million in loss coverage afforded under the deal.7
The advantages of CAT bonds
CAT bonds offer insurers an alternative to traditional reinsurance and allow catastrophe risk to be transferred to a wider set of investors. But why do insurers use CAT bonds to begin with, and what’s the appeal for investors?
CAT bonds are attractive to insurers for a number of reasons. Unlike traditional reinsurance where it is possible for the reinsurer to fail to pay out following a loss event, CAT bonds are 100% collateralized and structured to eliminate counterparty risk. The most common structure in use today involves placing the proceeds from investors in a secure collateral account and then investing cash from that account in Treasury money market instruments (again, see figure 1). CAT bonds also offer the possibility of multiyear commitments, whereas most reinsurance deals are for a one-year term. A multiyear commitment allows CAT bond issuers to lock in prices over an extended period. Finally, CAT bonds have lowered the costs of diversifying insurers’ exposure to natural disaster risk: By attracting alternative sources of capital (e.g., hedge funds, sovereign wealth funds, pension funds, and mutual funds) to compete with traditional reinsurance (typically backed by equity capital from reinsurers’ shareholders), CAT bonds exert downward pressure on reinsurance prices (and price volatility) while increasing the total capital available for the transfer of insurance risks.8
For investors, the appeal of CAT bonds is twofold. First, CAT bonds are largely uncorrelated with the returns of other financial market instruments. The incidence of hurricanes and tornadoes is largely unrelated to economic and financial activity. During the financial crisis, CAT bond prices were virtually unaffected. A notable exception was the collapse in prices of CAT bonds with Lehman Brothers as a counterparty.9 That said, there are some cases where CAT bond losses might happen at the same time as a downturn in the broader economy. For example, if a high-magnitude earthquake were to hit the San Francisco Bay Area, there could be both substantial losses on many catastrophe bonds and large drops in stock prices. Second, historically, CAT bonds have provided strong returns, helping to attract alternative sources of capital into insurance markets.10
The development of the CAT bond market
Over the past 20 years, the CAT bond market has grown from a small part of the insurance landscape to a vital tool for managing insured natural catastrophe losses. While Hurricane Andrew in 1992 spurred the creation of the CAT bond market in 1997, three main events have shaped its growth since its inception: Hurricane Katrina in 2005, the financial crisis of 2008, and the post-crisis low-interest-rate period.
The first big shift in the CAT bond market followed Hurricane Katrina—the costliest natural disaster in U.S. history. From 1997 through 2005, CAT bond issuance was steady but low, averaging $1.2 billion annually.11 Pre-Katrina issuance was also concentrated among a small number of insurers. Between 1997 and 2005, Swiss Re and USAA accounted for 20% and 17% of total issuance, respectively. But CAT bonds gained popularity as a means of diversifying risk after the $62 billion in insured losses from Katrina depleted reinsurance capital and caused reinsurance prices to jump.12 The spike in reinsurance prices attracted significant amounts of capital to the CAT bond market. This influx of capital allowed CAT bond issuers to post consecutive years of record issuance—$4.7 billion in 2006 and $7.1 billion in 2007 (see figure 2).
2. Catastrophe bond issuance and amount outstanding, 1997–2017
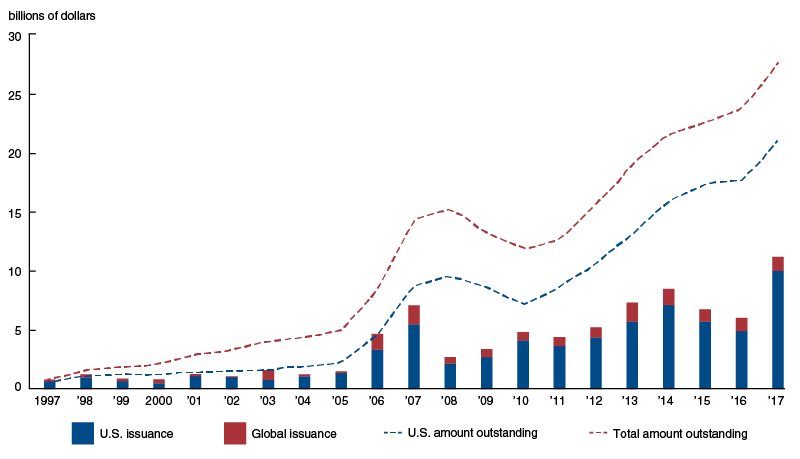
However, CAT bond issuance slumped during the financial crisis following the September 2008 collapse of Lehman Brothers, which had acted as a counterparty in some major deals. Investors determined that the underlying collateral structures that were typical for CAT bond deals at the time exposed them to too much counterparty risk. These concerns caused a complete halt in CAT bond issuance between September 2008 and January 2009, until more-secure counterparty structures were developed. After the collapse of Lehman, SPV structures that invested collateral in U.S. Treasury money market funds became the norm.13 So, by the fourth quarter of 2009, investors returned to the CAT bond market—to the tune of $1.6 billion in new issuance in that quarter alone.
The CAT bond market has seen strong growth during the post-crisis years. For instance, the amount of outstanding CAT bonds more than doubled between 2010 and 2017 (see figure 2). The persistent low-interest-rate environment has been a significant driver of non-insurance-industry capital into the CAT bond market. With yields on long-term Treasury bonds at record lows and tight spreads in corporate bonds, many institutional investors have been attracted by the relatively higher yields, along with the uncorrelated risk, that catastrophe bonds offer. Additionally, improvements in catastrophe bond modeling have enabled both CAT bond issuers to collateralize a wider range of risks and institutional investors to more easily assess the underlying risks.14
Which types of institutions use CAT bonds and why
In general, CAT bonds are issued by three different types of institutions: insurance companies, reinsurers, and state catastrophe funds. These three types of institutions employ CAT bonds in their own distinctive ways to offload their specific insurance risks. An important feature of CAT bonds that tends to differ across the issuer types is the trigger—i.e., the mechanism used to determine when payouts must be made to the bond issuer.
There are three common types of triggers for a CAT bond: indemnity, industry loss, and parametric. Indemnity triggers base CAT bond payouts on the actual insurance losses experienced by the issuer, and function similarly to traditional reinsurance. Industry loss triggers base payouts on aggregate losses to the insurance industry and employ a third-party modeler to provide an independent estimate of these covered losses. And finally, parametric triggers base payouts on the measured strength of the covered catastrophe—such as an earthquake’s magnitude or a hurricane’s wind speed and barometric pressure.
Insurance companies make up the largest group of CAT bond issuers, accounting for 60% of all CAT bond issuance (by dollar amount) over the period 1997–2017 (see figure 3). The most common triggers used for CAT bonds issued by insurers are indemnity triggers. Insurance companies use CAT bonds to reduce the risk they hold on a specific set of policies that they underwrite. Using an indemnity trigger ensures that the CAT bond will pay out when the insurance company’s actual losses reach the bond’s attachment point, which gives the insurer greater precision in its risk-management strategy compared with other types of triggers. However, because actual losses must be observed and verified before the bond can be triggered, a bond with an indemnity trigger often takes longer to pay out. On average, CAT bonds with indemnity triggers take two to three years to pay out following a triggering loss, compared with three months for CAT bonds with industry loss or parametric triggers.15
3. Global catastrophe-bond issuance, by issuer and trigger type, 1997–2017
|
Trigger type |
||||||
| Issuer type | Indemnity | Industry loss | Parametric | Multiple triggers | Unknown | Share of total issuance |
|
Insurance company |
55 |
31 |
9 |
3 |
2 |
60 |
|
Reinsurer |
12 |
57 |
21 |
9 |
1 |
25 |
|
State fund |
80 |
1 |
19 |
0 |
0 |
15 |
|
All |
49 | 33 | 14 | 4 | 1 | 100 |
Source: Author’s calculations based on data from the Artemis deal directory.
Reinsurers are the second-largest group of CAT bond issuers. In general, reinsurers do not issue insurance policies; rather, they assume the risk of policies underwritten by other institutions. Therefore, in the event of a catastrophe, they must wait for the original underwriters to determine their losses before they can quantify their own losses, which may delay payouts. Additionally, because reinsurers’ risk portfolios are based on a broad cross section of the insurance industry, their loss experience tends to be more correlated with the industry’s loss experience than that of a particular primary insurer. Given these factors, reinsurers rely mostly on industry loss and parametric triggers, which can be assessed faster than indemnity triggers and do not rely on individual insurers’ loss estimations.
State catastrophe funds are the other group of issuers of CAT bonds. The two largest U.S. state catastrophe funds are the California Earthquake Authority (CEA) and the Florida Hurricane Catastrophe Fund (FHCF). Both of these public entities help ensure that a functioning catastrophe insurance market remains in place for their state residents.
The CEA and FHCF were created in response to unprecedented natural disasters in California and Florida, respectively: In 1994 the Northridge earthquake caused insured losses of $12.5 billion, significantly more than all the earthquake insurance premiums collected in California over the previous 80 years; and in 1992 Hurricane Andrew decimated Florida and its insurance markets. Prior to the Northridge earthquake and Hurricane Andrew, private insurers in both states were required by law to cover losses resulting from such disasters in order to issue any form of property insurance. These requirements led many private insurers to either reduce coverage or pull out of the state entirely because of the perceived increased risk and lack of adequate compensation.16
In order to bring private insurers back into their states, the CEA and FHCF began taking on the catastrophe risks previously borne by private insurers. The CEA began offering earthquake insurance policies directly to homeowners, and removed the requirement that private insurers do so. The FHCF started a reinsurance-like facility to provide reimbursement to private insurers for catastrophic hurricane losses (see note 16). But by taking on multiple private insurers’ catastrophe insurance risks, these state funds amassed insurance portfolios loaded with catastrophe-related tail risk.17 To reduce their risk exposure, the state funds began using CAT bonds. Like primary insurers, U.S. state funds employ indemnity triggers as a way to ensure the risk coverage they receive from CAT bonds matches the losses in their portfolios. This risk-management strategy protects the long-run solvency of state funds by making sure that they have adequate resources to pay claims following a costly disaster.
State funds outside the U.S., such as Mexico’s FONDEN, use CAT bonds differently than their U.S. counterparts. Their goal is not to ensure a functioning insurance market, but to provide immediate funds for disaster recovery following a catastrophic event. In developing nations outside North America and Europe, private insurance has covered less than 11% of natural disaster losses since 1980 (compared with 44% in North America and 29% in Europe), leaving governments and their citizens to bear the costs of reconstruction.18 By using CAT bonds with parametric triggers, governments can establish multiyear access to insurance protection and quickly access disaster funds when their CAT bonds are triggered. Parametric triggers can be determined quickly, and they do not require countries to possess the technical expertise and infrastructure to measure natural disaster losses. For example, the Caribbean Catastrophe Risk Insurance Facility (CCRIF)—developed with the assistance of the World Bank—has used CAT bonds with parametric triggers to aid member states. After Hurricane Matthew struck the Caribbean in the fall of 2016, the CCRIF paid out a little over $20 million to Haiti and almost $1 million to Barbados within 14 days after the triggering event.19
The CAT bond market today and tomorrow
In the first half of 2018, the CAT bond market saw strong growth even after unequivocally the worst period for CAT bond investors in the market’s 20-year history. Led primarily by losses from Hurricanes Irma, Harvey, and Maria, 19 separate CAT bond tranches were triggered in the third quarter of 2017, leaving as much as $1.4 billion in outstanding issuance vulnerable to losses (the actual loss amount is not yet known given that many insurance claims still need to be resolved). Despite the historic level of losses at the end of 2017, new CAT bond issuance in the first half of 2018 reached $9.4 billion, rivaling 2017’s record start.20 Currently, the insurance industry is working to improve CAT bond modeling to cover new types of risk—such as cyberattack and terror risks. So, it appears that the uses of CAT bonds will continue to grow, offering issuers new avenues to transfer a variety of risks.
1 Andrew caused damages worth $27 billion in 1992 dollars (or $49.4 billion in 2018 dollars). Further details are available online. The insured value of $15.5 billion is from an Insurance Information Institute report.
2 Details are from the Insurance Information Institute report in note 1.
3 Reinsurers provide insurance policies for insurers. More on reinsurance is available online.
4 Details on earthquake magnitude and intensity scales are available online.
5 Details on the Mariah Re Ltd. deal, including the coupon rate, are from Bloomberg Security Master Data.
6 Data from the U.S. Department of Commerce, National Oceanic and Atmospheric Administration (NOAA).
9 See, e.g., this 2009 Reuters article.
10 See, e.g., this 2016 Aon press release.
11 Unless stated otherwise, numerical information (some based on author’s calculations) in this section is from the Artemis deal directory, available online.
15 Author’s calculations based on data from Artemis deal directory.
16 Details on the Northridge earthquake’s impact on California’s catastrophe insurance market are from this AIR Worldwide article. Details on Hurricane Andrew’s impact on Florida’s catastrophe insurance market are available online.
17 Tail risks are events that have a small probability of occurring, but can impose tremendous costs when they occur.
18 Author’s calculations based on data from Munich Re NatCatSERVICE.
19 Details on the CCRIF payouts following Hurricane Matthew are available online.
20 Author’s calculations based on data from the Artemis deal directory.


