

Between December 2015 and September 2018, a cumulative increase in the federal funds rate of 200 basis points was accompanied by a compression of 125 basis points in the difference between the yields on three-month and ten-year U.S. Treasury securities. In this Chicago Fed Letter, we examine some of the effects of the flatter yield curve on the banking sector and how they compare with the effects of similar interest rate configurations in the past.
A common feature of monetary policy tightening episodes, when the Federal Reserve raises the federal funds rate, is a flattening of the bond yield curve. This happens as the federal funds rate and other short-term interest rates move up faster than long-term rates, compressing the spread between short- and long-term rates. In this article, we examine some of the effects of a flatter yield curve on the banking sector. Because banks make most of their money by borrowing and lending at different interest rates, the slope of the yield curve has important implications for their profitability and equity values; therefore, it has the potential to affect banks’ decisions about lending and risk-taking.
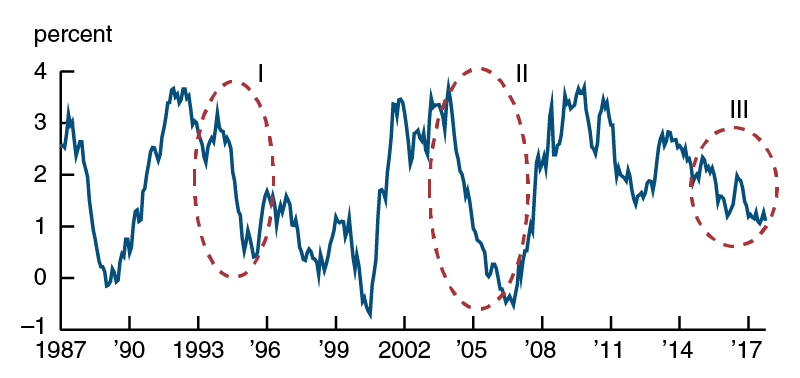
Inspired by the theoretical literature, we consider two stylized financial intermediaries: a “retail” bank that relies largely on core deposits and has mostly variable-rate loans on the asset side; and a “wholesale” bank that is funded in wholesale markets and has long-duration, fixed-rate assets. We trace out the effects of a flatter yield curve on these banks’ profitability and equity, and we discuss possible implications for their risk-taking incentives. To address the implications for the banking system as a whole, we look at the relative importance of the retail and wholesale models over time. For concreteness, we focus on three episodes of yield-curve flattening: from April 1994 to June 1995, from May 2004 to February 2006, and from December 2015 to September 2018 (see figure 1). In addition to short-term interest rates rising faster than long-term rates, all of these episodes were characterized by relatively benign economic conditions.
1. Treasury term spread
In the most recent episode, we show that the flattening of the yield curve has been associated with an increase in the average bank’s net interest margin (NIM), which is roughly the difference between the rate it earns on its assets and the rate it pays on its liabilities.1 The observation that NIMs are rising with a flatter yield curve reflects in part a post-crisis shift of the banking sector toward the “retail” business model, with a larger portion of bank assets indexed to short-term rates and a larger fraction of liabilities consisting of deposits that are not very sensitive to interest rates at all. In addition, the maturity structures of banks’ assets and liabilities are now reasonably well matched against each other. This means that bank equity values are relatively insensitive to shifts in the yield curve, because such shifts cause the values of assets and liabilities to change by similar amounts. Since NIMs are increasing with a flatter yield curve and capital is largely insulated, there would seem to be little incentive for banks to try to boost profits by increasing risk in such an environment.
Wholesale versus retail banks
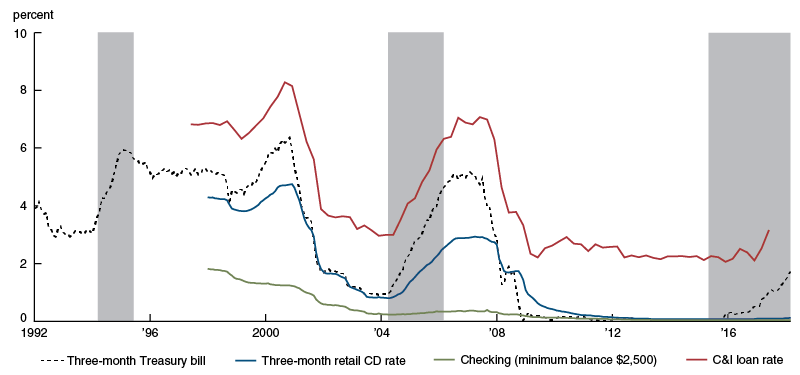
Figure 2 shows the evolution of funding and lending rates that are relevant for our hypothetical retail bank. The three flattening episodes are shaded. The interest rate paid on this bank’s liabilities, which we assume consist mostly of retail core deposits, has historically responded to rising short rates with a considerable lag.2 In the current environment, deposit rates have barely responded at all. The stickiness of retail deposits has been found to be related to bank market power and may also be influenced by inertia on the part of retail depositors.3 In contrast, interest income from assets such as commercial and industrial (C&I) loans, which tend to have variable rates tied to a particular rate index, responds quickly and automatically to a change in short-term rates. Other loan rates, such as commercial real estate (CRE), and personal loans, may respond similarly. Consequently, the bank’s net interest margin (NIM) will initially widen when the yield curve flattens in a monetary-tightening episode, as the rate increases are reflected in assets faster than in liabilities.
2. Funding and loan rates, “retail bank”
In contrast, consider our hypothetical wholesale bank. Since this bank is assumed to rely on wholesale funding, its liabilities, which we assume consist mostly of repurchase agreements and interbank loans, are priced competitively. Thus, its funding costs increase nearly one-to-one with the rise in the short rate. On the asset side, because this bank is assumed to have mostly fixed-rate, long-term assets, the relevant rate on its loans moves less than the short rate. Figure 3 shows the relevant funding and lending rates for the wholesale bank.
3. Funding and loan rates, “wholesale bank”
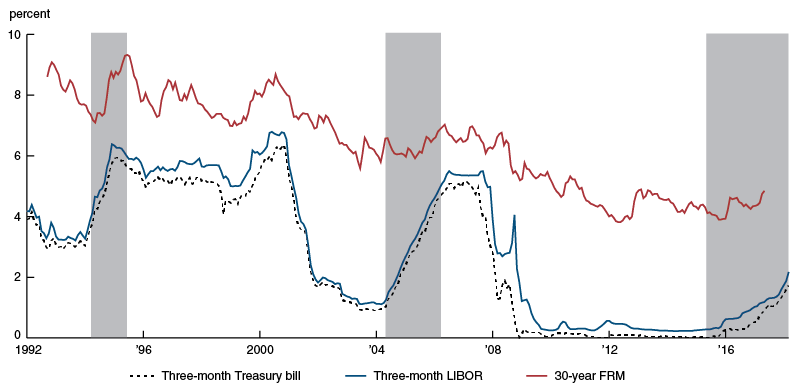
Because the wholesale bank’s funding rates move up faster than the yields on its assets, its net interest margin narrows when the yield curve flattens. In addition, because it holds long-term assets and short-term liabilities, the wholesale bank’s assets drop in value by more than the amount that its liabilities rise when interest rates go up. Consequently, this bank’s net asset value declines in response to generally higher rates. (In contrast, the retail bank’s short asset duration was closely matched to its liability duration. As a result, the yield-curve flattening and rising-rate environment have little effect on that bank’s net asset value.)
Current environment
These two examples represent stylized scenarios for how banks with very different balance sheets would be affected by a yield-curve flattening. We turn now to the empirical question of which bank model is most representative during the three yield-curve flattening episodes noted above.
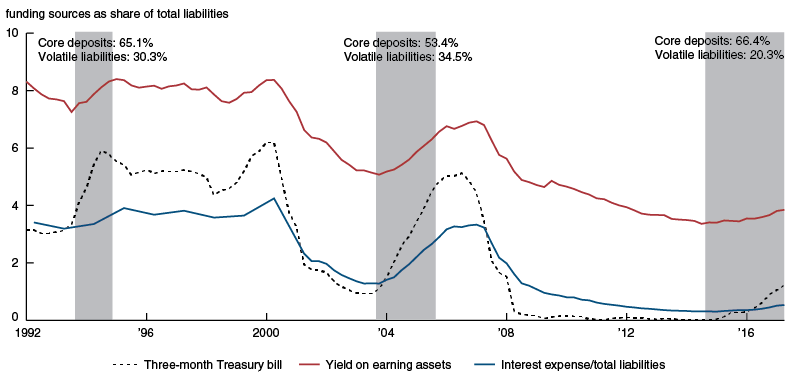
Figure 4 shows how bank funding models changed over the three episodes. During the 1994–95 tightening episode, FDIC-insured commercial banks were strongly reliant on retail funding. Core deposits accounted for 65.1% of their total liabilities. About 30% of their total liabilities comprised more volatile wholesale funding, such as securities sold under agreement to repurchase (repos) and foreign deposits.4 By the time of the 2004–05 episode, these institutions had shifted away from retail funding, and core deposits accounted for only 53.4% of total liabilities. They had also increased their reliance on volatile wholesale funding. In the current episode, banks appear again to be relying heavily on core deposits. Not only is the share of core deposits back to the 1994–95 levels of 66%, but the fraction of volatile wholesale liabilities has declined to just above 20%. These trends are also reflected in the time series of overall funding costs for commercial banks (not shown). These costs, defined as the ratio of interest expense to total liabilities, were largely flat during the 1994–95 episode and the current episode, but rose during the 2004–05 episode.
4. Impact on overall bank income and costs
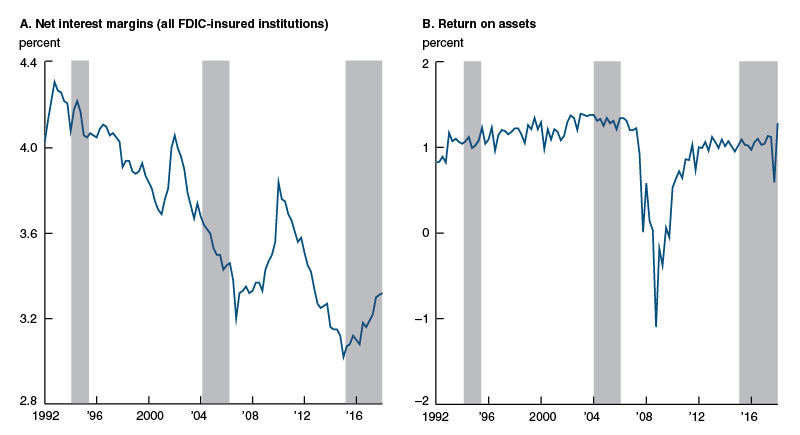
The evolving bank models are also reflected in the industry’s profitability, depicted in figure 5. NIMs remained largely unchanged during the 1994–95 tightening, but declined by close to 50 basis points during the 2004–05 episode. During the current tightening cycle, they have actually increased.
5. Impact on bank profitability
Put differently, the banking industry currently looks more like a “retail-type” institution, as it did in 1994–95, while in 2004–05 it looked more like a “wholesale-type” institution. Changes in bank business models allow banks to maintain stable performance through various yield-curve environments. The business models have evolved, in large part, in response to regulatory pressures. For example, regulations introduced after the financial crisis have pushed banks to reduce their reliance on wholesale funding and reduce the degree to which long-term assets are funded with short-term liabilities. Leverage levels have likewise moved lower in response to various regulatory changes requiring banks to hold more capital.5
Meanwhile, the industry-level series of return on assets, which captures all sources of bank profits, is essentially unaffected by the interest rate environment and the changes in bank business models. This is because banks use other sources of revenues and costs to smooth out changes in their NIMs.
To sum up, the current flattening of the yield curve appears to have increased banking-sector profitability so far, most likely because commercial banks have shifted back toward more traditional balance-sheet structures over the last decade. This shift also suggests that the flattening curve has likely had little impact on banks’ net asset values.
What about risk?
A natural question is whether the changes in banks’ profitability induced by the flattening yield curve might have an impact on their risk-taking behavior.
For wholesale banks, a flatter yield curve may induce greater risk-taking through a number of channels. As discussed earlier, when the yield curve flattens, a wholesale bank sees lower NIMs and a lower net asset value. The bank may be tempted to make up the difference by reallocating its portfolio into higher-yielding but riskier assets—a “reach for yield.” Furthermore, especially if the bank is highly levered, it may face risk-shifting incentives. Lower profitability and lower net asset value imply lower value of owners’ equity in the wholesale bank. Because of limited liability, bank owners may find it tempting to increase risk, reaping the benefits if their bets pay off and losing little if they do not.6
However, we argued earlier that the current commercial banking sector looks more “retail” in nature, and therefore NIMs are increasing with the flatter yield curve. Several competing incentives might affect retail-type banks’ decisions to take risk in this environment. Because they can earn a higher NIM on any given portfolio of assets, they might be induced to substitute somewhat into assets with lower risk. This can be thought of as a portfolio-allocation effect; it is essentially the opposite of a reach for yield. Furthermore, higher expected NIMs generally imply higher value of owners’ equity in the bank. Together with banks’ current high capital levels, this could imply a low incidence of risk-shifting incentives, since bank owners have more to lose if the bank fails. On the other hand, some have argued that banks often target a constant value at risk—for example, always adjusting their behavior to ensure that their equity does not fall to zero.7 In this case, an increase in equity values caused by a flatter yield curve may increase risk-taking. However, although this behavior might increase the volatility of assets, it would not generally lead to a greater risk of bank failure. This is because, in this scenario, the bank would increase its risk-taking only to the extent that its higher equity values provided it with a greater cushion against losses.
Finally, it is important to emphasize again that very little of the fluctuations in NIM typically end up being passed through to overall bank profitability. Banks have proven fairly nimble over time at shifting business lines to maintain profits. For this reason, fluctuations in the yield curve may not be of primary importance when it comes to banks’ choices about risk-taking.
Conclusion
The pass-through of the term structure of interest rates to a bank’s profits and equity values depends on the business model that the bank follows. Since the financial crisis, the banking sector as a whole has shifted back toward a “retail” model, with a larger emphasis on floating rate assets and interest-insensitive funding. As a result, we have shown that the recent episode of a flattening yield curve has been associated with increasing net interest margins. Meanwhile, reasonably duration-matched assets and liabilities have likely dampened the effects of interest rate changes on bank equity values. With capital at relatively high levels, these developments should provide little incentive for banks to take on additional risk.
1 Specifically, a bank’s NIM over a given period is defined as the difference between its interest income and interest expense, divided by its total interest-earning assets.
2 The Federal Deposit Insurance Corporation (FDIC) defines “core deposits” as the sum of demand deposits, all NOW and ATS accounts, money market demand accounts (MMDAs), other savings deposits, and time deposits under $250,000 (under $100,000 prior to March 2011). These deposits must be nonbrokered, i.e., raised from local customers with whom a bank has a borrowing or other relationship.
3 Itamar Drechsler, Alexi Savov, and Philipp Schnabl, 2018, “Banking on deposits: Maturity transformation without interest rate risk,” National Bureau of Economic Research, working paper, No. 24582, May, available online.
4 The FDIC definition of “volatile liabilities” includes large-denomination time deposits, foreign-office deposits, federal funds purchased, securities sold under agreements to repurchase, and other borrowings, such as Federal Home Loan Bank (FHLB) advances.
5 It is important to note that there have also been big changes outside the realm of FDIC-insured institutions. In particular, broker-dealer reliance on wholesale funding and asset-liability mismatch has been greatly reduced since before the financial crisis. These entities do not show up in the FDIC data, but they are now mostly part of the consolidated banking system.
6 “Risk-shifting” refers to behavior by equity owners to maximize the value of their claims by taking on additional risk, which diminishes the value of debtholders’ interests. For example, see Giovanni Dell’Ariccia, Luc Laeven, and Robert Marquez, 2014, “Real interest rates, leverage, and bank risk-taking,” Journal of Economic Theory, Vol. 149, January, pp. 65–99. Crossref
7 Tobias Adrian and Hyun Song Shin, 2010, “Liquidity and leverage,” Journal of Financial Intermediation, Vol. 19, No. 3, July, pp. 418–437. Crossref


