

Business fixed investment represents the spending by businesses to increase production capacity. It is traditionally decomposed into equipment (such as computers and machines), structures (such as plants, shopping malls, or warehouses), and intellectual property (such as software and R&D). After declining sharply during the Great Recession, business fixed investment (BFI) recovered in 2010, but investment was again quite low in 2015 and 2016. This slowdown was driven in part by the decline of oil prices that led to a significant contraction in the oil drilling industry. Since then, growth has resumed. Figure 1 depicts this recent history.
1. Growth rate of real business fixed investment and subcomponents
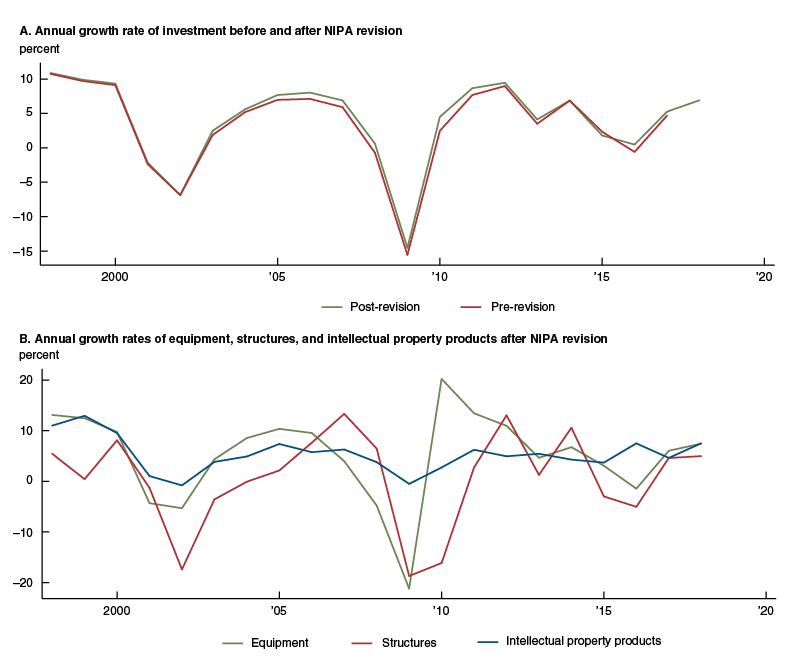
Beyond these year-to-year variations, however, recent research by academics argues that business investment has been weak over the past 20 years in a way that represents a departure from previous trends. These authors argue that this “investment puzzle” requires a specific explanation. Different hypotheses have been advanced: Lower antitrust enforcement may have reduced competition and made firms more reluctant to add production capacity; the rising influence of shareholders might have curtailed overinvestment by managers; or the offshoring of manufacturing production may have led firms to relocate production capacity abroad.2 The “investment puzzle” has attracted attention in the news media and policy circles.3
In this Chicago Fed Letter, I argue first that recent data, in particular the 2018 comprehensive National Income and Product Accounts (NIPA)4 revision, suggest that investment is not especially low. Of course, “low” is a vague term—investment needs to be assessed relative to a statistical or theoretical benchmark. I will show that statistically investment is not low relative to gross domestic product (GDP), though it may still be somewhat low relative to profits or to the stock market, which are themselves somewhat elevated relative to GDP. I will also illustrate how, before the 2018 revision, the capital–output ratio (the value of fixed production assets per unit of output) was substantially below trend, but this under-accumulation of capital appears substantially smaller after the revision. (This ratio is a key factor determining the level of production in the medium run, and lower investment should lead to a lower capital–output ratio eventually.) For a theoretical benchmark, I will illustrate how investment fares according to the standard neoclassical user cost model of investment (Hall and Jorgensen, 1967), based on the results of a recent research paper (Farhi and Gourio, 2018). The main result here is that given the decline of the user cost, capital accumulation should have increased, but it did not. In that sense, there is an investment puzzle.
The 2018 NIPA comprehensive revision
Periodically, the U.S. Bureau of Economic Analysis (BEA) revises its estimates of GDP, as well as the rest of the NIPA, to take into account better data that have become available or to reflect improvements in methodology. These revisions effectively rewrite the macroeconomic history of the United States.
In July 2018, the BEA released a comprehensive revision. While the changes to GDP were fairly small, the revisions to BFI were large and affected a long period, going back to 2003.5 Figure 2 presents the average revision in the annual growth rate of expenditures (i.e., nominal spending), prices, and real quantities for total investment and for each subcomponent, over the 2003–17 period. For overall investment, the growth rate of expenditures was revised up by 0.35% on average, while the growth rate of prices was revised down by 0.38% on average. Because the real quantity growth rate is the difference between the expenditure growth rate and the price growth rate, the overall change in real investment growth was 0.73% on average. The largest changes were in the equipment category, where prices are now estimated to have fallen significantly faster than previously thought. On the other hand, the real quantity revision for structures is negligible.
2. Revision impact on growth of business fixed investment expenditures, price index, and real quantities, 2003–17
|
Total business |
Equipment |
Intellectual |
Structures |
|
|---|---|---|---|---|
|
Expenditures |
0.35 |
0.31 |
0.50 |
0.20 |
|
Prices |
–0.38 |
–0.72 |
–0.35 |
0.18 |
|
Real quantities |
0.73 |
1.04 |
0.85 |
0.02 |
Source: U.S. Bureau of Economic Analysis data via Haver Analytics.
Figure 1 shows the pre- and post-revision estimates of BFI growth: The difference may seem small, and it certainly does not significantly affect the business cycle narrative. However, as we will see, these changes end up significantly altering the long-term trends that have been the subject of recent academic studies, because relatively small changes to growth rates affect the overall level of investment and even the capital stock (the overall stock of equipment, structures, and intellectual property), if they are long-lasting.
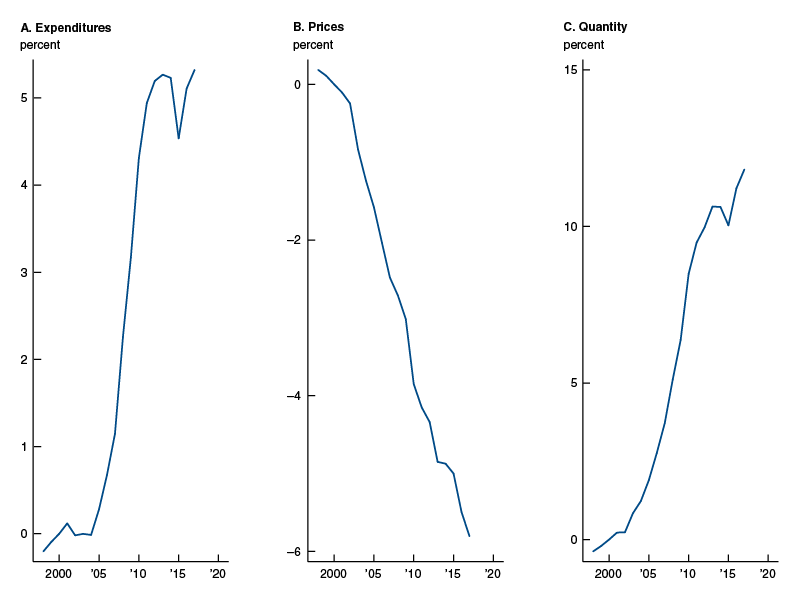
To get a first sense of this cumulated effect, figure 3 shows the effect of the revisions for the level (rather than the annual growth rates) of expenditures, prices, and real quantities on total investment. Expenditures in 2017 are now about 5% higher than previously thought and prices about 6% lower, leading to about 11% higher real investment.
3. Revision effect on level of business fixed investment expenditures, prices, and real quantities
Capital deepening
Going one step further, I now illustrate the effect of the 2018 NIPA revision on capital accumulation and in particular on the capital–output and capital–labor trends. As an economy grows, it tends to increase the amount of capital available per worker. Given that the price of capital tends to fall over time,6 there is also a rise in the ratio of capital to output (where both capital and output are measured in real quantity terms). Figure 4 illustrates this using the ratio of the log of capital stock7 to potential output since 1960, pre- and post-NIPA revision, together with a linear trend. In a previous Chicago Fed Letter, Thomas Klier and I showed that the current level of capital was low relative to output, i.e., there was a deviation from this historical trend (Gourio and Klier, 2015). The pre-revision data showed that this fact remained true as of 2017: The capital–potential output ratio was 9.8% below the trend line.8 However, the 2018 revision changed this picture substantially: The capital–output is only 3.8% below trend. Figure 4 illustrates how the gap is much smaller at the end of the sample with the post-revision data. The change is driven by the fact that capital has been revised up by 6.7%.
4. Capital–output ratio and linear trend
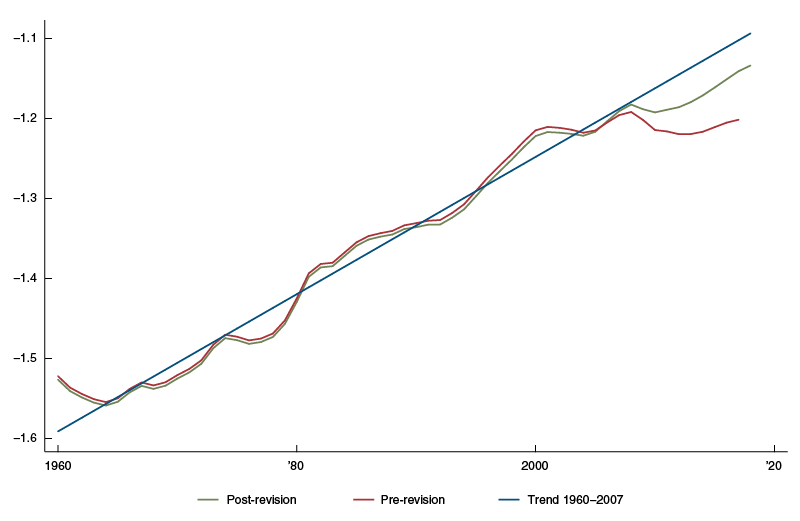
Sources: U.S. Bureau of Labor Statistics and Congressional Budget Office data via Haver Analytics.
Figure 5 presents a variety of alternative calculations to gauge the robustness of this result. I use different dates to draw the trend lines: 1985–2007, 1985–2017, 1960–2007, and 1960–2017. I consider alternative measures of capital accumulation: In addition to the ratio of capital to potential output, I also use the ratio of capital to actual output or capital to labor. In all cases, I find a significant reduction in the gap after the revision, often by a factor of half or more.
5. Percentage deviations from trend as of 2017
|
|
Dates used to estimate trend |
|||
|
Start date |
1985 |
1985 |
1960 |
1960 |
|
End date |
2007 |
2017 |
2007 |
2017 |
|
Capital–potential output |
||||
|
Post-revision |
–3.7 |
–0.5 |
–3.8 |
–1.7 |
|
Pre-revision |
–9.5 |
–3.0 |
–9.8 |
–5.7 |
|
Capital–output |
||||
|
Post-revision |
–2.6 |
–2.1 |
–6.0 |
–4.1 |
|
Pre-revision |
–7.6 |
–4.9 |
–10.9 |
–7.8 |
|
Capital–labor |
||||
|
Post-revision |
–10.2 |
–6.7 |
–10.5 |
–8.2 |
|
Pre-revision |
–15.0 |
–9.6 |
–16.1 |
–12.4 |
|
GDP |
||||
|
Post-revision |
–16.6 |
–4.8 |
–18.2 |
–9.9 |
|
Pre-revision |
–17.2 |
–5.4 |
–19.1 |
–11.0 |
|
Business fixed investment |
||||
|
Post-revision |
–22.5 |
–6.0 |
–17.5 |
–9.0 |
|
Pre-revision |
–28.7 |
–8.2 |
–25.2 |
–14.0 |
|
Equipment |
||||
|
Post-revision |
–28.9 |
–8.0 |
–17.8 |
–9.1 |
|
Pre-revision |
–37.1 |
–11.7 |
–28.1 |
–15.9 |
|
Structures |
||||
|
Post-revision |
–0.8 |
2.0 |
–24.7 |
–11.5 |
|
Pre-revision |
1.2 |
5.6 |
–24.7 |
–10.8 |
|
Intellectual property products |
||||
|
Post-revision |
–28.7 |
–8.8 |
–27.3 |
–15.6 |
|
Pre-revision |
–36.0 |
–12.7 |
–35.9 |
–22.3 |
Sources: Author’s calculations based on U.S. Bureau of Labor Statistics, U.S. Bureau of Economic Analysis, and Congressional Budget Office data via Haver Analytics.
Another approach is to look at the deviation from trend of investment and compare it to the deviation from trend of GDP. Is it true that investment has fallen significantly relative to GDP? Figure 5 reports the deviations from trend for these series, pre- and post-revision. We see that pre-revision, the investment deviation was indeed larger than the GDP deviation. For instance, using the 1960–2007 trend, the GDP deviation as of 20179 was –19.1%, while the investment deviation was –25.2%, so investment was indeed lower relative to its trend than GDP. Post-revision, these gaps are –18.2% and –17.5%, respectively—remarkably close. Hence, a natural conclusion from these data is that real investment is not especially low today, relative to real GDP.10
How to reconcile these results with academic commentary?
In contrast to the academic works I mentioned earlier, the simple statistics I present here do not exhibit a clear weakness (though admittedly, the capital–output ratio remains below trend). There are a number of reasons for the different results.
First, most of these studies were written before the recent NIPA revision, so they relied on data that did show a significant weakness of investment or capital accumulation.
Second, some studies focus on equipment investment rather than the broader fixed investment measure I consider. However, a rising share of investment occurs in the intellectual property categories, in particular software. To the extent that this investment is a substitute for equipment investment, one would want to include it to characterize the evolution of investment broadly.
Third, some studies use different measures of investment. For instance, they may use investment net of depreciation rather than gross investment, or they may use capital measured at resale value (i.e., from the fixed asset tables of the BEA) rather than as at rental value (i.e., from the BLS measure). Which measure is preferable depends on the question studied and the theoretical framework. My preference for the capital–output ratio is that many economic models emphasize this ratio as a key factor determining the level of production in the medium run, and this variable ought to be a sufficient statistic, e.g., lower net investment should lead to a lower capital–output ratio eventually.
Fourth and most interestingly, most studies depict investment as weak not relative to GDP, but relative to other measures, such as profits or stock prices, which are themselves elevated relative to GDP. This raises the question whether it is in fact investment that is especially low or these other aggregates that are especially high? What is the right benchmark for investment? To answer this question, one needs a theory.
A neoclassical benchmark for investment
One way to benchmark what investment should be is to compare the evolution of the capital–output ratio and that of the user cost of capital. The user cost of capital measures the cost for a business to rent a unit of capital for one year. The box below describes the concept mathematically. Intuitively, businesses will hire more capital if the user cost (rental cost) is lower. This user cost depends principally on the cost of funding the investment, and the loss of value of capital owing to both physical depreciation (wear-down) and economic depreciation (obsolescence).
Measuring the user cost is not straightforward. For example, estimates of depreciation are imperfect at best. Another important issue is the measure of the cost of funding. Some authors have argued that the user cost has gone down significantly over the past 30 years due to a decline in the cost of funds, as reflected in real interest rates (for a particularly clear example, see Barkai, 2017). As a result, we should have seen a large increase in capital accumulation as firms took advantage of cheaper capital. In this sense, there is a deep investment puzzle, not because investment is low, but because it should be high given the low user cost. So something must have happened, such as a change in competition, shareholders’ rising influence, or offshoring of manufacturing production.
In a recent research paper (Farhi and Gourio, 2018), we revisit this result and emphasize that the cost of funding relevant for the user cost needs to reflect the inherent riskiness of private investment. We use a standard neoclassical model to infer the correct risk adjustment (or risk premium). Our procedure (discussed in more detail in our paper, and in a recent Chicago Fed Letter [Farhi and Gourio, 2019]) allows us to distinguish the role of real interest rate, the risk premium, competition, and other factors that affect investment.
Based on stock price data, we find that the risk premium has risen. When we take this into account, we obtain that the cost of funds has actually not fallen as much as estimated by previous authors, such as Barkai (2017). As a result, the investment puzzle is somewhat alleviated—the level of investment is not dramatically out of line compared with the user cost. Like Barkai (2017), we infer that competition has become more limited, but we estimate a smaller change than he does.
Conclusion
Capital accumulation is a key factor for growth, so low business fixed investment is of concern. I have shown that the recent NIPA revision leads to a much brighter picture for recent capital accumulation. As a result, the statistical case for an investment puzzle relative to GDP has become weaker. From an economic point of view, however, there remains an investment puzzle, because we should have seen an increase in investment given the relatively low user cost of capital.
Box 1. The user cost of capital
The formula for the user cost of capital, abstracting from taxes, is:
$uc=q\times\left( r+\unicode{x03B4} -{{g}_{q}} \right),$where $q$ is the purchase price of capital, $r$ is the cost of funding (in percent), $\unicode{x03B4} \,$ is the rate of physical depreciation (in percent), and ${{g}_{q}}$ is the (expected) rate of loss of value of the capital stock (in percent).
To understand this formula, note that the right-hand side corresponds to the “fair” cost of renting, i.e., the normal compensation an owner of a piece of capital ought to receive to offset their costs. The costs are threefold: First, the owner had to invest to purchase the capital to be able to rent it; second, the capital will wear down, leading to lower value or higher maintenance costs; and third, the capital may lose value due to obsolescence. This formula is useful because rental rates are rarely observed—many firms own their capital and do not rent it (or lease it). The formula allows us to deduct a rental rate from observables.
If the firm’s technology and the market structure are such that the firm makes a profit $\unicode{x03C0} (k)$ when it operates with $k$ units of capital, then the optimal choice of capital satisfies the first-order condition:
${\unicode{x03C0} }'(k)=uc.$1 The author thanks Spencer Krane for useful comments and discussions.
2 For examples of academic studies emphasizing weak capital accumulation, consider Hall (2015); Alexander and Eberly (2018); Gutiérrez and Philippon (2017a, 2017b); Crouzet and Eberly (2018); Kozlowski, Veldkamp, and Venkateswaran (2017).
3 For examples of policy and newspaper discussions, see this chart; Crouzet and Eberly (2018); and the 2017 ECB Sintra forum on central banking, available online.
4 The National Income and Product Accounts (NIPA) are a set of statistics calculated by the U.S. Bureau of Economic Analysis (BEA). These statistics include gross domestic product (GDP) and business fixed investment, a component of GDP.
5 The two most important changes affecting investment are the treatment of in-house software, from an expenditure basis to a capitalization basis, and the improvements of some price deflators for high-tech equipment.
6 See, for instance, Greenwood, Hercowitz, and Krusell (1997) or Fisher (2006).
7 To measure capital, we use the U.S. Bureau of Labor Statistics (BLS) index of capital services, which weights underlying capital goods using rental rates, which are appropriate weights to production capacity. This index is produced by the BLS as part of its multifactor productivity program, available online, and covers the nonfarm business sector. For consistency, I use the output and labor measures the same BLS source.
8 The trend line here is estimated using the post-revision data over the 1960–2007 period. Later, I present results using other dates to draw the trend.
9 I use 2017 rather than 2018 because the pre-revision data for 2018 do not exist; for the post-revision data, these deviations from trends are quite close in 2018 to 2017.
10 Similar results are obtained using expenditure, rather than real quantities—the investment–output ratio is not especially low.
References
Alexander, Lewis, and Janice Eberly, 2018, “Investment hollowing out,” IMF Economic Review, Vol. 66, No. 1, March, pp. 5–30. Crossref
Barkai, Simcha, 2017, “Declining labor and capital shares,” London Business School, working paper, available online.
Crouzet, Nicolas, and Janice Eberly, 2018, “Understanding weak capital investment: The role of market concentration and intangibles,” paper presentation at the Federal Reserve Bank of Kansas City Jackson Hole economic policy symposium, Changing Market Structures and Implications for Monetary Policy, Jackson Hole, WY, August 24, available online.
Farhi, Emmanuel, and François Gourio, 2019, “What is driving the return spread between ‘safe’ and ‘risky’ assets?,” Chicago Fed Letter, Federal Reserve Bank of Chicago, No. 416. Crossref
Farhi, Emmanuel, and François Gourio, 2018, “Accounting for macro-finance trends: Market power, intangibles, and risk premia,” Brookings Papers on Economic Activity, forthcoming.
Fisher, Jonas D. M., 2006, “The dynamic effects of neutral and investment-specific technology shocks,” Journal of Political Economy, Vol. 114, No. 3, June, pp. 413–451. Crossref
Gourio, François, and Thomas Klier, 2015, “Recent trends in capital accumulation and implications for investment,” Chicago Fed Letter, Federal Reserve Bank of Chicago, No. 344, available online.
Greenwood, Jeremy, Zvi Hercowitz, and Per Krusell, 1997, “Long-run implications of investment-specific technological change,” American Economic Review, Vol. 87, No. 3, June, pp. 342–362, available online.
Gutiérrez, Germán, and Thomas Philippon, 2017a, “Declining competition and investment in the U.S.,” New York University, Stern School of Business, working paper, November, available online.
Gutiérrez, Germán, and Thomas Philippon, 2017b, “Investmentless growth: An empirical investigation,” Brookings Papers on Economic Activity, Fall, pp. 89–169, available online.
Hall, Robert, 2015, “Quantifying the lasting harm to the U.S. economy from the financial crisis,” in NBER Macroeconomics Annual 2014, Jonathan A. Parker and Michael Woodford (eds.), National Bureau of Economic Research, Vol. 29, Chicago: University of Chicago Press, pp. 71–128.
Hall, Robert E., and Dale W. Jorgensen, 1967, “Tax policy and investment behavior,” American Economic Review, Vol. 57, No. 3, June, pp. 391–414, available online.
Kozlowski, Julian, Laura Veldkamp, and Venky Venkateswaran, 2017, “The tail that wags the economy: Beliefs and persistent stagnation,” New York University, Stern School of Business, working paper, January 13, available online.


