

Introduction and summary
Real, or inflation-adjusted, interest rates may well be the most important prices for any nation’s economy. They govern intertemporal purchasing decisions facing households, firms, and all levels of government. That is, virtually all interactions in the marketplace that entail making a choice between spending now and spending later necessarily involve real interest rates, which specify the real cost of borrowing to make a purchase or, on the flip side, the real gain from saving.
As we show in a recent paper (Yi and Zhang, 2016), there is no discernible trend in long-run real interest rates1 for the 20 largest economies in the world that spans the entirety of the past 60 years. However, over three subperiods, distinct trends can be observed.2 We see a general decline in global real interest rates from the early 1960s through the mid-1970s, then an upward trend in these rates until the late 1980s, and finally, another downward trend through the present day. Moreover, we observe that long-run averages of real interest rates across countries have converged over the past quarter of a century—a pattern consistent with an increasingly financially integrated world.
In this article, we use a simple theoretical framework to derive the fundamental economic forces behind movements in long-run real interest rates. Our framework implies an arbitrage relationship that links the risk-free real interest rate to the marginal product of capital, or MPK (the additional output from an extra unit of physical capital, such as machinery); the depreciation rate of capital; and the risk premium (which captures the riskiness of a capital investment). Specifically, the lower the MPK, the higher the depreciation rate of capital, and the greater the risk premium, all else being equal, the lower the real interest rate is. In addition, we use our framework to derive the forces underlying MPK itself—such as total factor productivity (TFP)3 and the capital-to-labor ratio. A decrease in TFP and an increase in the capital-to-labor ratio will tend to decrease MPK (and therefore real interest rates).
We examine the long-run averages of real interest rates and these related variables for 20 countries during the past 60 years or so. We find that the declining trend in long-run MPKs is consistent with the declining trend in long-run real interest rates in the 1960s and early 1970s. However, over the past three to four decades, the relationship between the two variables appears to have weakened. This implies that movements in long-run risk premiums have played a growing role in explaining the trend in long-run real interest rates. In particular, the estimates of the long-run interest rates and MPKs suggest that long-run risk premiums have increased as long-run real interest rates have decreased over the past two decades.
It is difficult to predict what will happen to long-run averages of real interest rates in the United States and abroad. However, we present evidence that growth in U.S. total factor productivity and growth in the global working-age population (factors affecting MPK) are projected to be lower than they were before. These shifting trends are expected to continue to put downward pressures on long-run real interest rates.
Understanding the fundamentals driving long-run real interest rates matters for the household, business, and government sectors of an economy and especially for monetary and fiscal policymakers. For monetary policymakers (central bankers), the long-run real interest rate may provide a useful reference point to help calibrate the future path of the monetary policy interest rate so that the central bank provides the appropriate level of accommodation. For example, versions of the Taylor rule4 (a well-known economic equation for setting the monetary policy rate) have an intercept term that can be interpreted as the long-run real interest rate. To the extent that this term is time varying, it implies that the appropriate level of interest rates to achieve a desired level of monetary policy accommodation is also time varying for reasons beyond what would be implied by the unemployment gap and inflation gap terms (explained in more detail later). Moreover, the continuing downward pressures on long-run real interest rates are consistent with the hypothesis that monetary policy rates in the United States and other countries are more likely than before the Great Recession and global financial crisis to hit the effective lower bound in the years ahead. Keeping monetary policy rates from hitting the effective lower bound, as they did for some nations during the Great Recession, is important because monetary authorities may find themselves struggling to stimulate their weak economies when short-run nominal interest rates are already at virtually zero. The potential of again facing the challenges associated with the monetary policy rates being at the zero lower bound (ZLB) underscores the need for gaining better insights into what may be affecting movements in long-run real interest rates.5
Understanding what’s behind the movements in long-run real interest rates is also important for fiscal policymakers, albeit for somewhat different reasons. Low interest rates are sometimes used as the rationale for expansionary fiscal policy because they lower the costs of servicing government debt used to finance public spending. But evaluating the fiscal implications of low long-run real interest rates requires a careful quantitative assessment of the variety of channels by which these rates can be affected. Such due diligence is likely to help government officials better understand the short- and longer-term ramifications of their fiscal decisions today (which we will elaborate on later).
In the next section, we discuss the broad patterns in the evidence on long-run real interest rates for the 20 largest economies since the 1950s. We also go over some of the hypotheses for why interest rates have declined and then stayed so low in recent years. In the following section, we present a simple theoretical framework to derive the fundamental economic forces behind movements in long-run real interest rates. Throughout the subsequent sections, we point out trends in the available data for the underlying variables suggested by our theoretical framework and then draw some conclusions about which of them may have had a greater impact on the movements of long-run real interest rates in the distant and recent past. Moreover, we discuss what projections for certain underlying variables may suggest for future long-run real rates. Finally, we further explore the implications of our evidence on long-run real interest rates (and the underlying variables) for both monetary and fiscal policy.
Evidence on long-run real interest rates
Here we present our estimates of long-run real interest rates for (up to) 20 countries between 1955 and the present.6 The list of countries (given in the appendix) comprises the largest economies in the world as measured by gross domestic product (GDP) in 2014 dollars.7 We broadly follow the approach used in Hamilton et al. (2015) to compute real interest rates. Wherever possible, we use the policy interest rate as our measure of the short-run nominal interest rate, and we use the then-current inflation rate as our measure of the expected inflation rate the following year to derive the short-run real interest rate (details are in the appendix). To compute long-run real interest rates, we calculate 11-year centered moving averages of annual real interest rates.8 Hereafter, we will refer to the 11-year centered moving averages of annual real interest rates as long-run real interest rates. Economists are typically interested in long-run real interest rates because they reflect the trends in the fundamental forces underlying them. Indeed, movements in real interest rates owing to frictions such as “sticky” prices and wages9 and to short-run shifts in productivity, oil prices, monetary or fiscal policy, and other forces “wash out” over long periods of time, leaving only trends in the fundamentals driving real interest rates over the long run.
Figure 1 presents long-run real interest rates for the G7 (Group of Seven) countries—namely, Canada, France, Germany, Italy, Japan, the United Kingdom, and the United States. Two patterns are apparent. First, G7 real rates are quite close to one another, especially in recent years. Second, broad trends in long-run real rates are discernible during three subperiods of the sample: 1) a decline from the early 1960s until the mid-1970s, followed by 2) an increase until the late 1980s and then 3) another decline through the present day.10
Figure 1. G7 long-run real interest rates
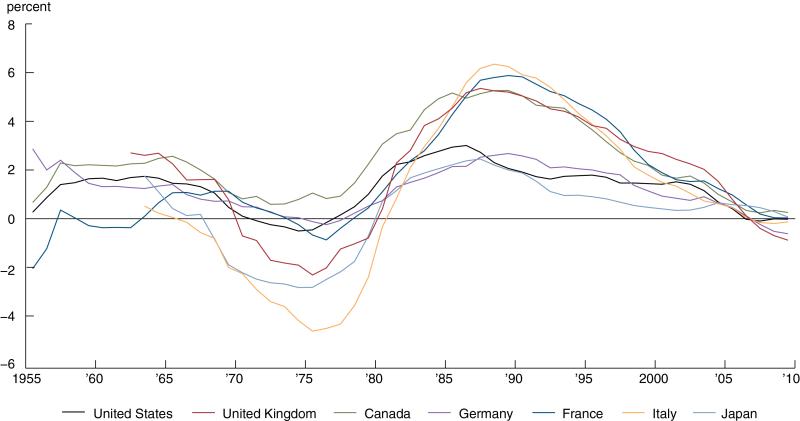
Sources: Authors’ calculations based on data from the International Monetary Fund, International Financial Statistics; and Haver Analytics.
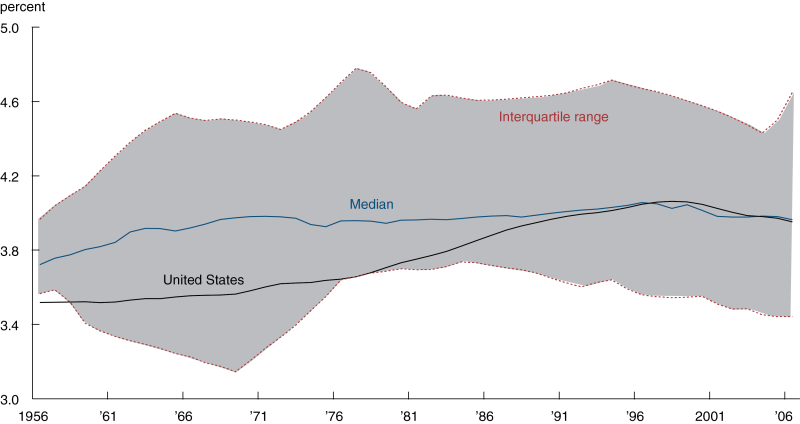
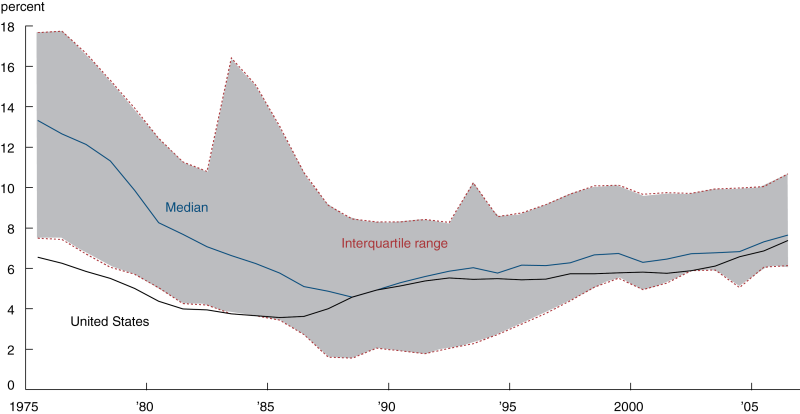
Figure 2 shows the median of the long-run real interest rates across our full sample of 20 countries for each year.11 It also presents the interquartile range of these rates across our full sample (that is, the range from the 25th percentile to the 75th percentile, or middle 50 percent of the data set) since 1975. The median long-run real interest rate follows the same broad trends as the G7 rates over the subperiods we identified. In particular, the median closely tracks the U.S. long-run real interest rate path. The magnitude of the trend movements in the median is quite large—on the order of 4 percentage points from its low to its high. Finally, note the compression of the interquartile range (the shaded area between the red dashed lines) over time. Since the late 1980s, this range has declined from about 5 percentage points to about 1 percentage point. This narrowing of the range shows that real interest rates across countries have converged over time.
Figure 2. U.S. and median long-run real interest rates
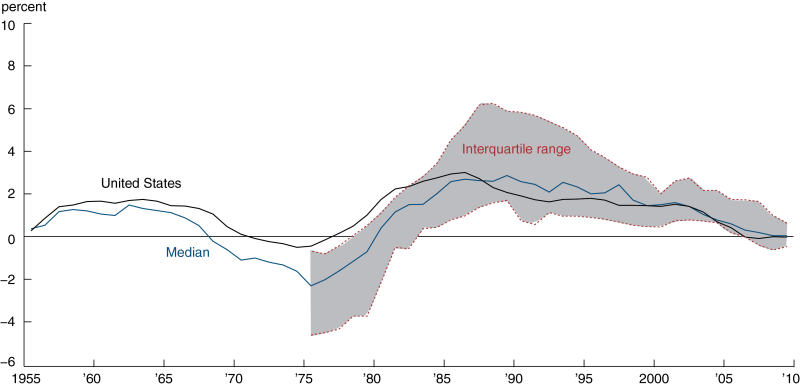
Sources: Authors’ calculations based on data from the International Monetary Fund, International Financial Statistics; and Haver Analytics.
The recent decline in real interest rates around the globe has generated a great deal of attention and speculation. To help explain the current discussion about this topic, we presented in our previous economic policy paper a simple investment–savings diagram that describes the demand and supply of investable funds (Yi and Zhang, 2016, figure 312): There we showed that investment demand declines, while the saving supply rises, as the interest rate moves up. Many factors may shift down the demand curve, lowering interest rates and investment or savings rates. For example, some economists have posited “secular stagnation” as an explanation for why real interest rates remain so low today. This hypothesis asserts that persistent declines in aggregate demand and/or U.S. productivity growth will lead to lower GDP growth, investment rates, and real interest rates for many years.13
Many other factors may shift up the supply curve, leading to lower interest rates and higher investment or savings rates. For example, the “global saving glut” hypothesis14 asserts that the graying of the population in some industrialized countries (such as Japan) and the increasing wealth of residents of fast-growing emerging economies (such as China) beginning in the early 2000s are the primary drivers shifting up the supply curve and pushing down real interest rates.
In our previous economic policy paper, we examined the broad evidence on the volume of global investment since the early 1960s (Yi and Zhang, 2016). We found a broad increase in the ratio of global fixed investment to GDP from the early 1960s until about the late 1970s and then a fairly steady decline in this ratio through the present day. The United States exhibits a similar pattern, although the recent decline in its fixed-investment-to-GDP ratio is more pronounced (see Yi and Zhang, 2016, figure 4).
The overall declining trend in the fixed-investment-to-GDP ratio since the early 1980s and the declining trend in long-run real interest rates since the late 1980s suggest the importance of changes in global investment demand in explaining movements in real rates. We, therefore, look for evidence on the sources of this downward shift in global investment demand.
Theoretical framework for long-run real interest rates
Because changes in desired investment are important to understanding movements in long-run real interest rates, we develop from the firm’s profit-maximization problem a simple theoretical framework, as well as the usual arbitrage condition linking the risk-free real interest rate to the risky return on capital.
For the capital choice, a firm will increase the amount of capital it employs until the cost of one additional unit of capital just equals the expected benefit of one additional unit of capital. The cost of one additional unit of capital is the rental rate of capital—that is, the real interest rate plus the depreciation rate of capital. The expected benefit of one additional unit of capital is the expected additional output from that unit, which we call the expected marginal product of capital. In addition, because the return to the additional unit of capital is risky, there is a risk premium that is subtracted from the benefit. Equating marginal cost and marginal benefit and rearranging terms yield the following relationship at any date t:
1) rt = Et [MPKt +1] – δt – RPt ,
where rt is the real interest rate, Et [MPKt +1] is the expected marginal product of capital, δt is the depreciation rate of capital, and RPt is the risk premium on capital. Equation 1 shows that the real interest rate is tied to the expected marginal product of capital, the depreciation rate, and the risk premium. Decreases in the expected MPK, increases in the depreciation rate, and/or increases in the risk premium will be, all else being equal, reflected in a decrease in the real interest rate. In a long-run context, we interpret each of these variables as a long-run average (specifically, an 11-year centered moving average of annual values).
In the standard framework that underlies most models used to study the effects of monetary and fiscal policies, such as dynamic stochastic general equilibrium (DSGE) models, the economy has a long-run “balanced growth equilibrium,” in which all key macroeconomic variables (GDP, capital, consumption, etc.) grow at the same rate in the absence of shocks. The real interest rate in a balanced growth equilibrium is determined by just two forces: the long-run growth rate of TFP and households’ rate of time preference (that is, households’ preference for current consumption over future consumption—or their inclination to spend now instead of saving for a future need). In an alternative framework that allows for more sophisticated treatments of demographics, the growth rate of employment (or population) also influences the real interest rate in the balanced growth equilibrium. (These relations are presented in the appendix.)
As we will illustrate later, our main results based on equation 1 are robust to two important extensions of this basic framework. First, we extend equation 1 to allow for multiple sectors in the economy; in particular, we make a distinction between the capital goods sector and the consumption goods sector. In this context, the return to an additional unit of capital needs to be appropriately measured in units of final consumption goods. The appropriate adjustment factor is the relative price of consumption goods to capital goods, Pt +1. The first extension of the baseline model—which we call the “multisector” MPK relationship—is given as follows:
2) rt = Et [Pt +1 * MPKt +1] – δt – RPt .
Second, we extend equation 1 to a global setting. In such a setting, countries engage in international capital flows while trading goods and services with one another (exporting/importing is permitted in the model). Generally, in an open economy, the goods that a country produces differ from the goods a country consumes. When considering investment returns, we need to convert the MPK measured in units of goods that are produced into units of goods that are consumed.15 The second extension of the baseline model—which we call the “open economy” MPK relationship—is given as follows:3) rt = Et [Qt +1 * MPKt +1] – δt – RPt ,
where Qt +1 is the relative price of a country’s output basket to its consumption basket. Note the important distinction between the multisector extension and the open economy extension: The former focuses on the relative price of consumption goods to capital goods, while the latter focuses on the relative price of output to consumption goods. To isolate the impact of the open economy, we maintain the one-sector assumption in the open economy extension.
Under standard Cobb–Douglas production, the marginal product of capital itself depends on the share of income that accrues to capital, as well as on total factor productivity and the capital-to-labor ratio:
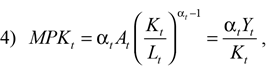
where αt is the capital share of income; At is total factor productivity; and Kt , Lt , and Yt are capital, labor, and output, respectively. Decreases in the capital share and total factor productivity and an increase in the capital-to-labor ratio will tend to decrease the marginal product of capital. We will explore the forces driving the dynamics of MPK using this equation in the empirical investigation.
Evidence on the fundamental forces underlying long-run real interest rates
In equation 1, the expected MPK and the depreciation rate of capital are linked to the long-run real interest rate. We follow the approach of Caselli and Feyrer (2007) to compute MPK. Our data come from the Penn World Table 8.016 and from recent research by Monge-Naranjo, Sánchez, and Santaeulàlia-Llopis (2016).17 Later on we also examine the components underlying MPK.
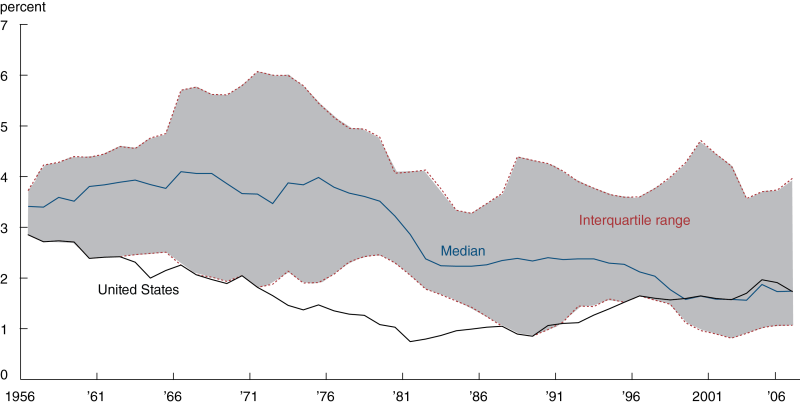
We assume that over the long run, expected MPK equals actual MPK. We also assume that an 11-year centered moving average is a sufficient measure for long-run MPK (as it was for the long-run real interest rate). We allow the capital share of income α to be country specific and time varying.18 Panel A of figure 3 presents (according to the baseline model, or equation 1) the long-run MPK for the United States; the median of long-run MPKs across our full sample of 20 countries; and the interquartile range (25th to 75th percentile) of long-run MPKs across this sample (the shaded area between the red dashed lines). The patterns for the median long-run MPK are very clear: It dropped sharply, by about 5 percentage points, between the mid-1960s and the mid-1980s. Since then, it has remained at a level of about 11 percent.
Figure 3. Long-run marginal products of capital
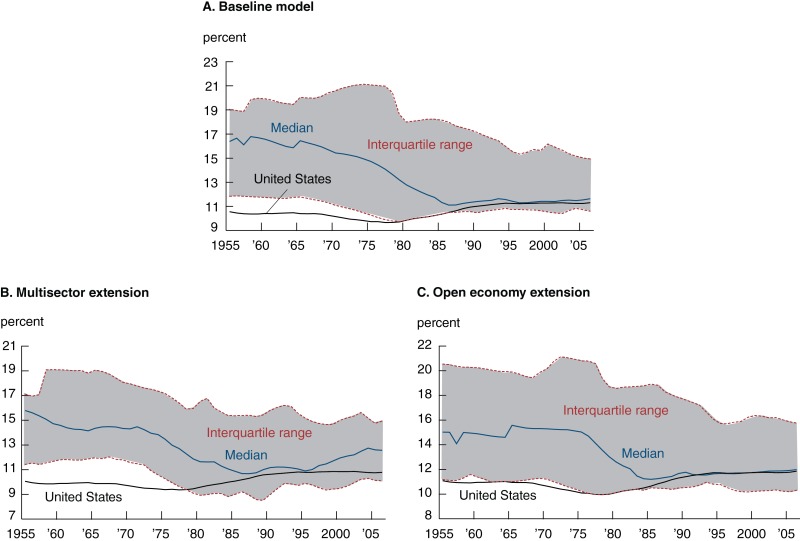
Sources: Authors’ calculations based on data from Penn World Table 8.0; and Monge-Naranjo, Sánchez, and Santaeulàlia-Llopis (2016).
The observed overall decline in long-run MPK during the period 1955–85, as well as the decline in TFP growth that we show later, is consistent with the textbook growth model in which diminishing returns to capital accumulation eventually set in. This story fits the data for a number of countries, especially those that went through a period of rapid growth—owing to the recovery from World War II or integration into the global economy—in the 1950s, 1960s, and 1970s. This decline in long-run MPK through the mid-1980s does not closely track the trends in the long-run real interest rates presented in figures 1 and 2. Since 1980, the interquartile range of long-run MPKs has narrowed somewhat, indicating a convergence in long-run MPKs across the globe. Our theoretical framework shows that, all else being equal, this will be associated with the convergence in long-run real interest rates over this period. However, the convergence in long-run MPKs is less than that of long-run real interest rates. This could be explained by the fact that it is easier to arbitrage away differences in returns with financial assets than with physical assets.
Finally, in panel A of figure 3, U.S. long-run MPK shows a relatively small decrease until the late 1970s, followed by a fairly small increase until the early 1990s; it has been flat since then. Over the first two subperiods, the movements in U.S. long-run MPK are consistent with movements in the U.S. long-run real interest rate (in figures 1 and 2).19
Panel B of figure 3 adjusts our primary long-run MPK measure to control for variation across countries in the relative price of consumption goods to capital goods, as explained earlier in our discussion about equation 2. Panel C of figure 3 adjusts our primary long-run MPK measure for an open economy setting, as explained earlier in our discussion about equation 3. These two panels show broadly similar patterns to that of the baseline measure in panel A of figure 3 in two respects: The median long-run MPK declines for most of the period between 1955 and 1985, and the interquartile range narrows for most of the period between 1980 and the end of our sample.
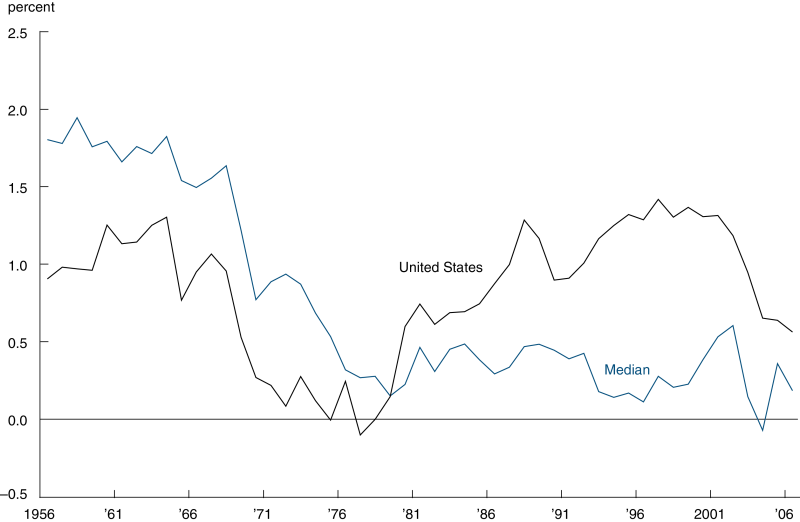
Figure 4 presents evidence on long-run capital depreciation rates across the world. Over our sample period for these depreciation rates, there is a gradual upward trend in them—consistent with a shift in the composition of capital away from structures toward equipment, machinery, and software. The movements in the median long-run capital depreciation rate are small in comparison with the movements in the median long-run real interest rate (in figure 2), although notably, the United States’ long-run capital depreciation rate has risen by about half a percentage point, from the mid-1950s to the mid-2000s. Hence, outside the United States, trends in long-run depreciation rates of capital appear to be fairly insignificant in accounting for trends in long-run real interest rates.
Figure 4. Long-run capital depreciation rates
Source: Authors’ calculations based on data from Penn World Table 8.0.
As illustrated in equation 4, the factors underlying the marginal product of capital are TFP, the capital-to-labor ratio, and the capital share of income. Figure 5 shows the median of the long-run TFP growth rates across the 20 countries in our sample.20 For comparison, the U.S. long-run TFP growth rate is also shown. The figure shows that the median long-run TFP growth rate fell during the 1960s and 1970s from about 2 percent to less than 0.5 percent, and has been relatively flat since then. These patterns in the median long-run TFP growth rate are broadly consistent with the patterns in long-run MPK. Moreover, these patterns in TFP growth are broadly consistent with a story in which many countries experienced high economic growth during the 1960s and early 1970s, but then diminishing returns to capital accumulation and to technology upgrading. That said, it is clear from figure 5 that other forces beyond movements in long-run TFP growth, especially in the late 1970s and early 1980s, played a role in the decline of long-run MPK.
In figure 5, the United States’ long-run TFP growth rate shows a similar pattern to that of our sample’s median rate through the 1970s. However, the U.S. long-run TFP growth rate increased in the 1980s and 1990s, whereas the median rate did not. For the United States, the 1990s is associated with an increase in its TFP growth owing to information technology (IT) investment; since the early 2000s, however, U.S. TFP growth has declined. Note that the United States’ long-run TFP growth rate moves broadly with its long-run MPK before 2000, and moves fairly closely with its long-run real interest rate before 1986.
Figure 5. Long-run total factor productivity growth rates
Source: Authors’ calculations based on data from Penn World Table 8.0.
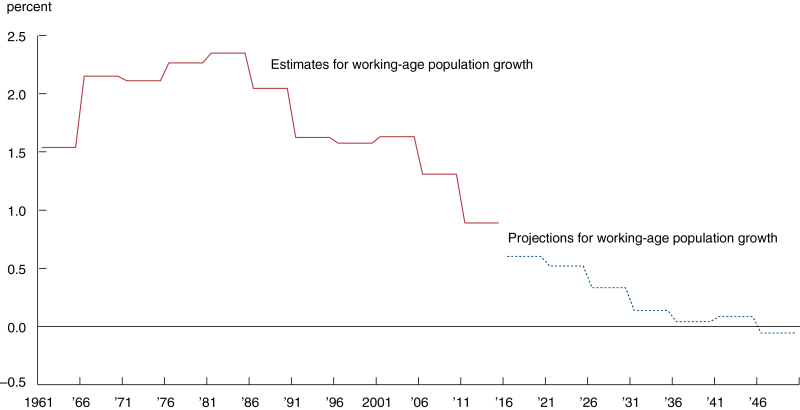
Using working-age population data from the United Nations,21 we compute the growth rate of the working-age population for our 20 countries, taken together, from 1961 through 2011. The red solid line in figure 6 shows that the growth rate of the working-age population among the nations in our sample declined from about 2.25 percent in the early 1980s to less than 1 percent in 2011.
Figure 6. Working-age population growth: Data and projections
Source: Authors’ calculations based on data from the United Nations.
Figure 7 presents the long-run rate of growth in the capital-to-labor ratio (K/L) for the United States, as well as the median and interquartile range (25th to 75th percentile) of the long-run rates of growth in the capital-to-labor ratio across our countries of interest. The median rate of growth in the capital-to-labor ratio was high in the late 1950s through the mid-1970s, but has since declined. The U.S. rate of growth in the capital-to-labor ratio declined from the 1950s to 1980, stayed roughly constant in the 1980s, and moved up from 1990 on, likely because of the IT boom of the 1990s.
Figure 7. Long-run rates of growth in the capital-to-labor ratio
Sources: Authors’ calculations based on data from Penn World Table 8.0; and the United Nations.
The MPKs depicted in figure 3, panel A —together with the rates of growth in TFP and the capital-to-labor ratio depicted respectively in figures 5 and 7—illustrate, in an accounting sense, the relative importance of each underlying factor over time. Increases in the capital-to-labor ratio push MPK down (owing to diminishing marginal returns), while increases in TFP—as well as in the capital share of income—push MPK up. From the 1950s through the early 1980s, though both TFP and the capital-to-labor ratio were growing, growth in the capital-to-labor ratio dominated growth in TFP (in part because TFP growth was declining over much of this period)—which would lead, all else being equal, to declining MPK over time. This high growth in the capital-to-labor ratio could well be an outcome of the rebuilding of the capital stock in many countries following World War II. In the years since the mid-1980s, slowing growth in TFP has put downward pressure on MPK, while slowing growth in the capital-to-labor ratio and a rise in the capital share of income have put countervailing upward pressures on MPK.22 Thus, over this period, MPK has been, more or less, steady as a result of the underlying forces counterbalancing one another.
Risk premiums
Let us revisit the median long-run real interest rate from figure 2 and the median long-run MPK from figure 3, panel A. There is a downward trend in both variables from the 1960s through the mid-1970s, and both variables are relatively low today compared with most other times during our roughly 60-year sample period. However, the two variables do not move together from the mid-1970s through the mid-2000s. In that period, the median long-run real interest rate rose and then fell, while the median long-run MPK continued its downward trend and then was essentially flat. In our framework, these two facts can be reconciled via movements in the risk premium. We calculate the risk premium as a residual from equation 1. The long-run risk premium for the United States, along with the median and interquartile range (25th to 75th percentile) of the long-run risk premiums across our sample of countries, is presented in figure 8. The median and U.S. long-run risk premiums fell from the mid-1970s through the late 1980s, and since then, they have both risen about 3 to 4 percentage points.
Figure 8. Long-run risk premiums
Sources: Authors’ calculations based on data from the International Monetary Fund, International Financial Statistics; Penn World Table 8.0; and Haver Analytics.
Our measures of the expected return from capital investment and the risk premium are based on the macroeconomic estimate of MPK. So, our measure of the risk premium is quite different from the finance measure of the risk premium using stock returns. Duarte and Rosa (2015) and Damodaran (2016) present the finance measure of the risk premium. Similar to what we found with our measure, they found that the U.S. risk premium was declining from 1975 through 1985. However, their measure of the U.S. risk premium continued to decline until 1999 and then increased through the present day. Their equity risk premium for the United States increased about 10 percentage points over the past 16 years. Hence, two very differently constructed measures of risk premiums exhibit broadly similar patterns at least since the turn of the millennium (note that our measure of the long-run risk premium in figure 8 is an 11-year centered moving average; although the figure appears to end around 2006, the data actually extend through 2011).
What could account for the rise in the risk premium over the past decade and a half? We offer three possibilities. One possibility is that with increased global trade and competition, the riskiness of investing in capital projects has also increased: The probability of their success is lower; but conditional on success, their rewards are greater. A second possibility is that in the aftermath of the Great Recession and the global financial crisis, households’ precautionary motive for saving has been persistently (possibly even permanently) strengthened. This would drive down long-run real interest rates and—when steady MPKs and depreciation rates of capital are accounted for—imply higher risk premiums. A (related) third possibility is that the demand for safe assets by households and firms has persistently increased over the past quarter-century.23 An aging world economy would lead to higher risk premiums if older investors are less risk tolerant than young investors. Alternatively, the risk premiums would rise when investors with low risk tolerance increase their wealth share in the economy.24
Projections for TFP growth and population growth
For the United States, Fernald (2015) documents a slowdown in labor productivity growth beginning in 2004. The slowdown is a result of both slower TFP growth and less capital deepening (less growth in capital stock per worker). Fernald’s projection for annual labor productivity growth from now on is 1.85 percent, or about half of the average during the tech boom of the 1990s or during the postwar period 1948–73. The TFP growth component relevant for the long-run real interest rate (arising from using a multisector model) is projected to be about 1.25 percent, also lower than before. This is 0.2 percentage points lower than TFP growth during the Great Moderation25 and almost three-quarters of a percentage point lower than TFP growth during the tech boom. This lower TFP growth translates one for one into lower long-run real interest rates.26
The blue dashed line in figure 6 is the United Nations’ projection of working-age population growth for our 20 countries. The figure shows that the growth rate of the working-age population is projected to decline a full percentage point over the next 35 years, turning negative by 2046. All else being equal, a decline in the long-run population growth rate will also lead to a decline in the long-run real interest rate.
Implications for monetary and fiscal policy
A prolonged period of low long-run real interest rates has implications for monetary and fiscal policy. With respect to monetary policy, our evidence on long-run real interest rates suggests that at least for the foreseeable future, the likelihood for the United States and other countries to hit the ZLB has increased compared with before the Great Recession and global financial crisis. As we mentioned earlier, avoiding the ZLB is important because when the policy rate is pinned there, monetary authorities may find themselves struggling to provide more accommodation to their economies during episodes of too low inflation and/or too low economic activity.
Focusing on the U.S. context for a moment, we note that monetary policymakers here care about the long-run real interest rate because optimal monetary policy involves forecasting an entire time path for the real federal funds rate. (The federal funds rate is the Federal Open Market Committee’s primary policy tool.)27 Setting the optimal amount of policy accommodation requires estimates of the future path of the short-run natural real interest rate.28 Estimating the long-run real interest rate is one way to forecast the future path of the short-run natural real interest rate once the effects of short- and medium-run shocks dissipate. Hence, estimates of the long-run real interest rate serve as a reference point or (time-varying) anchor.
Policy rules (such as the Taylor rule) that are often used as policy benchmarks typically have an intercept term that is usually interpreted as the long-run real federal funds rate. So, consider, for instance, this Taylor rule:
where it is the federal funds rate, αt is the intercept term, β0 is the coefficient on the inflation “gap,” πt is the inflation rate in percent in period t, β1 is the coefficient on the unemployment “gap,” ut is the unemployment rate in period t, and u* is the natural rate of unemployment.29 To the extent the intercept term represents the long-run real interest rate, estimates of that rate are needed to compute the prescriptions of these types of rules for monetary policy. In addition, methods for computing the short-run natural real interest rate sometimes embed long-run assumptions (such as constant trend TFP growth). Estimates of long-run real interest rates can suggest when it is appropriate to change such long-run assumptions.
It is important to reiterate that long-run real interest rates are time varying. Estimates of trends in the long-run real rate can shed light on the amount of accommodation available during times of low employment and/or low inflation. These estimates can also cast light on the probability of hitting the ZLB in the long run. These findings can, in turn, help inform discussions about the long-run goals and framework of monetary policy.
With regard to fiscal policy, our evidence on long-run real interest rates has mixed implications. Low interest rates have sometimes been used to justify expansionary fiscal policy, since they lower the costs of servicing government debt used to finance public spending. However, arguments for expansionary fiscal policy are usually made when short-run interest rates are low because of temporary factors (such shifts in oil prices) or current business cycle conditions (which may change quickly). How long-run real interest rates might shape—or be shaped by—government spending decisions is complicated. For example, if low long-run real rates reflect lower expected TFP growth, including that from public investment, then expansionary fiscal policy might be less sustainable. But if low long-run real rates reflect a low level of public spending on infrastructure and education (a boost to which would raise future TFP), then the proposed projects would be more attractive and more sustainable. In sum, evaluating the fiscal implications of low long-run real interest rates requires a careful quantitative assessment of the costs and benefits over time of different types of government spending.
Conclusion
We compute long-run real interest rates for the 20 largest economies from the 1950s through the present. From the data, we are able to discern trends in long-run real interest rates over three subperiods: These rates generally decline from the early 1960s through the mid-1970s; then increase until the late 1980s; and decline again from that point on. Currently, long-run real interest rates are near their lows for the roughly 60-year period we examine. In addition, over the past quarter-century, we note there has been a good deal of convergence in long-run real interest rates across the globe. Three takeaways from analyzing these data are worth highlighting. First, long before “secular stagnation” became a popular concept—and even long before the fizzling out of the IT boom—real interest rates were declining. Second, the convergence of real interest rates across countries since 1990 likely reflects global financial integration. Lastly, the data show there was a sustained increasing trend in long-run real interest rates between the mid-1970s and the late 1980s, which suggests that the current long-run pattern could be reversed at some point in the future.
Long-run trends in real interest rates and global fixed investment (which we covered in Yi and Zhang, 2016) suggest that forces leading to a weakening in global fixed investment demand are important. Our examination of the determinants of investment demand shows that trends in both long-run MPK and TFP growth track trends in the long-run real interest rate from the 1960s through the mid-1970s, but not again until in recent years. (The United States is an exception to this broad finding in that its long-run real interest rate, MPK, and TFP growth have broadly tracked one another for most of our period of study.)
The relative importance of the forces underlying the long-run MPK trends—namely, changes in the capital share of income, total factor productivity, and the capital-to-labor ratio—varies over time. Before the mid-1980s, while both TFP and the capital-to-labor ratio were growing, growth in the capital-to-labor ratio dominated growth in TFP—which led MPK to decline over time. Since the mid-1980s, growth in both the capital-to-labor ratio and TFP has been low; meanwhile, the capital share of income has risen. The overall impact on MPK from these trends in the underlying factors has been minimal (their effects on MPK have counterbalanced one another); indeed, MPK has been fairly flat over this period.
Movements in long-run risk premiums help account for movements in long-run real interest rates for most of the period after the mid-1970s. In particular, as real interest rates rose during the late 1970s and through the 1980s, risk premiums declined. The opposite pattern has been observed over the past quarter-century or so. There are natural reasons to have expected higher risk premiums in recent decades, including increasing business risk in a global economy and reduced risk tolerance by aging investors.
Going forward, U.S. TFP growth and global working-age population growth are projected to be lower than before. These developments, coupled with existing low long-run MPKs and relatively high long-run capital depreciation rates, suggest that long-run real interest rates may be low for some time. The evolution of these rates over the coming years may have ramifications for those making monetary policy decisions (for instance, when charting the future path of policy rates) and for those setting fiscal policy agendas.
NOTES
1 In this article, by the term long-run real interest rate, we mean the long-run average of the real interest rate on a short-term (risk-free) asset. (This is distinct from the real long-term interest rate, which is the real return on long-term bonds.)
2 See Yi and Zhang (2016) for more details on these trends.
3 Total factor productivity refers to the technologies and operational systems that businesses use to combine various inputs into outputs. In other words, TFP captures the residual growth in total output of the national economy that cannot be explained by the accumulation of measured inputs, such as labor and capital.
4 See Taylor (1993).
5 The “zero lower bound” problem arises from the confluence of weak economic conditions (low inflation, low economic activity) when interest rates are already close to zero and the fact that currency earns, by definition, zero interest. Thus, monetary policy interest rates and other interest rates cannot go below zero because if they did, households and businesses would switch their assets to currency. (In fact, because it is costly to hold currency, monetary policy interest rates can and have gone somewhat negative in countries such as Sweden, Japan, and Switzerland, as well as the 19 eurozone nations, which are served by the European Central Bank; but the existence of currency puts a limit on how low these interest rates can go.)
6 Some of the nations do not have long-run real interest rate data available all the way back to 1955. See the appendix for details.
7 Russia and Saudi Arabia are excluded from our list because of the lack of a suitably long time series, leaving us with 20 of the 22 largest economies in the world.
8 We assume that 11 years is long enough for the effects of short- and medium-term shocks to dissipate. To the extent the shocks are long-term or permanent, averages of past data may not be the best metric for future long-run real interest rates. The decline and rise in the U.S. measure during the 1970s and 1980s could be connected to the emergence and eventual abatement of high inflation in the United States.
9 Sticky prices and wages are nominal prices and wages resistant to change despite changes in the broader economy (for example, changes in the demand patterns for a product or skill set that result from an economic shock) that suggest different prices and wages would be optimal.
10 Hamilton et al. (2015) and Executive Office of the President of the United States, Council of Economic Advisers (2015) also document these trends.
11 The number of countries is not constant in each year because of gaps in the data for some nations. This applies to all subsequent figures with medians and interquartile ranges.
12 https://www.minneapolisfed.org/~/media/files/pubs/eppapers/16-10/kei-mu-yi-epp.pdf.
13 See, for example, Summers (2016).
14 See, for example, Bernanke (2005).
15 A well-known arbitrage relationship links two countries’ real interest rates to expected changes in their real exchange rate—the price of one country’s basket of goods relative to the price of the other country’s (possibly different) basket of goods. However, it is also well known that this relationship does not hold in the data (at least in the short run).
16 For details on this data source, see http://www.rug.nl/ggdc/productivity/pwt/pwt-releases/pwt8.0.
17 We thank Alex Monge-Naranjo and Juan Sánchez for kindly providing us their data on the natural resource rent share of GDP, which enabled us to compute the capital income share of reproducible capital. (Natural resource rents are revenues earned above the costs of extracting the natural resources, such as fossil fuels and minerals.)
18 Further details on the construction of MPK are in the appendix.
19 This finding for long-run MPK and the long-run real interest rate for the United States is consistent with the results in Gomme, Ravikumar, and Rupert (2011).
20 The interquartile range of long-run TFP growth rates was too wide and volatile, so we opted not to show it in figure 5.
21 For most countries, the working-age population is defined as persons aged 15 years and older (this might differ slightly from country to country).
22 We do not show data on the capital income share, but recent research has concluded that it has increased across a wide set of countries. See, for example, Karabarbounis and Neiman (2014).
23 See Caballero and Farhi (2017) for a model of the “safety trap” and this paper’s references that document the increased demand for safe assets.
24 See Hall (2016).
25 The Great Moderation was a long period (from the mid-1980s until 2007) of historically low macroeconomic volatility in the United States and other advanced economies. For more details, see Hakkio (2013).
26 This assumes an intertemporal elasticity of substitution (that is, the responsiveness of the growth rate of consumption to a change in the real interest rate) of 1. A lower intertemporal elasticity would imply larger movements in long-run real interest rates.
27 The federal funds rate is the primary tool the U.S. Federal Open Market Committee uses to implement monetary policy. Certain financial institutions hold reserve balances at the Federal Reserve (depository institutions, Federal Home Loan Banks, Fannie Mae and Freddie Mac, etc.). The federal funds rate is the rate of interest these institutions charge when they lend reserves to other institutions overnight.
28 There are several definitions of the natural real interest rate. Most of them involve some notion of what the real interest rate would be in the absence of certain “frictions” in the economy, such as sticky prices or sticky wages (see note 9).
29 The inflation gap is the difference between actual inflation and the monetary authority’s inflation target (for the Federal Reserve System, this is 2 percent, as measured by the annual change in the Price Index for Personal Consumption Expenditures). The unemployment gap is the difference between the actual unemployment rate and natural rate of unemployment (which is the unemployment rate that would prevail in an economy making full use of its productive resources).
APPENDIX
Here we explain how we constructed our measures of the real interest rate and the marginal product of capital. We provide the sources of data for the real rate and MPK, as well as other key underlying variables. We also give the years of data available for these variables for each of the 20 largest economies studied in this article. In addition, we explain two balanced growth equilibrium frameworks that help us assess the underlying forces influencing the paths of long-run real interest rates.
Construction of real interest rates
To construct our measure of the real interest rate, we follow the procedure of Hamilton et al. (2015). We use annual interest rate data. Our nominal interest rate variable is typically the central bank policy rate at the end of the year. However, for Brazil, France, Indonesia, and Mexico, it is an annual average short-term market rate. And for China, it is an end-of-year deposit rate. The interest rate data come from Haver Analytics or the International Monetary Fund’s International Financial Statistics (IFS). We compute the inflation rate as the December-over-December consumer price inflation rate (for Australia, we computed it as the fourth-quarter-over-fourth-quarter consumer price inflation rate). The price level data come from Haver Analytics or the IFS. For inflation expectations, since the publication of Atkeson and Ohanian (2001), it has been known that it is difficult to outperform a random walk inflation model in out-of-sample forecasts. For this reason, we set expected inflation next year as the inflation rate this year. The real interest rate equals the difference between the nominal interest rate and the inflation rate expected for the next year.
Construction of marginal products of capital
To construct our measure of the marginal product of capital, we follow the procedure of Caselli and Feyrer (2007), and mainly use data from the Penn World Table, version 8.0 (Feenstra, Inklaar, and Timmer, 2015). Caselli and Feyrer show that with any constant returns to scale production function, MPK can be represented as αY /K, where α is the capital share of income, Y is GDP, and K is the capital stock. We use the Penn World Table 8.0 national accounts data for Y and K. Note that K is a measure of reproducible capital only. We construct α to equal 1 minus the labor income share minus the natural resource rent share of GDP. Our measure of α differs across countries and is time varying for two reasons: The labor share varies over time, and the natural resource rent share of GDP varies over time, too. We obtain the labor shares from the Penn World Table 8.0 and the natural resource rent shares of GDP from Alex Monge-Naranjo and Juan Sánchez, who drew them from their research, Monge-Naranjo, Sánchez, and Santaeulàlia-Llopis (2016).
Sources of capital stock, capital depreciation rate, total factor productivity, and working-age population data
The capital stock, capital depreciation rate, and TFP data are from the Penn World Table, version 8.0 (http://www.rug.nl/ggdc/productivity/pwt/pwt-releases/pwt8.0). We use the variables that are measured at constant national accounts prices. The working-age population data are from the United Nations.
Country list
We study the 20 largest economies as measured by GDP in 2014 dollars, excluding Russia and Saudi Arabia given their limited data. We examine the economies of Australia, Brazil, Canada, China, France, Germany, India, Indonesia, Italy, Japan, Mexico, the Netherlands, Nigeria, South Korea, Spain, Sweden, Switzerland, Turkey, the United Kingdom, and the United States. Table A1 lists the variables and years of data available for each country.
Table A1. Data available for 20 countries in sample
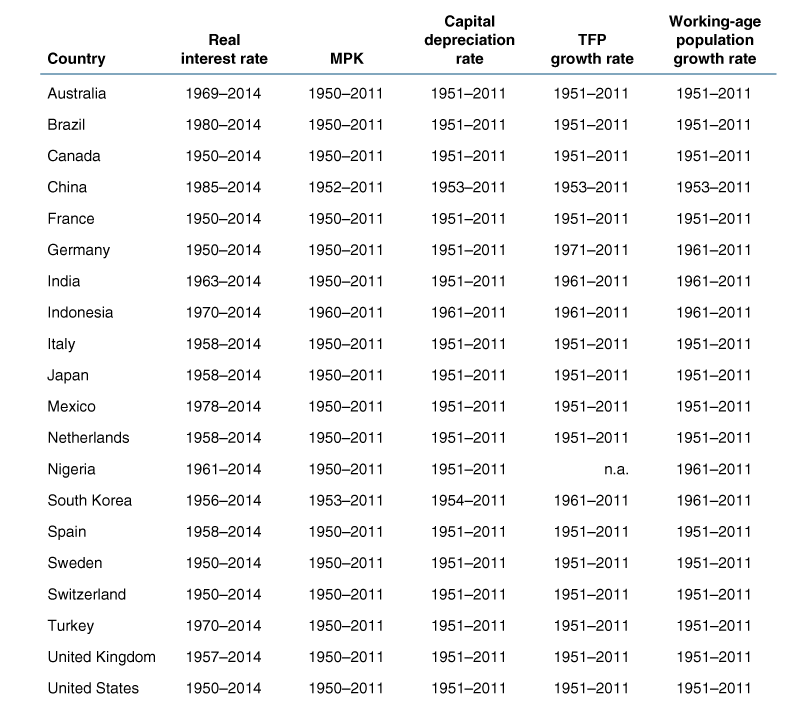
Sources: International Monetary Fund, International Financial Statistics; Haver Analytics; Penn World Table 8.0; Monge-Naranjo, Sánchez, and Santaeulàlia-Llopis (2016); and United Nations.
Long-run real interest rate along the "balanced growth path"
In assessing the forces that affect the long-run real interest rate (r ), we find that sometimes it is helpful to examine the steady-state, or balanced, growth implications of this rate. We present two balanced-growth- equilibrium frameworks.
1) In a neoclassical growth deterministic steady state,i long-run r is given by the following:
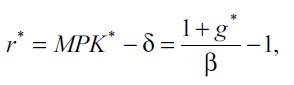
where MPK* is long-run marginal product of capital, δ is the depreciation rate of capital, g * is the long-run growth rate of TFP (in decimal form), and β is the rate of time preference (usually less than 1). Clearly, as the long-run growth rate of TFP declines, long-run r will decline.
2) In a deterministic overlapping generations (OLG) setting,ii long-run r is given by the following: r * = γ (1 + g *) (1 + n *) – δ. Note that γ is a constant that includes the capital income share and the preference discount factor; g * and n * are the long-run growth rate of TFP and the long-run growth rate of employment (in decimal form), respectively; and δ is the depreciation rate of capital. In this setting, as the long-run growth rate of employment declines, long-run r will decline. In addition, if the depreciation rate of capital increases, long-run r will decline.
APPENDIX NOTES
i We employ a framework with standard logarithmic preferences and a Cobb–Douglas production function.
ii We employ a framework with logarithmic preferences and Cobb–Douglas production.
REFERENCES
Atkeson, Andrew, and Lee E. Ohanian, 2001, “Are Phillips curves useful for forecasting inflation?,” Quarterly Review, Federal Reserve Bank of Minneapolis, Vol. 25, No. 1, Winter, pp. 2–11.
Bernanke, Ben S., 2005, “The global saving glut and the U.S. current account deficit,” Federal Reserve Governor speech at the Sandridge Lecture, Virginia Association of Economists, Richmond, VA, March 10, https://www.federalreserve.gov/boarddocs/speeches/2005/200503102/.
Caballero, Ricardo J., and Emmanuel Farhi, 2017, “The safety trap,” National Bureau of Economic Research, working paper, No. 19927, revised January 2017 (originally issued February 2014), http://www.nber.org/papers/w19927.
Caselli, Francesco, and James Feyrer, 2007, “The marginal product of capital,” Quarterly Journal of Economics, Vol. 122, No. 2, May, pp. 535–568.
Damodaran, Aswath, 2016, “Equity risk premiums (ERP): Determinants, estimation and implications—The 2016 edition,” New York University, Stern School of Business, paper, March, https://papers.ssrn.com/sol3/papers.cfm?abstract_id=2742186.
Duarte, Fernando, and Carlo Rosa, 2015, “The equity risk premium: A review of models,” Federal Reserve Bank of New York, staff report, No. 714, February, https://www.newyorkfed.org/medialibrary/media/research/staff_reports/sr714.pdf.
Executive Office of the President of the United States, Council of Economic Advisers, 2015, “Long-term interest rates: A survey,” report, Washington, DC, July, https://obamawhitehouse.archives.gov/sites/default/files/docs/interest_rate_report_final_v2.pdf.
Feenstra, Robert C., Robert Inklaar, and Marcel P. Timmer, 2015, “The next generation of the Penn World Table,” American Economic Review, Vol. 105, No. 10, October, pp. 3150–3182.
Fernald, John G., 2015, “Productivity and potential output before, during, and after the Great Recession,” in NBER Macroeconomics Annual 2014, Jonathan A. Parker and Michael Woodford (eds.), Chicago: University of Chicago Press, pp. 1–51.
Gomme, Paul, B. Ravikumar, and Peter Rupert, 2011, “The return to capital and the business cycle,” Review of Economic Dynamics, Vol. 14, No. 2, April, pp. 262–278.
Hakkio, Craig S., 2013, “The Great Moderation,” Federal Reserve History, November 22, http://www.federalreservehistory.org/Events/DetailView/65.
Hall, Robert E., 2016, “The role of the growth of risk-averse wealth in the decline of the safe real interest rate,” Stanford University and National Bureau of Economic Research, working paper, November 16, http://web.stanford.edu/~rehall/DSFIR11032016.
Hamilton, James D., Ethan S. Harris, Jan Hatzius, and Kenneth D. West, 2015, “The equilibrium real funds rate: Past, present and future,” National Bureau of Economic Research, working paper, No. 21476, August, http://www.nber.org/papers/w21476.
Karabarbounis, Loukas, and Brent Neiman, 2014, “The global decline of the labor share,” Quarterly Journal of Economics, Vol. 129, No. 1, February, pp. 61–103.
Monge-Naranjo, Alexander, Juan M. Sánchez, and Raül Santaeulàlia-Llopis, 2016, “Natural resources and global misallocation,” Federal Reserve Bank of St. Louis, working paper, No. 2015-036B, revised July 13, 2016 (originally posted October 2015), https://research.stlouisfed.org/wp/2015/2015-036.pdf.
Summers, Lawrence H., 2016, “The age of secular stagnation: What it is and what to do about it,” Foreign Affairs, Vol. 95, No. 2, March/April, pp. 2–9, available by subscription at https://www.foreignaffairs.com/articles/united-states/2016-02-15/age-secular-stagnation.
Taylor, John B., 1993, “Discretion versus policy rules in practice,” Carnegie-Rochester Conference Series on Public Policy, Vol. 39, No. 1, December, pp. 195–214.
Yi, Kei-Mu, and Jing Zhang, 2016, “Real interest rates over the long run,” Economic Policy Papers, Federal Reserve Bank of Minneapolis, No. 16-10, September, https://www.minneapolisfed.org/research/economic-policy-papers/real-interest-rates-over-the-long-run.


