Conducting Monetary Policy in an Evolving Economy
Introduction
I have been president of the Chicago Fed for nine years, after having transitioned from research director in September 2007. Talk about impeccable timing! Almost immediately, the U.S. experienced a financial crisis that led to the Great Recession, with unemployment peaking at a horrendous 10 percent. And since mid-2009, the U.S. has been in a slow recovery and a prolonged period of inflation running below our 2 percent policy objective (as measured by the annual change in the Price Index for Personal Consumption Expenditures, or PCE). 1
The Federal Reserve’s response to these enormousA challenges included a reduction in our short-term policy interest rate, the federal funds rate, all the way to its zero lower bound (ZLB) in December 2008. And to provide additional monetary accommodation, the Federal Open Market Committee (FOMC) subsequently introduced unconventional policies – such as large-scale asset purchases and forward guidance about the future path for the fed funds rate. 2
We’ve made great progress. Today, the unemployment rate is down to 5.0 percent, and U.S. economic fundamentals appear good. As summarized in the Federal Reserve’s quarterly Summary of Economic Projections, or SEPs, we expect 2 percent or so growth in real gross domestic product (GDP) over the next few years, with further declines in unemployment. 3
However, the story on inflation is not satisfactory. Core PCE inflation, which strips out the volatile food and energy components, appeared to have stalled at 1.6 percent before edging up to 1.7 percent in August. The SEP forecasts have it taking another two years to return to our 2 percent target. Moreover, I should note that the SEPs have been predicting inflation would take at least two years to return to target for the last four years.
What does this imply for monetary policy?
As you may know, the FOMC took a first step toward policy normalization last December, increasing the target range for the federal funds rate by 25 basis points to a range of 1/4 to 1/2 percent. However, for a variety of reasons, the FOMC has refrained from further increases since then. This may well be changing soon. The most recent FOMC policy statement indicated that “the Committee judges that the case for an increase in the federal funds rate has strengthened but decided, for the time being, to wait for further evidence of continued progress toward its objectives."
4 Indeed, at our September meeting, three FOMC members dissented in favor of immediately increasing rates. Moreover, it is public knowledge that going into our July meeting, eight of 12 Reserve Banks had requested an increase in the discount rate, likely signaling a preference for policy tightening.
5
Within this context, today I will discuss the objectives of the Federal Reserve and my thinking about the policy path ahead. There are three key issues that we need to consider: First, the trend, or potential, rate of economic growth in the U.S. is now recognized to be markedly lower than we assessed prior to 2007. Second, there continues to be substantial uncertainty on how close we are to “full employment.” And, third, we need to recognize that the predominant inflation risk facing monetary policymakers has shifted from inflation being too high to inflation being too low. The Great Inflation that so occupied policymakers in the 1970s and 1980s was first broken by the Volcker Fed and then finished off under Greenspan.
We then got a glimpse of a new regime in May 2003, when the FOMC’s post-meeting policy statement first explicitly mentioned the risk that inflation might be too low.
6 And this risk has been intense since the Great Recession, with inflation running persistently below our 2 percent target for the past eight years.
With all of this in store for today’s discussion, I need to mention now that these are my own views and do not necessarily reflect the views of my colleagues on the FOMC or those in the Federal Reserve System.
Monetary Policy Goals and Strategies
This slide summarizes the long-run goals and strategy for U.S. monetary policy, which the FOMC first explicitly laid out in January 2012. The U.S. Congress has given the Fed a dual mandate — to set monetary conditions with the aim of achieving price stability and maximum sustainable employment. The FOMC’s price stability target is an inflation rate of 2 percent as measured by the Price Index for Personal Consumption Expenditures, as I mentioned before. The strategy statement explicitly says this target is symmetric, with the Committee being concerned if inflation persistently runs either above or below 2 percent.
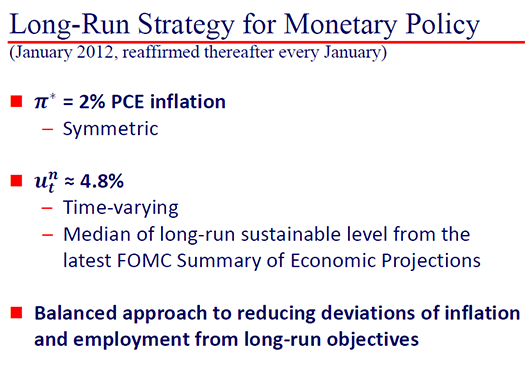
Because maximum employment is largely determined by nonmonetary factors that can change over time, the FOMC does not have a fixed numerical target for our employment mandate. However, one guide is the unemployment rate that FOMC participants see the economy settling out at in the long run. The range of these forecasts currently is 4-1/2 to 5.0 percent, with the median at 4.8 percent.
7
Finally, the goals and strategy statement says that the FOMC will take a balanced approach to achieving our dual objectives.
Now let’s focus on slide 2. One simple way to depict our policy strategy is with the standard quadratic loss function I’ve written down on this slide. It says that deviations from our two goals are equally costly, with the costs rising with the square of the deviation above or below each goal. The two panels show the history and current status of progress towards our policy goals. The cross hairs in the bull’s-eyes are drawn at the sweet spots for policy — our 2 percent inflation target and the FOMC’s current median estimate of the long-run unemployment rate, 4.8 percent
.
8
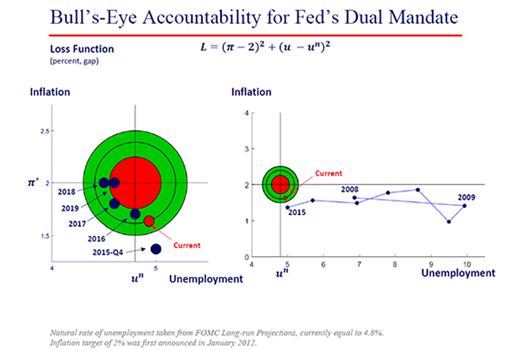
During the recession and early recovery, when resource slack was enormous and inflation was obviously too low, the direction of policy was clear: The U.S. economy needed highly accommodative policies to ease financial strains, facilitate balance sheet restructuring by households and businesses and stimulate growth and inflation. The right-hand panel depicts what I’ve already noted — we have made great progress toward our full employment mandate, but are still short of our inflation objective.
In spite of weak global conditions, the U.S. economy has come a long way back. So isn’t the policy direction clear and obvious today? By old benchmarks, such as the original Taylor rule, we should be increasing rates now. However, for me, the current economic environment looks very different than it did during my first 16 years at the Chicago Fed, before becoming president (1991–2007). That’s because the validity of these old benchmarks depends on how we assess the three issues that I mentioned at the start of my talk: trend growth; uncertainty about what constitutes full employment; and the tilt of inflation risks. These assessments have important implications for how much the Fed needs to adjust its previous tactics in order to address new circumstances. Let’s turn to these issues now.
Three Issues Facing Monetary Policymakers
Issue number 1: Going forward, trend (or potential) output growth is expected to be only about 1.8 percent — that’s the median projection from the FOMC’s September SEP
9 and it is our Chicago Fed assessment as well. This is quite a change from the past — for example, between 1980 and 2007, U.S. real GDP growth averaged about 3.0 percent.
Many economists have been speaking at length on this subject for some time, so I will just list the main reasons for this slowdown: 1) Growth in available labor input is slowing, largely because of the retirement of the baby boomers and lower youth and prime-age labor force participation (LFP) rates; 2) Total factor productivity (TFP).
10
growth appears to have reverted to rates that prevailed during the slow growth years between 1975 and 1995; and 3) capital deepening has been weak.
11
The last two factors determine growth in labor productivity. And it is a matter of arithmetic that trend growth in labor hours and labor productivity translate into trend GDP growth. Thus, 1.8 percent is my current assessment for the sum of these two factors.
One of the first reactions I often get to this statement is something like: “Well, shouldn’t we all prefer something higher, like 4 percent trend growth?” Yes, I agree. But how does the economy achieve trend growth in labor hours plus trend growth in labor productivity that add up to 4 percent? That is the crucial public policy challenge, but it is beyond the capacity of monetary policy.
Increasing trend growth is crucial. Just pushing growth up to 4 percent without affecting potential won’t do. Growth well above potential year after year would generate unsustainable imbalances that typically lead to large undesirable increases in inflation.
The pace of trend growth has another important implication. As standard economic theory tells us, one consequence of slower trend growth is lower equilibrium real interest rates (r
*).
12
And, with lower equilibrium real rates, any given level of a central bank’s policy interest rate is less accommodative than it otherwise would be. So, clearly, we need to rethink our old policy benchmarks with this new calibration in mind. Furthermore, a lower equilibrium real interest rate reduces the buffer monetary policy has to fight downside shocks before it is confronted with the zero lower bound. And experiences from around the world have left us with all too great an appreciation for the difficulties that the ZLB presents to policymakers.
Now for issue number 2: Is the U.S. economy now at full employment? We don’t really know with certainty, but my guess is no. This isn’t really a new issue — it’s always been a challenge to assess the maximum sustainable level of employment consistent with price stability. The FOMC’s statement on longer-run goals and monetary policy strategy acknowledges this explicitly.
13
Our view at the Chicago Fed is that the natural rate of unemployment
14 currently is 4.7 percent and that for some time it will fall about 5 basis points a year, reaching 4-1/2 percent by 2020. This assessment reflects the increasing age and educational levels of the labor force. My staff also thinks the labor force participation rate currently is below where it should be based on long-run trends, which means there is additional slack beyond what’s picked up by the unemployment rate alone. I put substantial weight on my staff’s labor market views, and indeed, they have a good track record: Aaronson and Sullivan identified downward trends for U.S. LFP back in the early 2000s before most economists even contemplated them.
15 So at the Chicago Fed, we see more slack than most of my FOMC colleagues — as I mentioned earlier, the FOMC’s latest forecasts of the long-run neutral unemployment rate range from 4-1/2 to 5 percent, with a median of 4.8 percent.
By the way, I don’t see the differences in the estimates as a problem — a strength of our Federal Reserve System is the diverse expertise and perspectives that 12 regionally dispersed Reserve Bank presidents plus five Federal Reserve Board Governors bring to the FOMC discussion.
Now, the 50 basis point range of natural rate estimates may seem rather large at first glance. But 95 percent error bands generated by statistical models of the natural rate are typically at least 250 basis points wide.
16 Our uncertainty over measures of “full employment” is enormous. When unemployment in the U.S. was 10 percent or 8 percent or even 6 percent, this uncertainty wasn’t really critical to policy — we didn’t know exactly how far we were from the natural rate, but we were quite certain we were a fair ways above it. But with the unemployment rate at 5.0 percent and inflation closer to but still below our 2 percent objective, this uncertainty becomes a very important issue.
My FOMC colleagues and I have been quite vocal in saying we need to consider a wide variety of risks when choosing appropriate monetary policy. Weighting these risks by the size of their social costs should be a big part of this calculation. Full employment is an enormously important, valuable economic outcome. And repairing damage incurred from the Great Recession continues to be critical for improving labor force quality for stronger, long-lasting growth. In this context, overestimating the natural rate; incorrectly inferring that U.S. is at full employment; and prematurely tightening policy would carry particularly high social costs.
Of course, we can’t just don rose-colored glasses either. We have to be cognizant of the risks of underestimating the natural rate of unemployment as well. I will return to more fully discuss how these various risks affect our policy calculus shortly.
This brings me to issue number 3: The change in the predominant inflation risk from inflation being too high to it being too low. During most of my Fed career, going back to the early 1990s, the problem with inflation was pretty clear: It was too high — above any sensible inflation objective, and monetary policy needed to engineer a lower secular level of inflation. I’m pretty confident that Fed policymakers from the Paul Volcker era through 2002 would agree with this characterization — trend inflation needed to be lower.
But the world has changed. The May 2003 FOMC meeting was an important one — as I mentioned earlier, that’s when the FOMC’s policy statement first explicitly mentioned the risk that inflation might be too low. Today, I will simply point out that the bull’s-eye chart shows clearly that inflation has been too low for almost all of the past nine years.
Of course, some are still focused on the risk that Fed policy will overstimulate the economy, pushing inflation above our 2 percent target in a way that would require a sharply restraining policy response. But I would say that such fears currently are exaggerated and are a bit like the problem of generals fighting the last war. Today, looking at experiences from around the world, I think the bigger risk is that inflation in the U.S. will not get back to our symmetric 2 percent objective within an acceptable period of time.
Much of my perspective derives from how I view the symmetry of our inflation target. I would say that the FOMC has been challenged to describe what is meant by symmetry for our 2 percent inflation objective. I typically point out that a successful symmetric approach would have inflation average 2 percent over long stretches of time. In order to average 2 percent, some time will be spent above 2 percent and some time will be spent below 2 percent.
So, in the current situation, after many years of very low inflation, one has to ask, Would overshooting 2 percent be a failure or a virtue?
Current SEP forecasts from FOMC participants have inflation rising to 2 percent without overshooting our target level. I call this threading the needle to get to 2 percent. This might be consistent with a symmetric approach to inflation. But that can’t really be known with much certainty until sometime in the future when inflation is shocked above 2 percent. At that juncture, we would be able to see whether or not the FOMC responds by similarly trying to thread the needle with a shallow decline in inflation back down to 2 percent.
Given what I see today, I am skeptical that the public believes a future FOMC would act in such a manner. Indeed, when I say in speeches or panel discussions that the FOMC has a symmetric inflation target, I am often greeted with skepticism. To ensure more public confidence that the Fed’s inflation objective is indeed symmetric, we need to provide a substantial and credible example of symmetric behavior with regard to our inflation target. And we need to do it sooner rather than later.
Determinants of Inflation
In today’s persistent low inflation environment with great uncertainties, credible inflation targets are fundamental for central banks to hit their inflation objectives. Monetary policymakers around the world are grappling with this issue.
To discuss this more fully, I find it helpful to describe the intuition underpinning my inflation projections. My exposition is slightly simplified from the analysis that Chair Yellen described in a speech last year.
17 Our canonical inflation model is depicted on this slide:
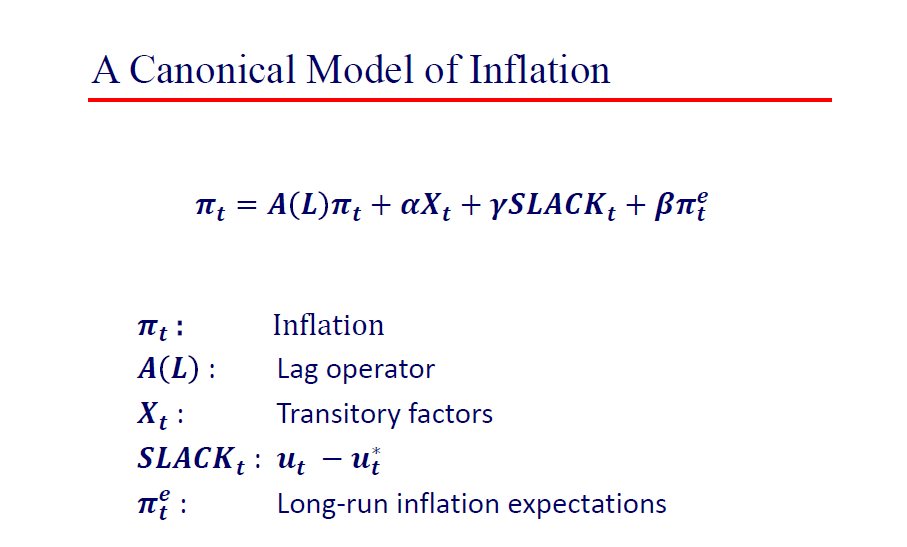
In this model, four things determine current inflation. The lagged terms in inflation represent inertia in the inflation process due to “sticky” price setting and other such factors. X refers to transitory factors, such as changes in food and energy prices and the exchange value of the dollar, whose movements only have temporary influences on inflation. The slack term represents the Phillips curve, in which underutilization of resources pulls down inflation while overutilization generates inflationary pressure. Long-run inflation expectations — the last term — anchor inflation when the effects of adjustment lags, transitory factors and resource utilization are all neutral. 18 . Of course, a credible inflation target, in turn, anchors inflation expectations.
As I assess current conditions, my confidence that inflation will rise to 2 percent before too much more time depends critically on a) whether the U.S. economy is at full employment now or will be relatively soon and b) whether inflation expectations are consistent with achieving a symmetric inflation objective of 2 percent.
If I had strong confidence that full employment was consistent with a 5 percent unemployment rate and that there was a strong upward pull from inflation expectations anchored at 2 percent, then I would have more confidence that core PCE inflation was headed to 2 percent sooner rather than later. Unfortunately, I have doubts about both of these conditions. First, as I noted, my staff’s research points to a natural rate of unemployment moving closer to 4-1/2 than 5 percent. Moreover, there is a large body of evidence that the slope of the Phillips curve is very flat, so even if the natural rate is 5 percent, it is hard to expect much upward influence on inflation from modestly undershooting the natural rate — such as we see in the median SEP forecast.
This leaves inflation expectations to carry the remaining burden. Here, again, I have worries, because looking at evidence from surveys of households and professional forecasters, as well as various measures coming out of financial markets, I believe expected inflation is not 2 percent, but something more like 1-3/4 percent. If these low inflation expectations persist, even when the transitory factors and economic slack settle back to zero, inflation will still not be back to target.
So when I account for all of the elements of the standard inflation model, I just don’t see a reason to be very confident that we’re headed back to 2 percent within a reasonable time frame. Instead, my projection, which differs from many of my Fed colleagues, is that it will take until roughly 2020 to get inflation to target and even that rather slow pace of progress will require a very shallow path for the federal funds rate.
Should Policy Allow Overshooting?
With this forecast taxonomy as background, let’s explore how best to deal with the new era of inflation risks. Making good policy always requires weighing the benefits and costs of various actions. Today, I think the big question is whether we should maintain enough monetary policy accommodation to impart a significant probability of overshooting 2 percent inflation.
Let’s start by thinking about the benefits of such an action. First, getting inflation to our target sooner and with a likelihood of overshooting would avoid the substantial costs of allowing inflation to linger below our objective for too long. Just consider the difficulties the Japanese economy has faced during their decades of low inflation and the Bank of Japan’s ZLB challenges. These costs are substantial.
Second, I see benefits to trying to engineer policy to allow for the strong possibility of inflation overshooting its target. Because expected inflation currently is too low, overshooting 2 percent would reinforce our symmetric objective and move expectations up toward 2 percent. This in turn would increase the upward pull on actual inflation.
In a world with lower real r
*
and without increasing our inflation objective, as several have advocated,
19
firming up inflationary expectations to 2 percent from 1-3/4 would slightly reduce the risk that future adverse developments would take us back to the ZLB. Every little bit helps. Also, the risk will be lower that we will need to again employ unconventional policies, including newer tools in use by foreign central banks, such as negative short-term interest rates. Many in the public tell me that they would prefer to avoid negative interest rates.
Now, if the Phillips curve is flat and inflation expectations currently anchor inflation below 2 percent, how does a central bank engineer inflation overshooting its target? It can do so by expressing a firm commitment to increasing inflation in order to boost inflation expectations.
In the current situation, it would help to state clearly that monetary policy that leads to a high probability of inflation exceeding 2 percent would be consistent with our symmetric objective. I also think it would help to indicate that policymakers would be willing to accept the increased inflationary risk that might accompany further declines in unemployment. This inflation risk arises because we don’t really know what the level of full employment is. Pushing harder to get inflation at least to 2 percent should provide some better information about where this benchmark lies.
Now let’s turn to the other side of the ledger: What are the costs of overshooting our 2 percent inflation objective?
One risk often mentioned is that pushing too hard to lower unemployment might lead to unsustainable outcomes and eventually bring the economic expansion to a premature end. After all, when inflation risks are too great and inflation is above its objective, a central bank brings inflation back down by tightening financial conditions, which usually raises unemployment. Indeed, some think that if unemployment gets more than just a small amount below its sustainable level, then its return to its natural rate might trigger a counterproductive recession.
Interestingly, it is true that in the postwar U.S., there have not been increases in quarterly unemployment of more than three- or four-tenths without a recession. Nonetheless, to me it seems overly bold to extrapolate this experience forward. We have a limited number of examples, and the economic setting today is quite different than in the past.
To understand these differences, it’s useful to talk more about the history of Fed inflation-fighting. We know from the careful work of Christina and David Romer that there were many instances when the postwar Federal Reserve explicitly decided to tighten monetary policy in order to bring inflation down.
20Take, for example, the actions that began in April 1974. After OPEC’s increase in oil prices, the FOMC, fearing that high inflation was becoming embedded in the public mindset, tightened monetary policy dramatically. According to the simplified inflation model that I presented earlier, the resulting increase in resource slack and reduction in inflation expectations ought to bring inflation down. The 1974 FOMC stepped hard on the monetary brakes. And resource slack did rise — and, indeed, a sharp recession ensued. Now the downturn was made worse by nonmonetary challenges facing the U.S. economy, such as the adjustment of production technologies to higher energy prices and labor market rigidities.
21
And many have argued that these structural issues were not well appreciated by policymakers in the 1970s. Still, the monetary tightening itself did have a strong effect on the real economy.
Of course, there are several other episodes in which the FOMC tried to rein in rising inflation and inflation expectations. Indeed, during most of the period from the 1970s into the early 2000s, the direction of monetary policy was always pretty clear: Inflation was much too high, well above any sensible inflation objective, and monetary policy tried to engineer lower inflation whenever it was opportune. The 1987–2003 period that John Taylor identifies as exemplifying best-practice monetary policy is included in this longer time period. 22 Throughout Taylor’s sample, inflation was above the Fed’s unstated inflation objective. Lower inflation was always better, and this was generally achieved with higher interest rates.
As I mentioned earlier, higher rates had two tasks to perform — increase unemployment (boost the slack term in inflation model) and reign in high inflation expectations (Ε(π)). And in some cases, large tightenings were needed to reduce inflation, and large tightenings typically led to recessions, as in 1973–75 and 1980–82.
But the 1989–90 and 1999 monetary policy tightenings were different; soft landings were almost achieved during these episodes. Because they were aiming at relatively small reductions in inflation, the Fed increased interest rates less. Recessions did eventually ensue, but arguably, in both cases the economy would not have fallen into recession if not for late-breaking external events — namely, the invasion of 1990 Kuwait and the September 11, 2001 terrorist attack in New York. These two episodes suggest that recessions may not be inevitable if we are talking about modest inflation adjustments and if we are not simultaneously facing other major economic challenges.
The current situation is very different. Unlike the 1970s, ’80s and ’90s, when the U.S. was starting from a point where inflation and inflation expectations were too high, today we are starting from a position where they are too low. This means that a mild overshooting of 2 percent in actual inflation is unlikely to result in inflation expectations rising enough that they would move very far above target. Accordingly, if it became necessary, policy wouldn’t have to do much work to lower inflation expectations back down to 2 percent.
In the past, higher interest rates had to first offset upward momentum in inflationary expectations and, once that was done, continue to work to lower inflationary expectations down to our target. Today, since inflation expectations are approaching target from below, higher rates would most likely only be needed to offset upward momentum. We wouldn’t need the second restraining dose to bring expectations down. And if we did have to, the dosage most likely would be small.
This argument implies that it may be a mistake to extrapolate the postwar monetary experience — even that of the more benign 1987–2003 period — to today. It also suggests that more research should be done to investigate whether familiar interest rate rules, such as the Taylor rule, are robust to structural changes related to lower values for potential growth, equilibrium real interest rates and inflation expectations. The Lucas critique suggests that policy rules that previously appeared useful and robust in an earlier environment may not continue to be appropriate today.
23 More evidence is needed.
24
Given this context and given the large uncertainties around our estimates of full employment and the current low inflation risks, it seems reasonable to continue to take stock of how much more room the economy has to grow without generating a meaningful risk of inflation rising to levels that would threaten the credibility of our symmetric 2 percent inflation objective.
Inflation Benchmarks
Finally, I would note that much attention has been placed on exactly when the next increase in the federal funds rate might be. If core inflation was clearly on its way to 2 percent, then I would see the next readjustment of monetary policy toward its long-run neutral level as an appropriate and easy decision. However, as you can tell from my remarks today, I have yet to see clear and convincing evidence that inflation is headed up to 2 percent.
What would convince me that inflation is clearly on its way to 2 percent? Well, I would like to see evidence of positive movements in the terms in my inflation forecasting taxonomy. So, here’s what I’m looking for: First, actual core inflation moving closer to 2 percent in a sustained fashion. Second, further reductions in unemployment and other indicators of labor market slack. And third, sustained increases in the various measures of inflation compensation and surveys of inflation expectations.
Indeed, I would prefer that at the time we make our next move, FOMC communications would also indicate that subsequent increases will be dependent on seeing further positive developments in inflation indicators. I believe this would help assure the public that the Committee is seeking economic and financial conditions to support inflation attaining our 2 percent target sustainably, symmetrically and sooner rather than later.
Thank you.
Notes
1 This objective was first acknowledged in Federal Open Market Committee (2012). The 2 percent inflation target was reaffirmed in the most recent statement of our longer-run goals; see Federal Open Market Committee (2016c).
2 For more about the large-scale asset purchases (also referred to as the quantitative easing programs) and the rationale behind them, see Board of Governors of the Federal Reserve System (2015a). For details on the Federal Reserve’s use of forward guidance, see Board of Governors of the Federal Reserve System (2015b).
3 Federal Open Market Committee (2016a). The references to specific numbers in the SEPs refer to the median of the forecasts of the FOMC participants.
4 Federal Open Market Committee (2016b).
5 The discount rate is the rate banks pay to directly borrow from the Fed and recently has been set formulaically 50 basis points above the federal funds rate.
6 Federal Open Market Committee (2003).
7 Federal Open Market Committee (2016a).
8 The slide also shows the progress toward the dual mandate objectives over the next three years, as projected by the median forecast of the FOMC participants.
9 Federal Open Market Committee (2016a).
10 TFP refers to the technologies and operational systems that businesses use to combine various inputs into outputs. In other words, TFP captures the residual growth in total output of the national economy that cannot be explained by the accumulation of measured inputs, such as labor and capital.
11 That is, increases in capital per worker have been weak.
12 Equilibrium real interest rates are the rates consistent with the full employment of the economy’s productive resources. The equilibrium interest rate is sometimes called the “natural” or “neutral” interest rate.
13 Federal Open Market Committee (2016c).
14 The natural rate of unemployment is the unemployment rate that would prevail in an economy making full use of its productive resources.
15 See, for instance, Aaronson and Sullivan (2002).
16 See, for instance, Staiger, Stock and Watson (1997).
17 Yellen (2015).
18 Most sticky-price setting frameworks with “optimal” price resetting would suggest a shorter-term inflation expectation should enter the model. But empirical analyses generally find that longer-term inflation expectations provide better forecasts, most likely because of the importance of changes in trend inflation over the past 40 years.
19 See, for instance, Williams (2016) and Rosengren (2015).
20 Romer and Romer (2002).
21 Bernanke, Gertler and Watson (1997).
22 Taylor (2007) and Taylor (2015).
23 Lucas (1976).
24 Evans (2014).
References
Aaronson, Daniel, and Daniel G. Sullivan, 2002, “Growth in worker quality,” Chicago Fed Letter, Federal Reserve Bank of Chicago, No. 174, February.
Bernanke, Ben S., Mark Gertler and Mark Watson, 1997, “Systematic monetary policy and the effects of oil price shocks,” Brookings Papers on Economic Activity, Vol. 28, No. 1, pp. 97–142.
Board of Governors of the Federal Reserve System, 2015a, “What were the Federal Reserve's large-scale asset purchases?,” Current FAQs, December 22.
Board of Governors of the Federal Reserve System, 2015b, “What is forward guidance and how is it used in the Federal Reserve's monetary policy?,” Current FAQs, December 16.
Federal Open Market Committee, 2016a, Summary of Economic Projections, Washington, DC, September 21.
Federal Open Market Committee, 2016b, press release, Washington, DC, September 21.
Federal Open Market Committee, 2016c, “Statement on longer-run goals and monetary policy strategy,” Washington, DC, as amended effective January 26.
Federal Open Market Committee, 2012a, press release, Washington, DC, January 25.
Federal Open Market Committee, 2003, press release, Washington, DC, May 6.
Lucas, Robert E., Jr., 1976, “Econometric policy evaluation: A critique,” Carnegie-Rochester Conference Series on Public Policy, Vol. 1, No. 1, January, pp. 19–46.
Romer, Christina D., and David H. Romer, 2002, “The evolution of economic understanding and postwar stabilizing policy perspective,” in Rethinking Stabilization Policy, Federal Reserve Bank of Kansas City, pp. 11–78.
Rosengren, Eric S., 2015, “Changing economic relationships: Implications for monetary policy and simple monetary policy rules,” speech by Boston Fed president at Chatham House, London , April 16.
Staiger, Douglas, James H. Stock and Mark W. Watson, 1997, "The NAIRU, unemployment and monetary policy," Journal of Economic Perspectives, Vol. 11, No. 1, Winter, pp. 33–49.
Taylor, John B., 2015, “Getting back to a rules-based monetary strategy,” speech at the Shadow Open Market Committee conference, Getting Monetary Policy Back on Track, Princeton Club, New York, March 20.
Taylor, John B., 2007, “Housing and monetary policy,” panel remarks at the Federal Reserve Bank of Kansas City Economic Policy Symposium, Housing, Housing Finance and Monetary Policy, Jackson Hole, WY, September.
Williams, John C., 2016, “Monetary policy in a low r-star world,” FRBSF Economic Letter, Federal Reserve Bank of San Francisco, No. 2016-23, August 15.
Yellen, Janet, 2015, “Inflation dynamics and monetary policy,” speech by Federal Reserve Chair at the Philip Gamble Memorial Lecture, University of Massachusetts Amherst, Amherst, MA, September 24.