The following publication has been lightly reedited for spelling, grammar, and style to provide better searchability and an improved reading experience. No substantive changes impacting the data, analysis, or conclusions have been made. A PDF of the originally published version is available here.
Something happened on the way to an American robotics industry. In spite of much ballyhoo from time to time, both the production and adoption of robots in the U.S. have fallen short of expectations. Productivity gains by robot users have often suffered from unforeseen problems in getting the new machines on line. Consequently, domestic consumption has leveled off in recent years as large users, especially automakers, have curtailed their purchases of robots.
Meanwhile, this American-born industry has ceded its position of world eminence in production and has been surpassed by the Japanese, who have benefitted from government support both for robotics technology development and for the adoption of robots by Japanese industry. While heavy government support for robotics overseas has contributed to the troubles of the domestic robotics industry, it also appears that many U.S. producers contributed to their own undoing by developing products that were too sophisticated and expensive. Once the world leader in robotics technology, the United States now leads in only a few remaining areas with foreign competitors close behind.
Robotics in the Midwest
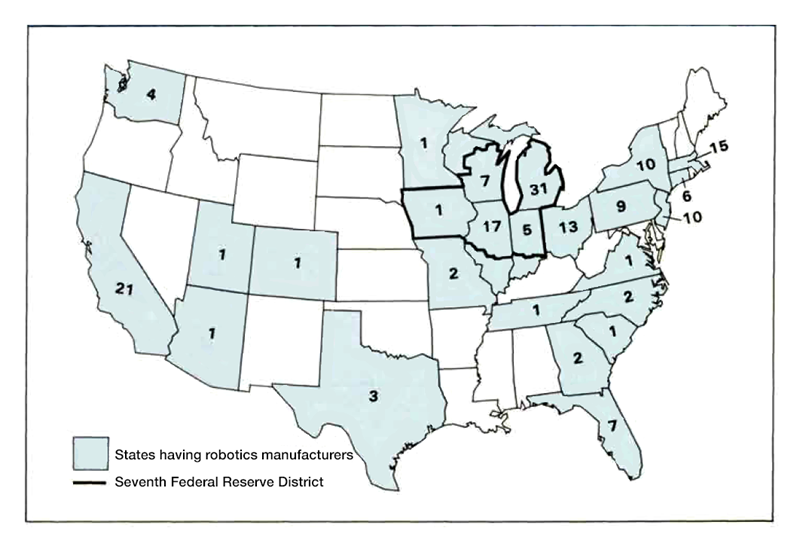
The U.S robotics manufacturers (as self-defined by trade association figures) are highly concentrated in the Midwest, including the Seventh District states: Illinois, Indiana, Iowa, Michigan, and Wisconsin and particularly in the state of Michigan (see map). Over one-third of reporting firms were located here in 1986 with one-half of those in the state of Michigan. Michigan’s strength in robotics derives from the state’s continued specialization in auto production. This industry has widely adopted robotics for use in painting, welding, and, to a lesser degree, assembly.
GMF Robotics of Michigan reportedly leads the domestic industry in sales. This company is a joint venture between GM and Fanuc Limited of Japan. Designs for basic GMF units largely originate overseas, but the company estimates that each sales dollar is comprised of approximately one-half value added performed in the U.S.
The robotics industry is also well-represented in other Midwestern states. Wisconsin-based ASEA, a subsidiary of ASEA of Sweden, reportedly adds significant value to its products on the U.S. mainland. Other industry notables include Cybotech Corporation and Thermwood Corporation of Indiana and GCA/Industrial Systems Ltd. of Illinois.
1. Number of robotics manufacturers by state—1986

Recent industry trends
The industrial robot market originated in the U.S. about 25 years ago. According to U.S. Department of Commerce count, there are approximately 60 manufacturers of industrial robots in the U.S., as of 1986. The large number of producers masks a significant concentration, however; the top 10 producers account for approximately 80 percent of domestic production.
Following a long period of disappointing robotics usage in the U.S., sales rose rapidly in the late 1970s and early 1980s. During this period, U.S. manufacturers responded to the carrot of large productivity gains foreseen by analysts, and to the threats of overseas competition that were emerging in traditionally strong domestic industries. So far, most robotic applications have been made by the auto, electronics, metalworking, and aerospace industries. Robot sales escalated very rapidly from 1983 to 1985 as extensive modernization programs undertaken, especially by domestic auto manufacturers, stimulated demand (see table).
2. Domestic robotics shipments and number of producers
| 1983 | 1984 | 1985 | 1986 | |
|---|---|---|---|---|
| Robotics Institute Data | ||||
| Shipments (units) | 3,060 | 5,137 | 6,209 | 6,219 |
| Value of shipments ($ millions) | 194 | 333 | 443 | 441 |
| U.S. Department of Commerce | ||||
| Shipments (units) | n.a. | 6,534 | 5,466 | 6,150 |
| Value of shipments ($ millions) | n.a. | 226 | 276 | 251 |
| Number of producers | n.a. | 75 | 72 | 60 |
Now, however, the robotics industry is in a slump. Sales flattened in 1986 with some industry observers expecting as much as a 30 percent decline for 1987. Lagging sales stem from cut¬backs in capital spending by domestic auto producers, who are reportedly experiencing a difficult transition to the new technologies. As a result of faltering market conditions, many firms are merging, closing down operations, and abandoning domestic product development in favor of foreign product lines.
Japanese successes
While the robotics industry originated in the U.S., the Japanese were quick to follow, developing their own domestic markets before penetrating U.S. and world markets during the 1970s. Japan now leads the world in overall production, followed by the U.S. and Western Europe. The U.S., Japan, France, and West Germany are the largest users of robots. Japan reports significantly more robots installed in their factories, but many of these are less sophisticated in their operations than those installed in U.S. factories.
Most analysts believe that the U.S. balance of trade in robotics was roughly in balance in the early 1980s.1 However, the value of imports has risen sharply since that time, moving the U.S. into a deficit position. Japan has strongly gained share of U.S. markets in recent years. The U.S. imports an estimated 40 percent of robots with 80 percent coming from Japan. (The remainder arrives from Western European countries—especially Sweden and West Germany.)
Domestic producers have responded to strong foreign competition by cutting back on the manufacture of many robotics products—especially basic units. Instead, joint ventures and license agreements with overseas firms have become common. U.S. firms have increasingly imported basic robot units, especially from Japan, then added refinements and peripherals such as software and vision systems on the U.S. mainland. In fact, several firms have moved toward becoming service firms—selling, installing, and adapting foreign-source equipment in their U.S. factories.
Why has Japan been so successful in encroaching on this domestic industry long before the industry itself has fully blossomed? The first reason is a familiar story: The Japanese government extended extensive support and encouragement to the robotics industry through government-sponsored R&D programs and low-interest loans. Such support facilitated the growth of a large domestic market prior to widespread overseas marketing. The government encouraged market development through the use of tax incentives to domestic purchasers and lessees of robots. The wide domestic use of robots helped producers by providing a testing ground for quality control and applications. Moreover, a large Japanese market also contributed to economies of scale and lower production costs, which subsequently translated into very competitive export prices. Exports accounted for only an average 4 percent of Japanese robotic output from 1977 to 1980. By 1984, this figure had jumped to 28 percent.
U.S. robots—too clever?
A second reason for the disappointing U.S. performance may be tied to development mistakes. Imports encroached on domestic markets early because, in part, early generations of domestic robots were typically complex in design—perhaps too complex. As a result, some domestic products were very expensive and required frequent maintenance. Robots produced in Japan and Western Europe were often mechanically simpler and less expensive. Undoubtedly, much energy was mistakenly expended by U.S. researchers in trying to build sophisticated robots to mimic human work routines and abilities rather than learning to apply existing robotics technologies to factory functions. In rebuttal, however, many involved in U.S. robotics technology lay the blame for slow U.S. market growth at the feet of U.S. manufacturers who were too conservative in bringing the early robots into their factories.
Whatever the reason for the difficulties of the domestic industry, however, all is not lost. The U.S. continues to lead in some robotic technologies. As robotics users learn to apply robotics in their factories, the need for more sophisticated robots may emerge. If so, domestic producers may expand market share. Robots with vision and tactile sensors will most likely be the next major advance. Already GM and Ford use some robots with vision systems, for example, to install auto windshields as they move down an assembly line. With much of the research in “machine vision” being conducted in the Detroit-Ann Arbor area, U.S. producers can potentially emerge ahead of the competition in this area.
Seventh District perspective
Along with their U.S. brethren elsewhere, Midwest producers are retrenching in response to slumping sales.
The Midwestern problem may be magnified because of the pullback in robotics purchases by the auto industry. But even before that, it was apparent to many industry analysts that robotics usage would soon spread beyond the auto industry. And, as robotics sales spread to industries such as electronics and aerospace, the market share of Midwestern producers could be expected to diminish.
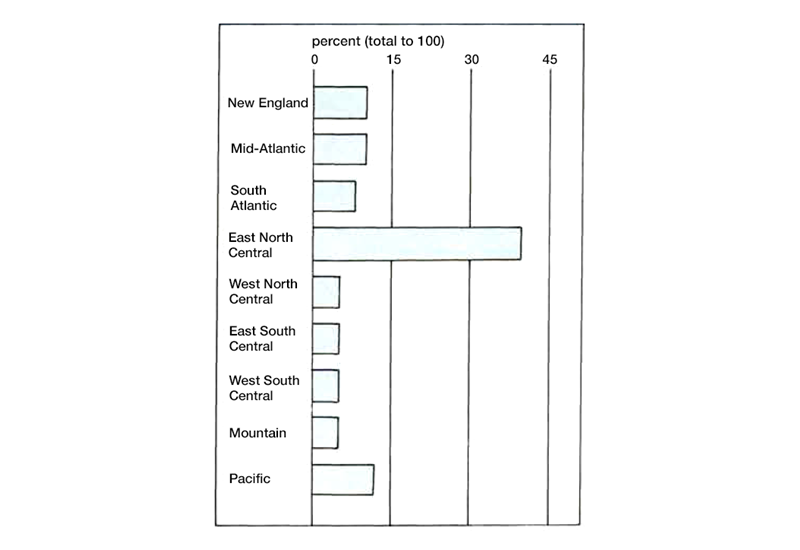
These market developments appear to dim the prospects for robotics production to make a significant contribution to Midwest revival. However, regional growth may be more closely tied to technological gains acquired through the purchase and adoption of such innovations as robotics rather than the actual production of robots. Those regions gaining an edge in technology through early adoption of process technologies will have competitive advantages over neighboring regions. Several studies have reported significant regional differences in the rate of technology diffusion, and the Midwest already has the lion’s share of robots installed (see chart).2
3. Robots in use

Several factors will determine if the Midwest adopts emerging factory automation technologies more rapidly than other regions. The concentrated presence of producers in the Midwest may encourage a rapid adoption of robotics technologies by Midwest industries. Producers have learned that successful robotic installations are often those in which the vendor takes an active role in integrating new technologies with the production system, so robotics vendors have the incentive to push local adoption. Physical proximity can be valuable in supplying factory automation systems. However, this need for a close relationship between producer and vendor has encouraged many large firms, such as GM, GE, IBM, and Westinghouse, to opt for in-house robotics subsidiaries. This in-house phenomenon has taken away much of the potential market of the independent producers.
Remaining Midwest robotics producers now have an incentive to cultivate a small-firm market niche to ensure their own survival. But expanding the market for smaller robotics-using firms will not be easy. Firm size has been identified as an impediment to factory automation because of the high costs and risks imposed on smaller firms. Here again, the region’s early start in factory automation has possibly helped to spur technology adaptation in the Seventh District. The Midwest contains several public institutions to help overcome the barriers that small-to-medium firms must surmount in considering new technologies. One, the Industrial Technology Institute in Ann Arbor, Michigan, provides direct and practical services to individual firms seeking to implement computer-controlled manufacturing systems. Another, the International Flexible Automation Center in Indianapolis, will soon emerge as an educational center for small-to-medium firms and a clearinghouse for intelligent machine producers.
Conclusion
With the infant robotics industry in a state of flux, it is far too early to tell whether the production segment of this industry will settle in the Midwest. In any event, the domestic industry may well end up far smaller than once predicted owing to a surge of foreign competition and disappointing rates of adoption by user industries. Similarly, the impact of the new technology on the geography of manufacturing cannot be predicted. Still, the Midwest’s quick start in both applying and producing robotics technology bodes well for future productivity gains in the District.
MMI—Midwest Manufacturing Index

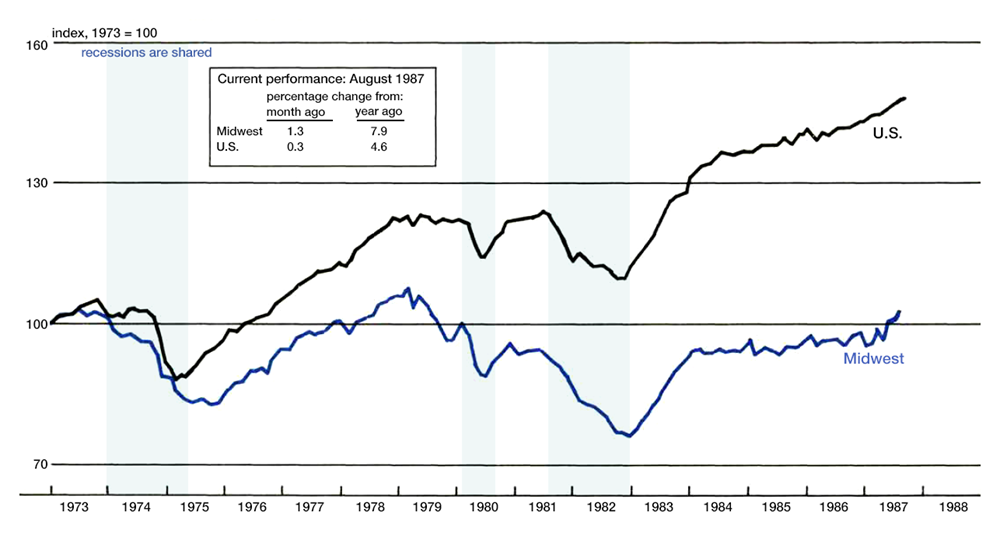
The Midwest Manufacturing Index (covering manufacturing industries in Illinois, Indiana, Iowa, Michigan, and Wisconsin) showed further improvement in August, up 1.3 percent from the previous month. The gain marked the fourth consecutive advance for the index, after being relatively flat since the beginning of 1986. Capital usage accounted for most of the gain in August, while labor (measured by employment and hours worked) was virtually flat.
The MMI showed a stronger gain than the Federal Reserve Board’s Index of Industrial Production, which gained only 0.3 percent in August. Both indices, however, were deriving much of their strength from durable-goods industries, particularly primary metals and nonelectrical machinery. An exception for both was transportation equipment, which reflected attempts to reduce inventories.
Notes
1 Historical data on robotics are not widely available because sales were previously subsumed under existing SIC codes. The Census Bureau is now wrestling with an adequate definition of this industry. The 1987 Census of Manufacturers will report on robots as a 5-digit “product class” which will mean that some limited data will be reported on. Subsequent analysis of the 5-digit data will help determine the possibility of defining robotics as a “4-digit” industry.
2 The Midwest is represented by the North Central regions in the chart. The East North Central region includes all states in the Seventh District except Iowa. It also covers Ohio. A more recent study reports the adoption rates for a wide range of automation technologies by industry in each of six Great Lakes states. See Frostbelt Automation: The ITI Status Report on Great Lakes Automation, Industrial Technology Institute, Ann Arbor, Michigan, 1987. See also John Rees, Ronald Briggs, and Raymond Oakey, “The Adoption of New Technology in the American Machinery Industry,” Regional Studies, Vol. 18, No. 6, pps. 489-504.


