The following publication has been lightly reedited for spelling, grammar, and style to provide better searchability and an improved reading experience. No substantive changes impacting the data, analysis, or conclusions have been made. A PDF of the originally published version is available here.
At last, the Midwest is in a full-scale manufacturing boom. Everywhere, manufacturers are cranking up production, with many straining capacity for the first time in this decade.
The turnaround began in 1987 as the dollar dropped from levels that had been undermining the nation’s global competitiveness. Bumping against capacity constraints led to a bulge of investment spending in 1988. But the Midwest had already been investing in modernization and closing out-of-date facilities since 1980. It is now competing aggressively for market share lost during the years it was called the “Rustbelt.”
This Chicago Fed Letter looks at the performance of various sectors within manufacturing and tries to identify the causes of the Rustbelt’s new shine. Some of the Midwest’s newfound fortunes are the result of a favorable industrial structure. That is, the Midwest has relatively more of the kind of industries that led the economy in 1988—industries that make consumer-durable goods, goods for export, and machines for industrial reinvestment.
But the industrial success can also be attributed to a new competitiveness. A battered Midwest manufacturing sector has slimmed down and shaped up. Its productivity growth now outpaces the nation by a significant margin. The Midwest appears to be working harder and smarter.
Take-off in 1988
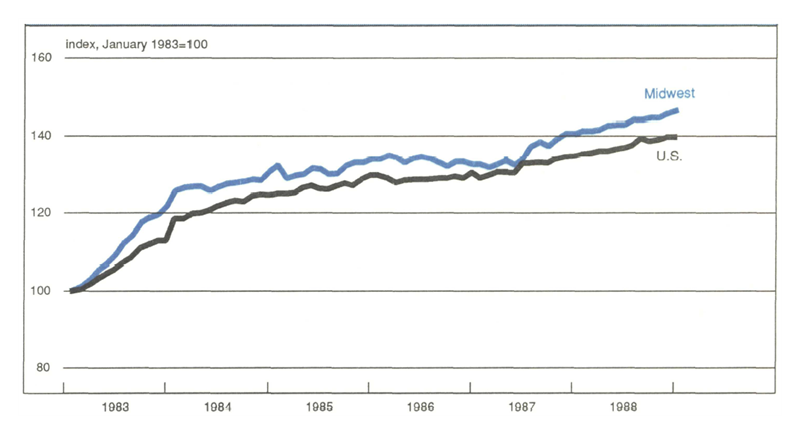
After a strong start in 1983, the Midwest slowed and then leveled off in the mid-1980s. Figure 1 shows the performance of Midwest manufacturing, as measured by the Midwest Manufacturing Index (MMI) against an equivalent national index, for the current expansion.1
1. Pacing the nation: Midwest leads in current expansion

Plateauing after a promising start in 1983, the Midwest began to show signs of a definite turnaround during 1987, when growth in its manufacturing sector began to accelerate. For that year on average, however, manufacturing in the Midwest lagged the nation, perhaps because the strong dollar was having lingering effects on the region. (Demand for capital goods, for example, can take as long as three years to adjust to changes in exchange rates.)
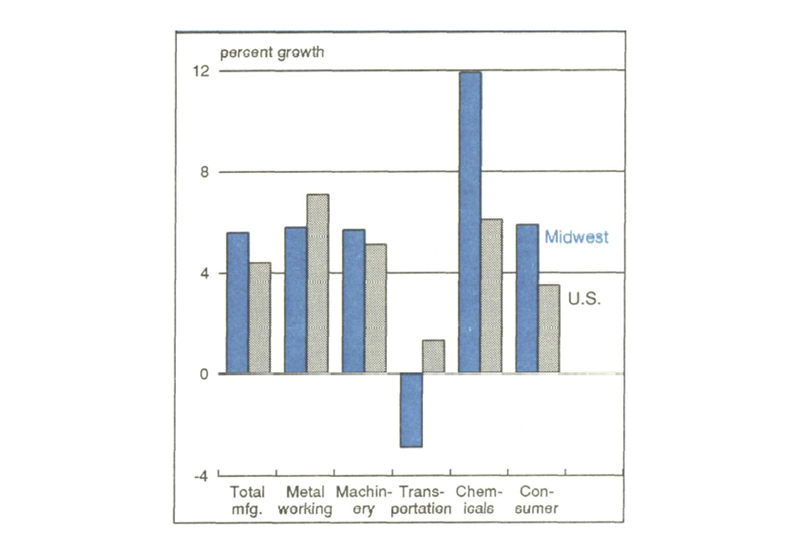
Manufacturing growth in the Midwest has maintained a steady pace since its strong finish in 1987. As a result, growth in the region last year exceeded national growth by an impressive margin—5.6%, compared to 4.4% (year-over-year). Three sectors (metalworking, machinery, and consumer goods) grew at roughly the same rate as the MMI, while the exceptional growth in the chemical sector compensated for some setbacks in the transportation sector (see figure 2).
2. Manufacturing strong in 1988

Metalworking kept pace with Midwest growth
The metalworking sector experienced about average growth for the Midwest in 1988, but that growth was a remarkable reversal of its fortunes over much of the 1980s. From 1983 to 1987, the sector was actually declining. The ability of this historically key sector to keep pace with the overall growth of manufacturing in the region is a positive statement in itself of the renewed vitality of the Midwest.
Much of the credit for the sector’s growth belongs to a leaner and tougher steel industry. The primary metals industry, predominantly steelmaking, grew 50% faster than the MMI overall. Inland Steel, the only steel producer headquartered in the Midwest, operated much of the year at near capacity levels, 94% in 1988 compared with 85% during the previous year. Indeed, while the regional sector still lagged the national metalworking sector, that may be because it simply ran out of capacity before the rest of the nation. In the past, manufacturing facilities in the Midwest have tended to be the last brought into production during an economic expansion, because they were often less efficient than plants elsewhere. This is less true now, because much of the Midwest has retooled.
Machinery in Midwest pulls ahead
Growth in the production of machinery benefited not only from the need for domestic manufacturers to expand capacity but also from the surge in exports of capital goods. Caterpillar, the Peoria-based earth-moving giant, for example, added 4,000 workers in the past two years and ended 1988 operating at full capacity in several of its product lines. After annual sales declines of 7% on average over 1981-86, Caterpillar averaged 3% growth in the last two years. Motorola, a Midwest producer of electronics equipment, expanded total production 25% in 1988. Part of that expansion can be attributed to improvements in the computer industry, after the 1984-85 chip debacle, but gains in the Midwest centered around radios and paging devices.
Some capital-goods producers have not fared as well. John Deere & Co., makers of farm equipment, and Briggs and Stratton Corp., makers of small engines, saw their recovery stalled by last year’s drought. Nevertheless, Deere’s profits were 200% higher in 1988 than its total profits over the previous seven years. The machinery sector was also held back by softness in household appliances, which declined in 1988 nationwide after operating at record levels in recent years.
Consumer-related products: A solid year
The consumer sector is dominated by nondurable consumer-goods industries, such as food processing, paper, and publishing. The sector’s Midwestern growth (5.9%) was strong in 1988—nearly 50% percent above the national average. The paper industry, operating at virtually 100% capacity in 1988, was an important source of growth, as was the food processing industry.
But perhaps the biggest surprise was the furniture industry. Furniture production expanded nearly 12% in the Midwest last year, with the labor input contributing over half of the total gain in output. Steelcase and other major producers of office furniture located in western Michigan, contributed to the regional gains. The furniture industry is about half the size of the paper and publishing industries, but it contributed roughly twice as much as either industry to growth in Midwest manufacturing activity.
Chemicals: A star performer
The chemical sector’s growth (11.9%) was nearly twice the rates of the MMI and the nationwide chemical sector. The chemical industry itself, led by petrochemicals, generated the bulk of the sector’s growth. Other industries in the sector, such as the rubber/plastics and stone/clay/glass industries, also did well relative to their national counterparts. Only the stagnant petroleum industry, buffeted by a 15% decline in world crude oil prices last year, failed to expand production in 1988.
Transportation: Plant closings take toll
As expected, the transportation sector proved to be a serious drag on the Midwest economy. Manufacturing activity in this sector declined in 1988, despite continuing strong auto sales. Automotive plant closings in Michigan were at the root of the problem. In total, the Michigan economy is estimated to have lost about 25,000 jobs directly or indirectly as a result of last year’s closings. The number of automotive units produced in Michigan declined only about 1%, as production was shifted to other sites in the region. However, employment at those new sites did not expand enough to offset the losses at the closed sites.
Despite the closings, the Midwest did relatively well in maintaining its share of auto industry production. The Midwest accounted for 47% of all automotive units produced in 1988, compared with 45% in 1987. While Michigan’s output was down slightly, Ford’s Chicago assembly plant produced at record-breaking levels last year, operating on maximum overtime.
1989 outlook favors Midwest
The question now is: Can the Midwest sustain this growth? The current economic expansion nationwide is expected to extend through 1989, although at a slower pace than last year. Economic growth, however, will continue to be dominated by export and investment growth. Indeed, from the median forecast at the Economic Outlook Symposium, sponsored by the Federal Reserve Bank of Chicago in December, industrial production is expected to grow 2.7% in 1989—faster than the estimated growth in Gross National Product.2 An emphasis on consumer and producer durables to meet export demand and to expand domestic production capacity is ideally suited to the industrial specialization of the Midwest economy.
The outlook for the Midwest’s industrial growth in 1989 is shaped by two key factors—industrial structure and competitiveness, the same factors largely responsible for 1988’s turnaround. In 1988, fully two-thirds of the observed difference between the growth rates of the Midwest and the nation could be attributed to the Midwest’s favorable mix of industries for the type of demand (e.g., exports and investment) being generated by the national and world economies. The other third of the growth differential could be attributed to competitiveness, which allowed Midwest industries to increase their share of the national market.3
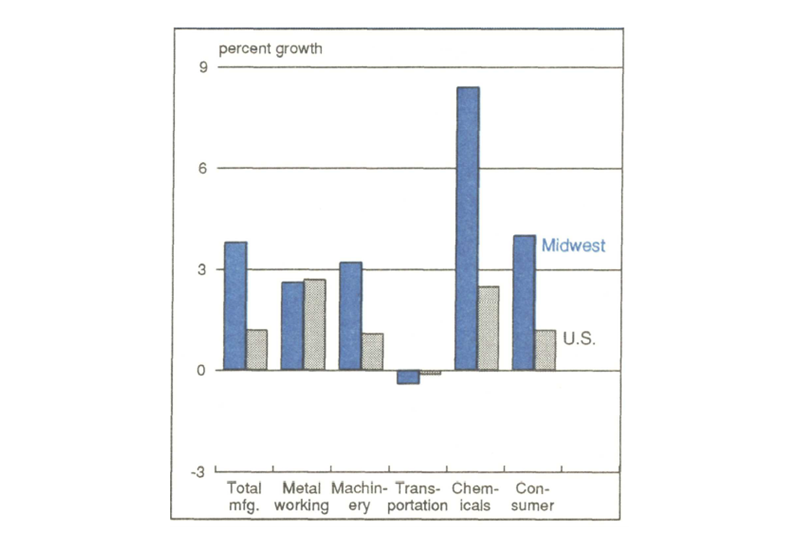
A cornerstone of the Midwest’s competitive strength has been in its productivity growth. Efforts by Midwest producers to eliminate inefficient plants and modernize the rest have been intensive in the 1980s. The benefits are evident in labor productivity growth (see figure 3). During 1988, labor productivity growth in the Midwest equaled or exceeded the national pace in every sector, with the largest gains centered in the robust chemical sector.
3. Productivity gains in 1988

Anticipating the strength of the competitiveness factor is difficult (and risky) because of its volatility. However, a good deal of insight into the meaning of the economic forecast to Midwest manufacturers can be obtained simply by focusing on the industrial structure effects.4
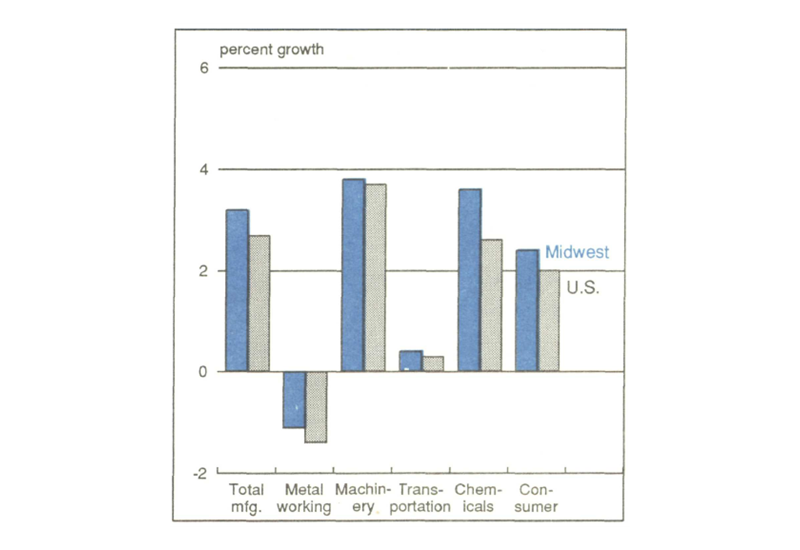
In 1989 manufacturing activity in the Midwest is expected to expand 3.2%, or nearly 20% faster than in the nation as a whole this year (see figure 4). If Midwest producers continue to outperform their industry counterparts, the differential could be even greater. But merely assuming that Midwest producers maintain their current market shares means that the Midwest can expect to do well in 1989, relative to the nation.
4. Midwest looks good for 1989

The distribution of this growth will be uneven. For example, the metalworking sector is the only sector expected to decline nationally in 1989. The Midwest will share in that decline, as the steel industry experiences a marked softening from record production levels last year. Flatness in auto production and excess inventories among steel service centers point to production dropping as much as 7% for the steel industry alone. However, the metal fabrication industry should expand 1% to 2% this year. And, because the region has a higher proportion of its metalworking production in fabrication than the nation on average, the Midwest will not experience as much a decline in that sector as the nation.
Transportation equipment is expected to be virtually flat, with weakness in autos and aircraft offsetting strength in truck production. While the Midwest accounts for nearly half of all auto production, it is also a major center of truck production. As a result, the region will follow in step with the nation.
Similarly, the machinery sector, while a major source of production growth, seems to offer little structural advantage to the Midwest. It is worth noting, however, that metal-cutting and metal-forming machine tools are expected to be among the ten fastest growing industries in 1989. Both industries, concentrated in the Midwest, were declining over much of the 1980s. The expected weakness in household appliances, rather than capital goods, may account for the machinery sector’s lack of a decisive structural advantage for the Midwest.
It is the nondurable goods sectors—chemicals and consumer products—that are expected again to give the industrial structure of the Midwest the bulk of its comparative advantage. The chemical industry is expected to more than offset weakness in the petroleum industry nationally. But the Midwest has a significant advantage in having a relatively large share of its chemical sector devoted to the chemical industry and little devoted to the troubled petroleum industry. Within the consumer-related products sector, the Midwest’s advantage is derived from having twice the national concentration of that sector’s production in the vigorous paper industry.
The Canada card: A new competitive edge
As important as industrial structure may be to a region’s performance, it must be remembered that this factor is subject to the whims of the national economy. Indeed, if the Commerce Department’s outlook turns out to be too optimistic and the economy experiences a significant slowdown in output growth this year, the high concentration of cyclically sensitive industries could result in a reversal in the benefits derived from the Midwest’s industrial structure. Sustainable growth in the future will depend on a second factor, continued improvements in the competitiveness of Midwest manufacturers.
A third factor—the opening of freer trade between the U.S. and Canada in 1989—could strengthen a whole set of existing competitive advantages for Midwest manufacturers. Location advantages of the Midwest, built on cheap water transportation that linked raw materials with steel and auto plants, have been waning as the national economy moves away from heavy manufacturing. But increased trade with Canada may further boost the Midwest’s competitive performance relative to other regions in the years ahead.
Notes
1 Note that this figure uses the beginning of 1983 as its base for comparison. Thus, the figure highlights the MMI’s performance since the beginning of the current expansion. In our presentation of the MMI in the past, we have used 1973 as the base. In addition, the MMI has been modified to incorporate industry-based deflators in its estimation of constant-dollar output.
2 For a summary of the Symposium’s outlook, see the February 1989 Chicago Fed Letter.
3 The contribution of competitiveness may be understated by the observed growth differential. The drag imposed on the Midwest economy by the auto-plant closings had less to do with short-term competitive problems than with the long-term restructuring that the industry has been undergoing throughout much of this decade. If the Midwest’s transportation sector had grown at the sector’s national average, industrial structure would have accounted for only about half of the growth differential.
4 We prepared a set of industry forecasts from the data contained in the 1989 Industry Outlook (published by the Department of Commerce). The regional forecasts were constructed using national industry growth rates, weighted according to each industry’s share of total Midwest manufacturing output in 1986. The forecasts were also adjusted to be consistent with the Symposium’s median forecast of industrial production growth. The point is not so much to forecast actual growth rates, as to get a sense of how manufacturing growth will be distributed across industries, given the Commerce Department’s particular outlook, and to determine what effect that will have on the Midwest, given its unique industrial structure.


