The following publication has been lightly reedited for spelling, grammar, and style to provide better searchability and an improved reading experience. No substantive changes impacting the data, analysis, or conclusions have been made. A PDF of the originally published version is available here.
Last month’s Chicago Fed Letter carried a revised version of the Midwest Manufacturing Index (MMI). This month, in our second anniversary issue, we take a look at the changes in the MMI and the underlying reasons for them.
In all, three distinct changes were made in the index: 1) the base year was moved from 1973 to 1983; 2) the methodology was improved; and 3) a U.S. version of the MMI replaced the Federal Reserve Board’s Index of Industrial Production as the national comparative index.
When all these changes are added up and put in proper perspective, the casual observer may wonder what all the fuss is about. We have not rewritten history with the new index; the Midwest economy still shows the effects of wrenching change in the early 1980s and continues to show an impressive recovery since the beginning of 1983.
But, for those who want to use the MMI as an analytical tool, the changes are substantial. With those potential users in mind, we have made and will continue to make every effort to provide the most accurate index of manufacturing activity that we can.
A new base
Because indexes like the MMI measure changes in growth and not absolute levels of output, they need a base—a reference point—from which subsequent measurements are made. We originally chose January 1973 as the base point, assigning it a value of 100.
Any subsequent value of the MMI would be some percent above or below that January value. For example, an index value of 125 in March 1987 would mean that manufacturing output was 25% above the January 1973 level.
The choice of such a reference point is arbitrary. In this case, it served to compare differences in long-term trends between the Midwest and the nation (see figure 1). It showed the widening gap between manufacturing output levels in the region and the nation as three relatively severe recessions (1973-5, 1980, and 1981-2) struck the economy.
1. Midwest Manufacturing Index: The old…
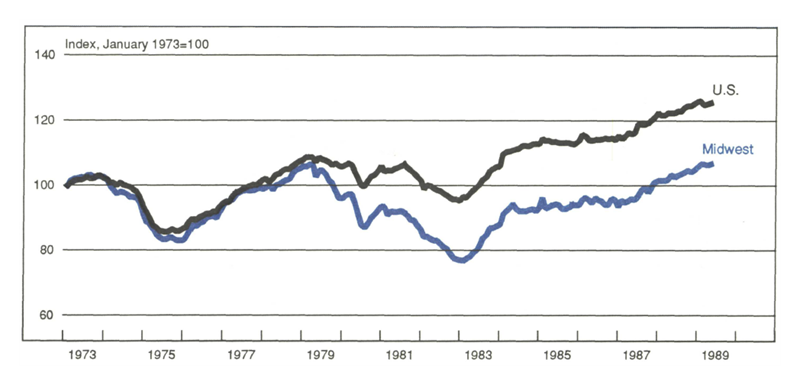
But the strong performance of Midwest manufacturers during the current economic expansion, which began at the end of 1982, is not readily discernible in figure 1. However, by indexing the MMI to January 1983, as shown in figure 2, the gains become obvious. Even the strong showing in 1988, discussed in the April Fed Letter, can be seen in the widening gap between the national and Midwest indexes.
2. …And the new
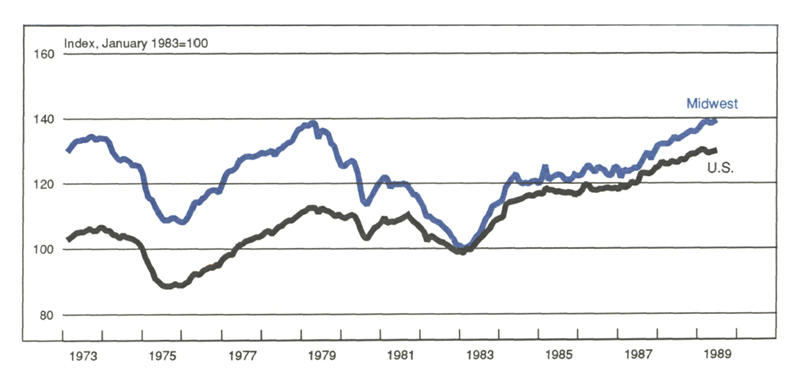
Reading figure 2, however, requires a cautionary note. While being above the national index after January 1983 is “good,” being above the national index prior to 1983 is “bad” for the Midwest because it means that the Midwest was declining toward the 1983 index number of 100. Indeed figure 2 shows that by 1983, the Midwest had dropped 30 points-nearly 30%-from its 1973 level. The nation as a whole had barely changed during that time.
A new empirical model
The most substantive but probably least noticeable change in the MMI is the introduction of an entirely new model to calculate manufacturing output in the Midwest. The original method was essentially ad hoc. Index values were generated by a weighted average of two monthly data series—hours worked (as a measure of the labor input to manufacturing) and electrical power usage (as a measure of the capital input).
The weights were determined by each input’s share of total output. If labor’s share was 50%, then the monthly changes in output would be determined equally by the two input series. If labor’s share was 67%, then labor would be given twice the weight of capital, and month-to-month changes in output would be driven primarily by changes in the amount of hours worked.
Over the period for which annual values of manufacturing output were known—1973 to 1986—the weights were adjusted to reflect productivity trends and the calculated monthly values summed to the known annual values.1 But for the most recent years—1987 to 1989—annual values are unknown and have been implicitly estimated. This was done by holding the weights for labor and capital constant and simply extrapolating the index, with only these inputs generating monthly values for manufacturing output.
The major problem with the original method of extrapolating data beyond 1986 is that in reality the weights are unlikely to remain constant. Labor productivity tends to improve gradually over time, and labor’s weight has been on a downward trend in most industries. By holding labor’s weight constant, the index will consistently underestimate output and that error will accumulate over time.
The focus of the revision was to improve the accuracy of the index over the post-1986 period. This was done by designing an empirical model, well-grounded in microeconomic theory of the production process. Values for the weights are estimated for each of the 17 industries in the index, and empirically verified for their accuracy.2 The new weights are then projected beyond 1986, based on the best information available (which includes year-to-year changes). Monthly values are constrained to sum exactly to the annual value-added data.
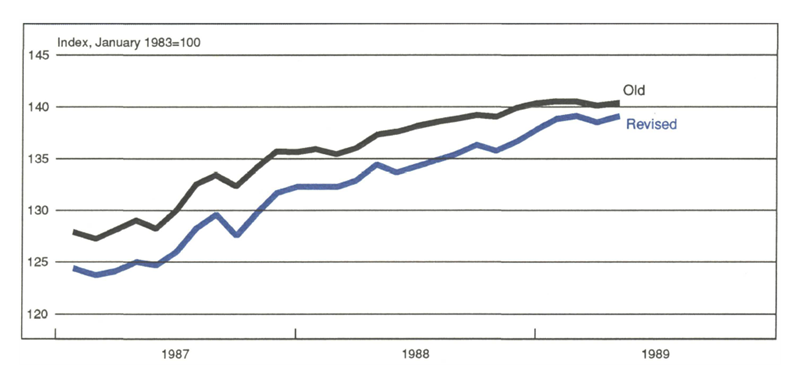
The result has been a substantial improvement in the accuracy of the index. The difference between the old and new index can be seen in figure 3. In the figure, the old index is above the new index because the old index was not constrained to sum to the annual value added. While the difference over the short run is not enormous—a tribute to the quality of the old index—the tendency to underestimate manufacturing output over time can clearly be seen in the steeper slope of the new index for the post-1986 period.
3. MMI: Old model and revised model
A new comparative index: USMI
Improving the accuracy of the MMI left unresolved the issue of how to compare its performance to the nation. Growth in Midwest output from one year to the next can lose its luster if that growth still substantially lags the national average. In past publication the MMI has been compared to the Federal Reserve Board’s Index of Industrial Production. While conceptually similar, that index is constructed differently from the MMI and comparisons between the two can be misleading.
The Board’s index is based primarily on physical products, i.e., tons of steel or barrels of oil. About 40% of the Board’s index is derived from such products data, with the remainder derived either from labor or capital inputs. Only 2% use combined labor and capital inputs (which are the exclusive sources of monthly movements in the MMI).
Use of physical products introduces two problems to the comparison to the MMI. First, because the Board’s index is based on physical units, the data do not have to be deflated to remove the influence of inflation. A comparable set of data for the most part does not exist at the regional level, and the dollar value of goods produced must be substituted. Price deflators are applied to the MMI to adjust for inflation. Whatever deflator is chosen for the MMI, it will most likely differ from the implicit deflator underlying the Board’s index. As a result, the two indexes will differ because the deflators are different, which is not what the comparison is trying to capture.
Second, and most important, physical products at the regional level are not the appropriate measure of manufacturing actually taking place in that region. For example, products in the Midwest could increase simply because more inputs (in the form of intermediate products) are being imported from other regions and not because production activity in the Midwest has increased. Thus, the MMI is based on value-added data—the difference between the value of final products and all purchased materials, which represents that portion of a product that is actually created in the region.
Movements in value added from month to month are expected to follow closely the cyclical pattern of production, so that past comparisons of the MMI to the Board’s index have been generally on track. But the comparisons of individual months can be distorted by deviations of value added from total products at the national level.
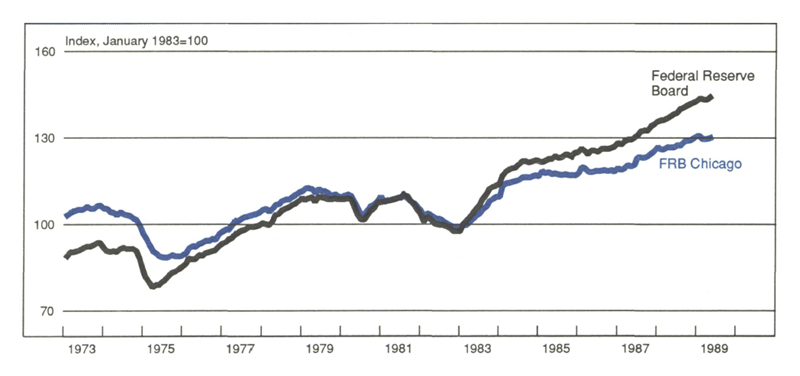
The solution to the problem has been to construct a U.S. version of the MMI, so that both indexes would be based on movements in labor and capital, benchmarked to annual measures of value added. While the new index for the nation may be less concrete than the Board’s index, the USMI has the advantage of having the same structure as the MMI. Figure 4 shows the difference between the USMI and the Board’s index. Again, both series have an almost identical cyclical pattern, but a noticeably different long-run trend, i.e., the Board’s index has been growing faster than the USMI.
4. U.S. Manufacturing indexes
The MMI as an analytical tool
As a monitoring tool, the MMI gives up-to-date information on industry activity in the Midwest that is more comprehensive than alternative sets of data. For example, employment data are the most frequently used data to monitor regional activity. Since employment is sensitive to the business cycle, comparisons can be made on a relative basis. Did the region lead or lag the nation in a recovery or recession? Was the recovery (or recession) stronger or weaker in the region than in the nation? If employment is the main concern of the analyst, as may be the case with government agencies, the analysis of employment patterns may be adequate. But producers and other corporate analysts are more often concerned about production and sales. And employment data will typically underestimate these types of changes, so that absolute comparisons—the region grew X%, while the nation grew Y%—may not fairly reflect differentials in output growth.
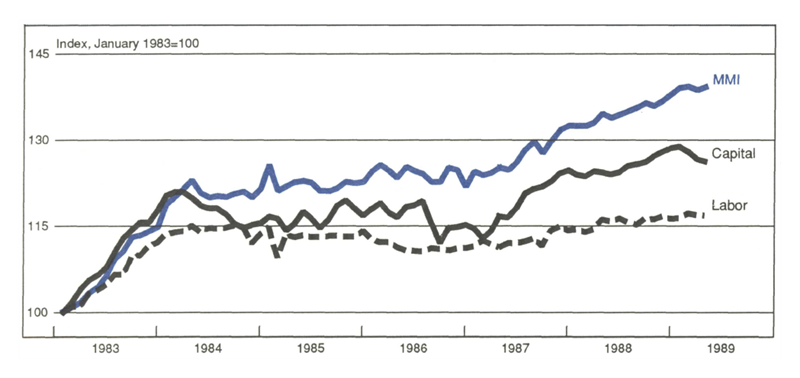
The current expansion is a case in point. Labor, which is employment measured in hours worked, shows the same general pattern as output (see figure 5). Labor rose sharply in the first year of the recovery (1983), flattened out for a few years, and then began a slow rise (relative the 1983 experience). However, the absolute changes in labor were much less than the swings in output. Much of the difference between the two series is reflected in capital usage. Indeed, capital has been rising much more dramatically than labor since early 1987, and output has been rising largely as a result of that rise in capital.
5. Manufacturing activity by labor and capital usage
For the Midwest producer, who knows his own sales or production, the MMI can now be used in a variety of ways. For example, a Midwest producer can use that information to see how his company is doing relative to other regional producers, typically more relevant than comparing it to some national standard that includes high-growth areas like the West Coast and New England. Or a Midwest producer can track his markets in the Midwest, which again may be more relevant than tracking the national market, because higher (or lower) growth could be occurring outside his market area.
With the USMI tracking the Board’s Production Index so well, a logical extension of the MMI is into forecasting near-term growth. Forecasts of the Board’s index can easily be translated into a USMI-comparable forecast by simple statistical procedures and then correlated with the MMI to project regional growth. Since producers typically make their future plans around sales growth rather than employment growth, the MMI can be a particularly valuable planning tool for them.
For long-term analysis, the MMI has even more intriguing applications. For example, the size and growth of a market can be approximated with the assistance of an input-output table. An input-output table provides each input’s share of an industry’s output. For example, a table would show what percent of a car is steel, plastic, rubber, etc. Given this information, one could calculate the demand for steel generated by the auto industry’s growth in the Midwest. Repeating the calculation for each industry that consumes steel, one can calculate the size of the market and how much it has grown in the last 16 years. In addition, because the MMI measures how much steel is actually produced in the Midwest, one can estimate on a net basis how much of that demand was supplied from within the Midwest and how much was imported from or exported to other regions.3
Other uses of the index can take advantage of the fact that the MMI measures regional output up to the current month, while other sources (such as the Survey of Manufactures) are limited to annual observations and are two to three years out of date. Taking advantage of the timeliness of the MMI allows an analyst to study issues of structural change that capture the current structure of the Midwest economy.
And finally, for those who are neither data junkies nor graph groupies, the MMI will give an even better picture of how we are doing here in the Midwest.
Notes
1 Output is measured by value added from the Annual Survey and Census of Manufactures from the Bureau of the Census.
2 See May/June 1989, Economic Perspectives, Federal Reserve Bank of Chicago.
3 Those interested in obtaining index value by industry should contact the authors.


