The following publication has been lightly reedited for spelling, grammar, and style to provide better searchability and an improved reading experience. No substantive changes impacting the data, analysis, or conclusions have been made. A PDF of the originally published version is available here.
The past six years plus of recovery and expansion in the U.S. economy have given abundant evidence of the vitality of small businesses. It is now generally agreed that small firms (under 100 employees) drove at least the early stages of the expansion and created a lot of new jobs, although economists are still arguing about the exact numbers.
But “small business” includes manufacturers, “mom and pop” stores, and doctor’s offices, among many others. These businesses don’t move in lockstep just because they are small. They are subject to quite different stresses and economic forces. In this Chicago Fed Letter, we will indulge in a favorite pastime of economists—disaggregation. By breaking out some categories of small business—manufacturing, retail, and services—and looking at their recent employment history, maybe we can see where they are headed and what factors are shaping their future.
In the aggregate
The early stages of the expansion after the trough of the recession in 1982 were marked by strong growth in consumer expenditures and housing construction, which favored small businesses. Figure 1 shows small businesses off to a running start, fueling much of the employment growth in the first two years of the expansion.
1. Small business drives expansion
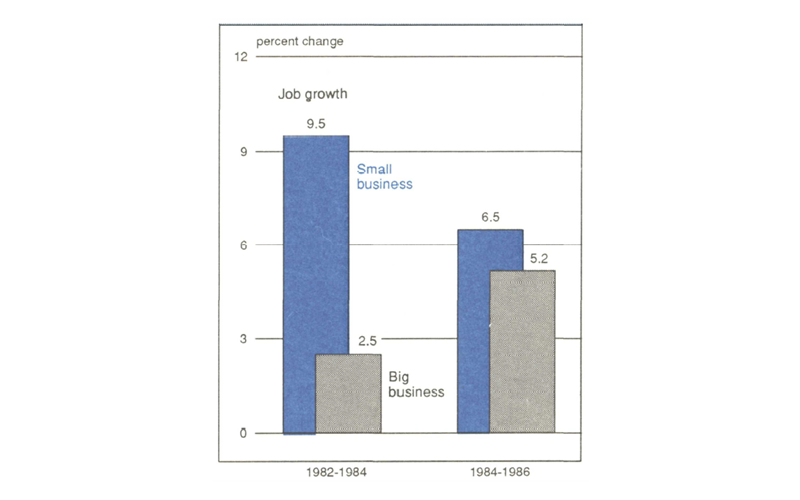
More recently, in the 1984-1986 period, large business employment growth began to pick up steam. Growth in consumer expenditures slowed and residential fixed investment declined. As a result, small business employment growth, while still large, also slowed. At the same time, investment in commercial and industrial buildings and equipment and growth in business inventories have become more important. Further, with the decline in the foreign exchange value of the dollar, exports have increased. Larger businesses gained from these developments.
This aggregate picture of the economy in the early years of the expansion masks a number of significant stories. Here are some of them.
In manufacturing: Downsizing and retooling
Restructuring and, in many industries, downsizing have been important factors affecting the differential employment growth rates for different sizes of firms. This has been especially true in the manufacturing sector.
At large manufacturing firms in the U.S. with 500 or more employees in 1982, employment had declined 4.7% by 1984 (see figure 2). The decline continued between 1984 and 1986 but at the somewhat slower rate of 2%. In sharp contrast to the decline in employment at large businesses, employment at small manufacturing businesses increased 9.5% between 1982 and 1984 and 7% from 1984 to 1986.
2. Manufacturing: Small is big
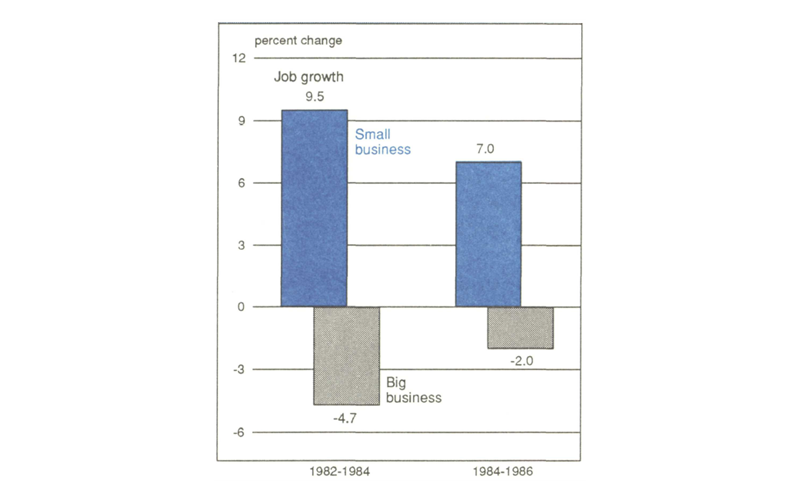
Declines in employment in specific manufacturing industries were major factors in the poor performance of large firms nationally. Large firms engaged in the production of primary metals, fabricated metal products, and industrial machinery and equipment contributed about two-thirds of the net job losses at large manufacturing businesses between 1982 and 1986. Other industries with substantial job losses at large firms during this period were chemicals and allied products, electronic and other electrical equipment, and apparel and other textile products.
While large firms in many manufacturing industries were experiencing substantial job losses during the recovery and expansion, small firms were the primary source of manufacturing employment growth in the economy. Employment at small firms with fewer than 100 employees increased 16 percent between 1982 and 1986. Manufacturing industries with above-average growth rates for small firms included textile mill products, lumber and wood products, paper and allied products, printing and publishing, chemicals and allied products, rubber and miscellaneous plastics products, electronic and other electric equipment, and transportation equipment.
No single reason appears to account for the different employment growth rates among large and small firms in the various manufacturing industries. Some large firms faced with foreign competition, particularly those in heavy industry, found it necessary to introduce new technologies and business procedures to remain competitive. In many instances this involved restructuring and downsizing and outsourcing. In some industries, such as chemicals and electronic and other electrical equipment, in which employment decreased substantially at large firms, employment growth was rapid at small firms, which were able to innovate and compete successfully. Growth in employment at small firms in other industries, such as textiles, lumber, furniture, and paper products, probably reflects the response to the increases in personal consumption expenditures and residential construction.
In retail trade: Consolidation and the new chains
Retail trade has generally been considered an important industry for small-firm employment. But, during the last 10 years or so, retail trade has been undergoing structural changes marked by consolidation and employment growth at larger firms.
Contrary to the experience in the manufacturing industries, employment at large firms engaged in retail trade in the U.S. has been growing more rapidly than employment at small firms. This has been especially true in the most recent two-year interval for which data are available (see figure 3). Between 1984 and 1986, employment at large retail firms with 500 or more employees in the U.S. increased 16% compared to an increase of only 2% at retail firms with fewer than 100 employees.
3. Retailing: Big does better
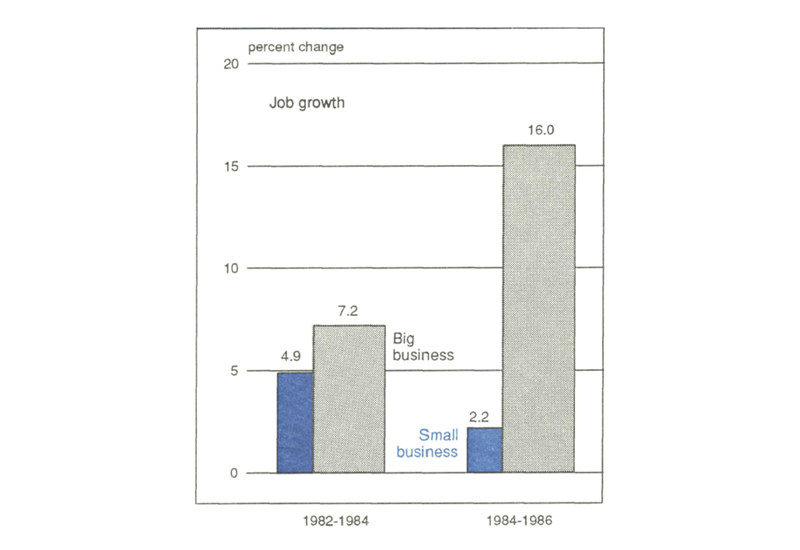
This dominance of large firms over small was true in all of the retail trade industries from 1984 to 1986. Retail industries with especially strong rates of growth at the large companies were building materials and garden supplies, general merchandise stores, automotive dealers and service stations, furniture and home furnishings stores, and miscellaneous retail stores. In contrast to the strong rates of growth at these large firms, small general merchandise stores, apparel and accessory stores, and eating and drinking places registered little change or lost aggregate employment.
The faster growth in employment at the larger retail trade firms reflects the consolidation in the industry and the growth of specialty chains. The retail industry, generally labor-intensive, has been faced with much larger capital expenditures as it has expanded its use of computers for inventory control and to monitor and control costs. Larger firms have benefited from easier access to capital and the economies of scale associated with the implementation of the new technologies.
In business services: Small is booming, but so is big
The personal and business services sector is a diverse group of industries with differing patterns of growth when analyzed by the size of the firm. Health services is the largest group in the sector and includes primarily professional offices, nursing and personal care facilities, and hospitals. Nationally, health services employment growth was more rapid at small firms than at large firms—primarily hospitals—between 1982 and 1984. The rates slowed to about half the earlier rates between 1984 and 1986 as measures were instituted to control health care costs.
The second largest services sector—and the fastest growing—is business services. It includes the rapidly growing computer and data processing services; personnel supply services; and building services; as well as advertising; credit reporting and collection; mailing, reproduction, and stenographic services; and security services. Nationally, employment at small business services firms has been growing rapidly throughout the 1982-1986 period (see figure 4). At the larger firms, employment growth was strong during the 1982-1984 period and accelerated between 1984 and 1986.
4. Business services: Both do well
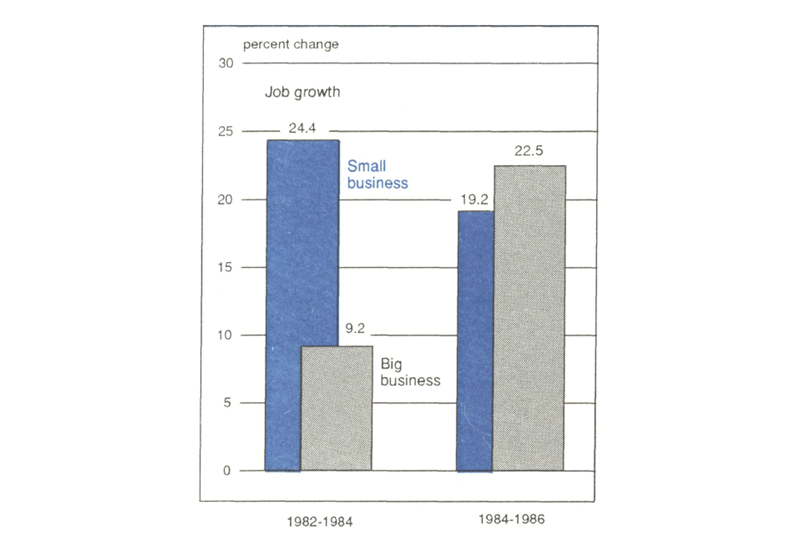
The rapid growth of employment in the business services sector reflects several trends in the business environment. Among these are the adoption of new technologies as evidenced by the rapid growth in employment in computer and data processing services. There is also the increased use of temporary and part-time employees who are included in the employment growth of personnel supply services, and not of the industry that hires them. This is also true for employment growth in building services and security services.
In the future: A more difficult environment
Emerging economic, demographic, and technological trends will affect small business employment growth in various ways—not all of them positive. Among the trends are the declining rate of population and labor force growth, the growth of international markets, and continuing technological change.
Although the U.S. population is expected to continue to grow over the next 20 years, the rate of growth will continue to decline as it has over the last four decades. Thus, the average annual rate of population growth—1.79% between 1950 and 1960—is expected to be no more than 0.52% between 2000 and 2010.
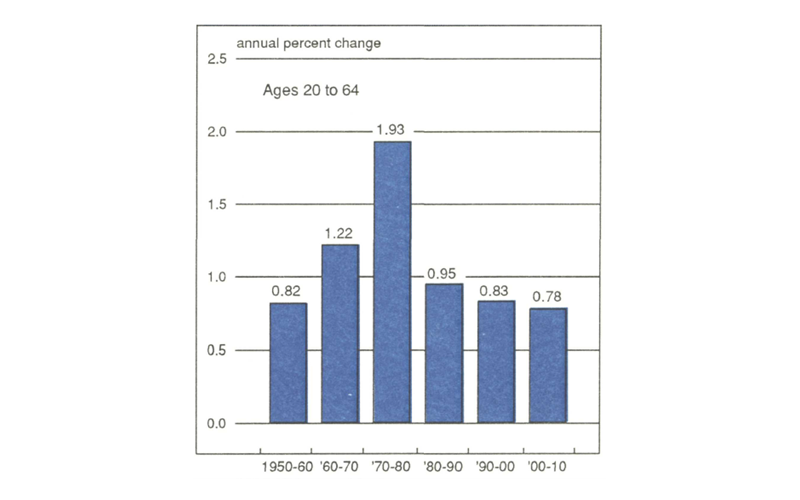
This slower rate of population growth will affect the supply of labor in the marketplace. Between 1970 and 1980, the number of persons in the 20-to-64 age-group, i.e., the workforce, was increasing at an annual rate of 1.93% as a result of the post-World War II “baby boom” (see figure 5). This age group should increase only at an annual rate of 0.78% between 2000 and 2010.
5. Work force growth slows
The slower rates of growth in both the population and the labor force will especially affect small businesses because they are generally more labor-intensive. Such firms may find it necessary to seek to increase worker productivity with more capital investment and expanded on-the-job training, to hire more older workers, and to continue hiring more women.
International markets have been growing rapidly over the recent decade and the growth is expected to continue. Large firms are the primary participants in the international markets. The role of smaller U.S. firms in international trade has generally been limited but many observers expect it to grow.
Small firms may participate indirectly in exporting by selling to large firms. Successful direct exporting by small firms will require the development of suitable products. Small businesses will also need to learn about the contractual arrangements necessary to ship, distribute, and support products in overseas markets successfully.
Continuing technological change will require small businesses to adopt technological improvements. The relative shortage of labor will increase the demand for labor-saving devices. Major investments in computers will continue. Computer literacy will become a prerequisite to the operation of almost any business.
For policymakers: A better understanding
External factors such as the stage of the business cycle, the type of industry, and emerging economic, demographic, and technological trends affect job growth. Thus, important questions arise for policymaking. When in the business cycle is small business growth more rapid? In what industries are small businesses likely to generate more jobs? What kind of help should small businesses receive in the future? Should resources to expand exports be directed toward small businesses or should these efforts be directed primarily toward larger businesses?
Recognition of the external factors affecting employment growth enables policymakers to focus their efforts and to better measure and understand the results. For small businesses, it enables management to better understand and adapt to the environment in which they operate.
MMI—Midwest Manufacturing Index
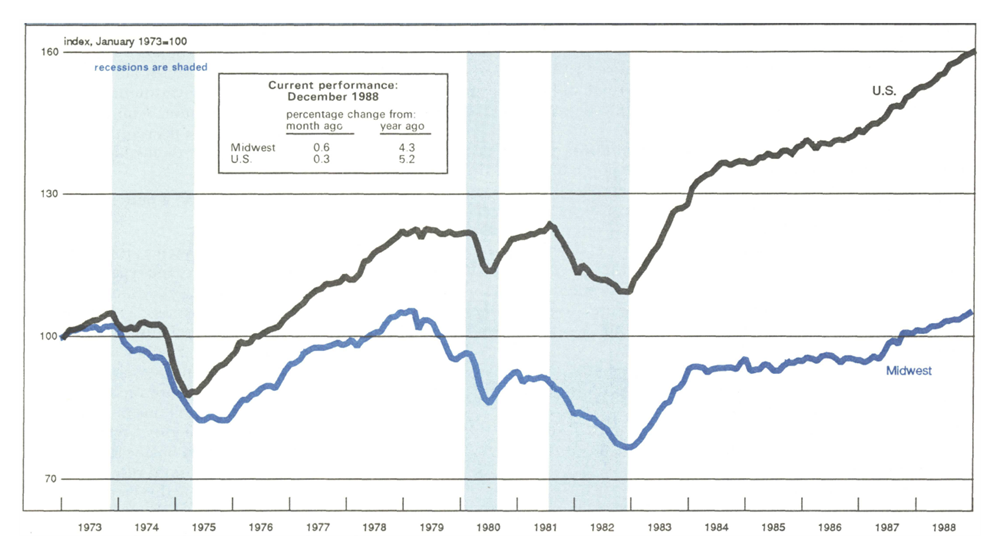
Manufacturing activity in the nation rose 0.3% in December, led by the transportation equipment and petroleum industries. Nonelectrical machinery, after gains early in the year, has been flat for most of the second half of 1988, reflecting softness in the computer and communications equipment industries. Nevertheless, durable-goods production has been advancing at a steady 0.4 % pace since August.
The Midwest economy generated 0.6% growth in manufacturing activity in December. While less dependent on computers and communications equipment than the nation, nonelectrical machinery in the Midwest has also been flat since July. Transportation equipment edged up, but nondurables—particularly food processing and chemicals—accounted for much of the month’s advance.


