The following publication has been lightly reedited for spelling, grammar, and style to provide better searchability and an improved reading experience. No substantive changes impacting the data, analysis, or conclusions have been made. A PDF of the originally published version is available here.
As cliches go, “The economy has changed significantly in recent years” ranks near the top in economics. The irony is that economic models—the formal ones that academics use or the rules of thumb that traders and businessmen employ—are almost always based on the premise that nothing has changed.
The problem is that history is all we have to build empirical models. There are no data on the future. So, examining how the economy has changed is the best—and only—way to try to discover how the economy’s behavior may change in the future. Put another way, understanding how the economy has changed can provide insights into how conventional wisdom will probably be wrong.
The good news
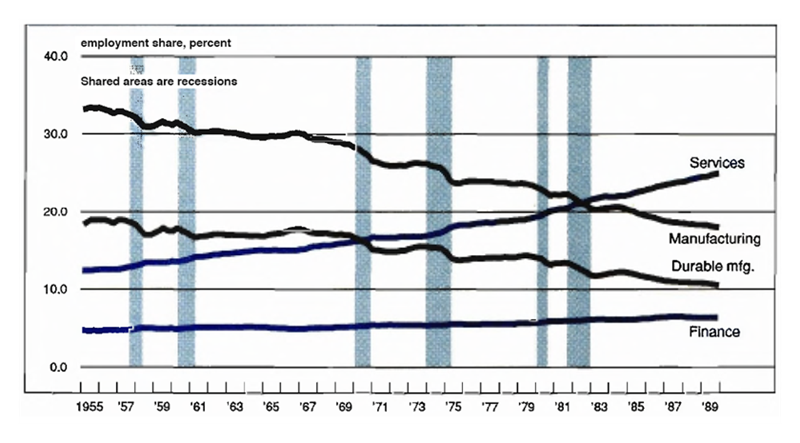
The U.S. labor market, for example, has changed dramatically in the last 35 years. As figure 1 shows, the percentage of the labor force that is employed in durable-goods manufacturing has declined significantly. In 1955 employment in durable-goods industries was 9.5 million workers, 19% of the total workforce. Today, the number is 11.5 million, but this is only 11% of the total workforce.
Figure 1. In jobs, manufacturing is down, services up…

Why is this important? As figure 1 also shows, durable-goods manufacturing is where the big swings in employment usually happen during recessions. Other industries do not experience such changes.
The industries that have picked up the slack left by the decline in durable-goods manufacturing employment—services and financial services—are not as sensitive to aggregate business fluctuations, that is, they are less cyclical. In fact, services seem to display a profound disinterest in the rest of the economy, growing steadily recession or not. These sectors combined now account for 33.7 million workers, nearly 31% of the workforce, up from 8.5 million workers and 17% of the workforce in 1955.
It is easy to underestimate the importance of these changes. With a smaller share of the workforce employed in cyclical industries, recessions should have less impact on employment. This means that personal income and unemployment will be less affected. This, in turn, reduces the impact of a recession on personal consumption.
Clearly, someone who is still employed will spend more than someone who is not, but the effects go much further than that. Spending can fall because people are worried about losing their jobs, but people in less cyclical industries will worry less. This means that across large numbers of people, spending levels will be maintained at higher levels than in previous periods of economic uncertainty. This is probably part of the explanation of why the 1987 October stock market crash had so little effect on overall spending. The scare factor had less bite than most analysts thought.
This relative increase in job security, occurring over the last 35 years, may also help explain why saving rates have fallen. If you are less worried about a rainy day, you will save less for it. This is reinforced by the fact that service workers tend to suffer fewer bouts of extended unemployment than durable-goods workers. Service organizations do not usually generate the extended bouts of unemployment that the closing of a steel mill or an automobile plant can engender.
These changes have been reinforced by a number of other changes in the U.S. labor market. The increase in the number of two-income families is a good example. Two-earner families have a more secure income stream. If one earner is unemployed, the family still has one income left plus unemployment insurance. As a result, faced with the same level of overall economic uncertainty, they would save less and maintain spending at higher levels than a single-income family. All these changes mean that spending is likely to be significantly less volatile in response to a given recessionary impulse than in the past. And, if this is true, then recessions will be smaller. Such smaller recessions will then feed back into and reinforce the effects described above.
There have also been some changes in the way businesses behave that will have some beneficial effects on the business cycle—two, in particular. First is the increasing use of part-time and contract workers to meet swing needs. These workers are better prepared for disruption in employment and as a result are better able to adjust to temporary unemployment. Business, on the other hand, feels less need to keep these workers employed when demand falls. This makes it easier to keep inventories in line—a second benefit.
Indeed, it is in the handling of inventories that business has made the biggest changes, in terms of how future business cycles may look. Computers have not always produced the expected gains in productivity; however, almost no one disputes the tremendous strides that they have made possible in inventory control.
“Just in time” has become a kind of business mantra. Inventories as a percent of sales have been remarkably stable during this business cycle, especially if autos are excluded. This closer management of inventories has some very positive consequences for the business cycle. If inventories are lean, then downturns, to the extent they still occur, are likely to be much smaller and shorter.
Historically, much of the dislocation caused by cyclical fluctuations in the economy has been generated by sales shortfalls without accompanying slowdowns in production. Large inventories of both finished and raw materials built up quickly. This, in turn, caused orders to fall dramatically, all at once. As a result, widespread disruptions in the production process followed. Today, production responds much more quickly and smoothly to falling demand. Less inventory builds up. What does, can be worked off more quickly. As a result, order and secondary production impacts are smaller.
The maybe good news
However, before the business cycle is given the last rites, a number of other factors need to be looked at. Personal consumption makes up 66% of GNP, but it has always been the most stable segment. A lot of the business cycle “action” takes place in business investment. Here, things have also changed, but the impact of these changes is less clear. From the standpoint of GNP, there has been some change in the structure of the economy away from cyclical sectors, but it has been modest relative to the changes in shares of employment.
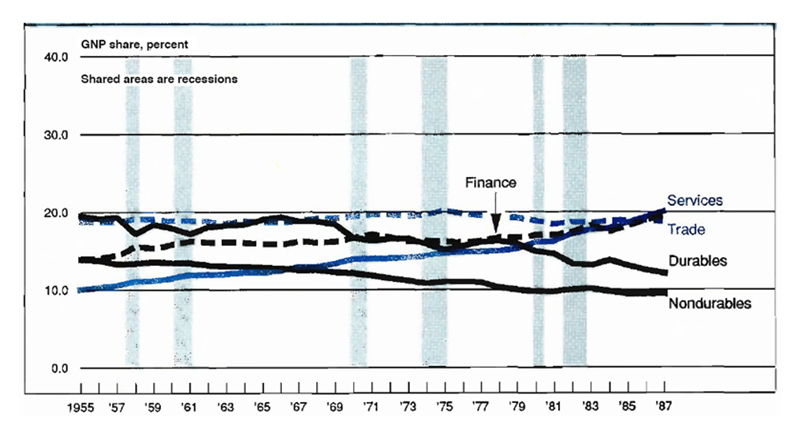
Figure 2 shows the relative share in nominal GNP of various sectors of the U.S. economy using the same scale as figure 1. Far less change is evident here than in figure 1.
Figure 2. But the change is less severe, measured by output

The basic difference between the employment view and the production view is that the manufacturing sector, in general, and durable manufacturing, in particular, have experienced solid improvements in labor productivity, improvement not experienced by other sectors.
The importance of this is difficult to evaluate. If something causes the cyclical industries to reduce output, it will have approximately the same primary effects on aggregate investment and other business expenditures that such events have had in the past. But the employment and inventory data seem to suggest that the secondary effects will be smaller. Thus, the sum impact on the aggregate economy will hinge on the relative size of the primary and secondary effects. On net, smaller and shorter fluctuations seem likely.
More disturbing is that the distribution of investment expenditures has not changed at all across industries. Table 1 shows the breakdown on investment by industry and by type of goods purchased. The “Who buys” columns show almost no change over this period, indicating that investment may not be any less cyclical today than in the past, except to the extent that the changes discussed above create more stable demand during downturns.
Table 1. Who buys what
| Who buys (Plant and equipment expenditures, percent of total by industry) |
||
|---|---|---|
| 1970 | 1988 | |
| Manufacturing | ||
| Durable goods | 20 | 18 |
| Nondurable goods | 20 | 20 |
| Nonmanufacturing | ||
| Mining | 2 | 3 |
| Transportation | 8 | 5 |
| Public utilities | 16 | 11 |
| Commercial | 33 | 43 |
| What (Private purchases of producer durable equipment, percent of total purchases) |
||
| 1970 | 1988 | |
| Equipment type | ||
| Informational | 21 | 32 |
| Industrial | 30 | 23 |
| Transportation | 24 | 21 |
| Other | 24 | 22 |
Thus, while consumer-based industries may be more insulated from aggregate business fluctuations than in the past, investment-goods industries may be just as vulnerable to recessions as in the past. Perhaps even more so, because the dampening elsewhere will make recessions look smaller overall, without necessarily diminishing their impact on the investment-goods industries.
Another interesting fact is contained in the table. Examination of the “What” columns indicate that while who is doing the purchasing has not changed, a greater proportion of investment money is now being spent on computers and telecommunications equipment. The full implications of this are not clear. Much of the past data on the computer and telecommunications industries are from periods when these items were being purchased as part of first-time modernization programs. Today, a much larger percentage of purchases are for upgrades of existing equipment. Upgrades and replacements are more easily postponed and thus subject to greater cyclical pressures. Thus, it may be that the high-tech sectors will displace autos and steel as the cyclical industries of the 1990s.
The bad news
Perhaps the greatest changes in the last decade have taken place in the financial markets. The cyclical implications will not be known for decades. Yet one change stands out—the tremendous increase in corporate debt. This is a new and very big question mark for the economy as a whole. The financial markets are now more exposed to the risk of corporate default on obligations. Equally important, businesses stand more exposed to the vagaries of the financial markets.
In light of recent research done at this Bank and elsewhere reaffirming the importance of internal sources of funds for investment, this increased exposure of industry to the financial markets means that while many events may have less impact on the aggregate economy now than in the past, events in the financial markets may be far more important.
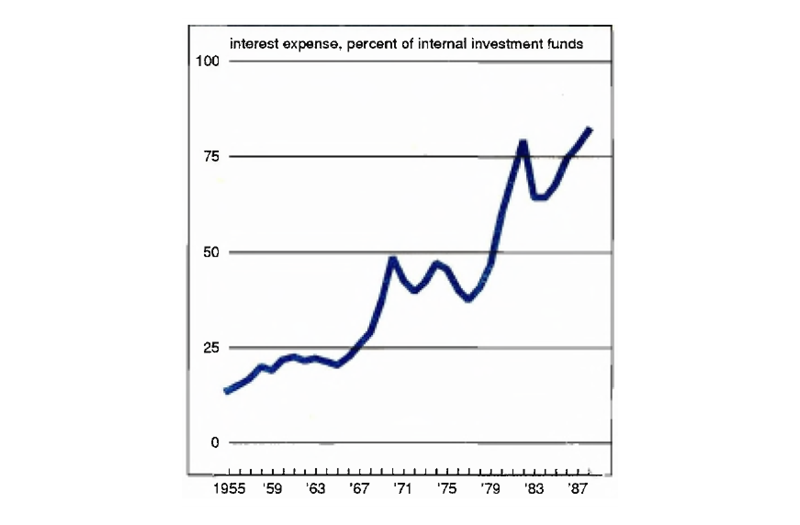
Figure 3 shows interest expense as a percent of internal funds available for investment since 1955. In that year interest-rate expense equaled 14% of internal funds. Thus, a doubling of interest-rate expense would absorb 14% of internal funds, leaving the firm still able to pursue 86% of the investment activity funded internally. Today, interest-rate expense equals 82% of internal funds available for investment. If funding costs doubled, an 82% cut in internally funded investment would be needed.
Figure 3. Corporate debt burden zooms

Conclusions
Changes in the structure of the economy indicate that consumer-led sectors will probably be less sensitive to business fluctuations than in the past, while investment-goods industries may face little change. This combination may create a situation whereby some measures, such as unemployment or consumption, the economy appears reasonably robust, while investment sectors may feel a recession. In fact, some have suggested that this is exactly the situation the U.S. economy is in today. Further, increased corporate exposure to financial markets make disruptions in the corporate debt market far more important than in the past.
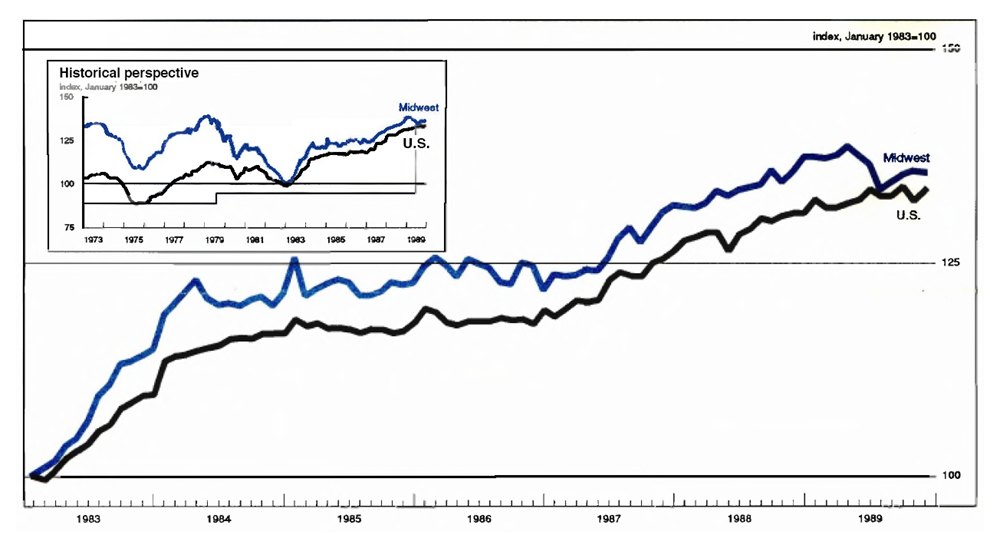
MMI-Midwest Manufacturing Index: Current expansion

Manufacturing activity in the Midwest flattened in October and November, after rallying from a mid-year low. Off a slight 0.1% from October, the November MMI was 1.5% above its most recent low point in July. Transportation equipment (autos) and primary metals (steel), both about 2% below their mid-year levels, continued to be a source of weakness, as auto producers struggled to reduce inventories. Most other durable-goods industries were up in November.
While the Midwest followed a pattern similar to the nation, manufacturing activity nationwide was up a full percentage point in November. The relative weakness of the Midwest reflects in part the importance of auto production.


