

The following publication has been lightly reedited for spelling, grammar, and style to provide better searchability and an improved reading experience. No substantive changes impacting the data, analysis, or conclusions have been made. A PDF of the originally published version is available here.
The process of transferring saving and borrowing activities from banks to nonbanks is known as disintermediation. Historically, bank disintermediation has occurred whenever bank borrowers or savers could get a better deal from nonbank alternatives. Today, bank disintermediation is being driven by increasing deposit insurance premiums, the high cost of raising bank capital, and—in a few instances—an inability to raise capital. As a response to these pressures, banks are initiating disintermediation, shrinking both to control risk and to remain in compliance with regulatory requirements.
This Chicago Fed Letter discusses two recent developments in the disintermediation of banks’ commercial and industrial (C&I) loans: loan sales to prime rate mutual funds and the securitization of commercial loans. If these substitutes for bank intermediation become successful, they will only serve to accelerate the ongoing decline in the importance of the banking industry.
The past as prologue
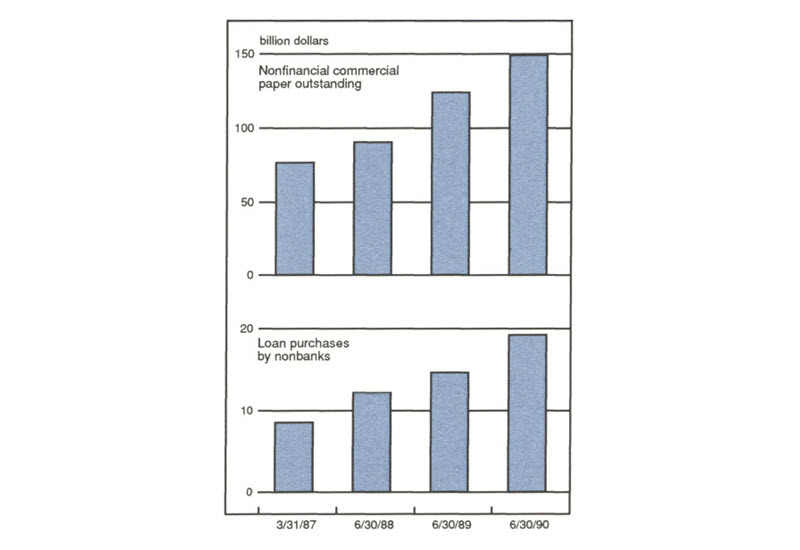
Bank borrowers, especially investment grade corporations, have sought to lower borrowing costs by increasingly financing their activities through nonbank alternatives, most notably the commercial paper market. Nonfinancial commercial paper issuance has increased by 80% over the past five years and by almost 30% in the first ten months of 1990 alone.
Since their introduction in 1972, money market mutual funds (MMMFs) have facilitated disintermediation by making it possible for savers to indirectly purchase small pieces of a large pool of high denomination money market instruments—like commercial paper. This nonbank alternative has increased the return on savers’ funds. In 1980, MMMFs held $77 billion in assets, 3.5% of total bank and thrift deposits. Today, MMMFs hold $415 billion in assets, roughly 9.5% of total bank and thrift deposits.
Developing pressures
Disintermediation continued throughout the 1980s as longer-term and non-investment-grade borrowers began to bypass banks, directly raising funds in the capital markets. In order to offer customers a lower funding cost, banks have increasingly sold C&I loans to investors outside the banking system thereby avoiding mandatory capital requirements, reserve requirements, and deposit insurance premiums. While an interbank loan sales market has been in existence for many decades, the sale of bank loans to nonbanks is a relatively new phenomenon (see figure 1). Nonbank C&I loan purchases from commercial banks rose to $19 billion in 1990 as compared with $9 billion in 1987 and only $.7 billion in 1985. The 1990 nonbank loan purchases represent almost 6% of commercial loans held by large U.S. banks and almost 25% of total secondary market commercial loan sales.
1. Borrowers bypassing banks
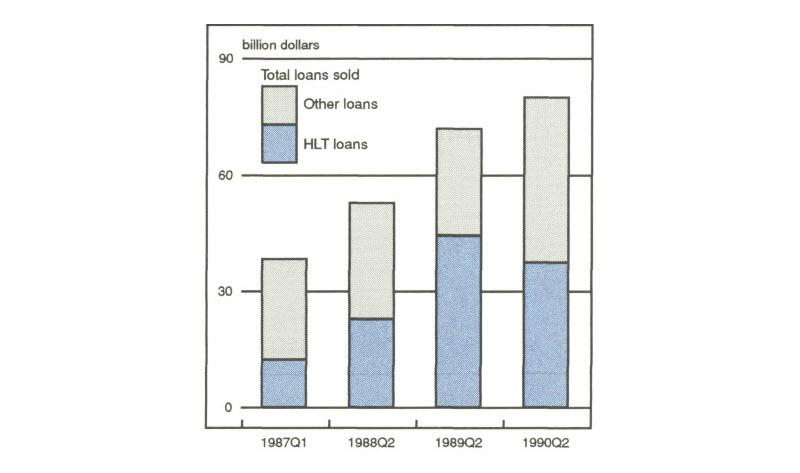
A substantial portion of these loans were used to fund mergers, acquisitions, leveraged buyouts, and recapitalizations, so-called highly leveraged transactions (HLTs). The dominance of these HLT loan sales reflects banks’ efforts to manage their balance sheet risks. During 1990, declines by approximately one-half the dollar value of leveraged buyouts and recapitalizations reduced banks’ HLT lending. With this decline in HLT activity, the pressure to sell additional loans would have been expected to decrease. However, stresses on the banking industry in the last year have resulted in continued pressure for banks to sell loans to nonbank investors (see figure 2).
2. Total loans sold
Anticipated losses on loans are eroding the banking industry’s capital position. As a consequence, loan loss reserves have been soaring and the average stock price of the 225 largest publicly traded banks has declined by almost 30% since the beginning of this year. Declining capital causes banks to grow more slowly than otherwise would be the case.
Rising deposit insurance premiums are generating additional pressure. In 1991, the FDIC insurance premium will increase from $0.12 per $100 of domestic deposits to $0.195, more than a 60% increase. However, the Congressional Budget Office estimates that a $.43 premium—more than double the 1991 premium—is needed for the fund to meet the mandated funding requirement in 1995. These higher premiums increase banks’ expenses, raising bank funding costs.
New mutual funds promote loan sales
The continuing pressure to move loans off banks’ balance sheets is causing financial markets to develop new vehicles for pooling and selling these loans. As purchasers of one-third of commercial paper issued, MMMFs provide a lower cost alternative to bank lending. New mutual funds known as retail prime rate funds and privately placed institutional loan funds may play a similar role in the loan sales market. These funds allow investors to purchase shares in a diversified pool of bank loans. The retail funds are called prime rate funds because their goal is to offer purchasers a return that is equal to or in excess of the prime rate banks charge to their most creditworthy customers.
The five retail prime rate funds currently hold $7 billion in loans and are expected to surpass $10 billion by 1992. The two privately placed institutional loan funds are intended for large institutional investors and account for at least another $1 billion in loans. Industry analysts estimate this type of fund may surpass the retail funds in a few years.
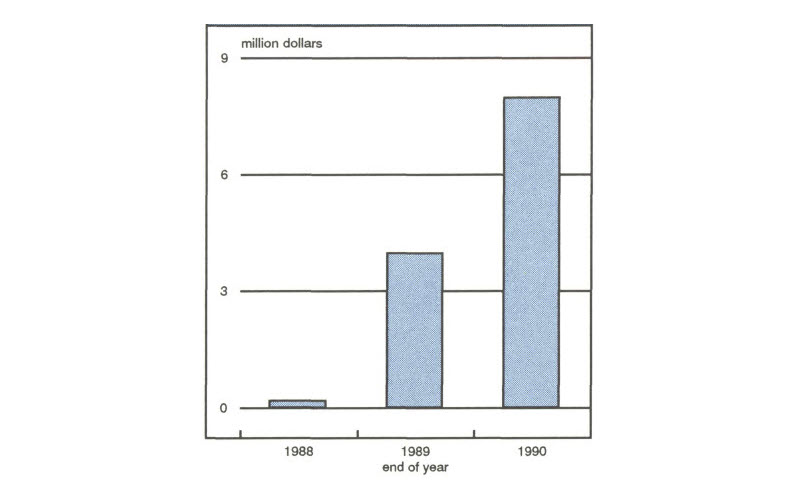
More than 80% of the prime rate and institutional funds balances are invested in HLT loans. The funds’ $8 billion in loans (see figure 3) represent almost one-quarter of midyear HLT loans sold by money center banks in 1990. The funds have purchased loans only with senior, collateralized features. With loans senior in the borrowers’ capital structures, much of the potential credit risk is borne by other creditors. Collateral requirements provide additional protection against declines in the value of the borrowers’ assets. The funds purchase these loans under three legal arrangements: primary market syndications, secondary market assignments, or secondary market participations. Most of the loans are purchased as secondary market participations. In contrast to the other legal arrangements, the contractual counterparty to a secondary market participant is the loan seller, not the underlying borrower. This requires that fund managers evaluate the credit risk of the loan seller in addition to the borrower when purchasing a loan.
3. Growth in new mutual funds
Prime rate funds: Is the price right?
The prime rate funds are registered under the Investment Company Act of 1940 as closed-end investment management companies. However, prime rate funds vary somewhat from the typical closed-end fund. In general, closed-end funds do not issue new shares after the initial share subscription period. Closed-end fund shareholders generally obtain liquidity by selling shares to others. In contrast, the prime rate fund shares are offered on a continual basis by the funds. Further, since the secondary market for most prime rate fund shares is thin or nonexistent, liquidity is supplied by unguaranteed quarterly tender offers.
Determining the appropriate price for the shares is a complex exercise. For example, when making a tender offer, the prime rate fund announces the price it will pay per share in addition to the total number of shares to be redeemed. Too high a price will benefit those who tender shares to the detriment of those who do not tender shares. Too low a price will reduce the funds’ ability to attract investors for whom liquidity is important. Because most of the loans held by the funds trade infrequently, it can be difficult for fund managers to determine the “right” price for marking the portfolio to market on a daily basis. Consequently, fund managers may have considerable discretion in determining the share price. Currently, the prime rate funds value loans on a daily basis using: (1) the loan par amount, (2) a risk-adjusted credit value, or (3) secondary loan market quotes.
Two of the prime rate funds value loans at par. The remaining prime rate funds employ some form of mark-to-market pricing, but there are inconsistencies even among funds that attempt to mark-to-market. For example, one fund recently experienced a loan default, reducing the reported value of the loan from 95% to 75% of the loan’s par amount. The latter price more accurately reflects the deteriorated credit status of the loan, but even that valuation could be overstated. In two other cases, loans are being carried at par even though the secondary market price is at 60% of par in one case and 75% of par in another. However, this loan valuation dilemma is not isolated to the funds themselves but is an issue for the entire C&I loan industry.
The new securitization frontier: C&I loans
The other development that has encouraged disintermediation is the securitization of bank C&I loans. As of November 1990, over $2 billion of HLT loans have been securitized. Securitization is the process of pooling and repackaging assets as security instruments and has already facilitated the disintermediation of consumer assets, such as credit card receivables and auto loans. Securitization makes the credit risk of the assets easier to evaluate by separating the assets and their associated credit risk from those of the originating bank. Securitization can also be used to repackage cash flows into low-risk and high-risk securities. This alleviates the asymmetry of information between the originator and less-informed investor, and thereby attracts new investor classes.
Securitized pools of HLT loans are much like securitized pools of high yield debt, known as collateralized bond obligations (CBOs). First issued in 1988, CBOs in turn, mimic collateralized mortgage obligations (CMOs). CBOs pool and repackage the cash flows generated by high yield bonds to create new securities, partitioned as classes, called tranches, with different risk characteristics. The first tranche is structured for an investment grade rating, while the subordinated, lower rated tranches pay higher interest rates for bearing the risk of first loss. Often, the CBO capital structure includes an equity tranche, which is sometimes retained by the issuer.
The first attempt to securitize C&I loans occurred in December 1988 when Continental Bank securitized $140 million of HLT loans from 25 borrowers as “floating-rate enhanced debt securities” (FRENDS). Imitating the CBO structure, the issue was divided into senior and subordinated tranches. FRENDS I was followed by FRENDS II, a $380 million pool issued in September 1989.
Subsequent securitizations have varied somewhat from the Continental FRENDS issues. These variations represent issuers’ efforts to package the most attractive security offering to new investor classes. For instance, as with the prime rate funds, liquidity is a major consideration in investors’ decisions to purchase securitized C&I loans. In December 1989, a $625 million Banque Nationale de Paris HLT loan securitization addressed this concern by listing the issue on the Luxembourg Stock Exchange, providing an organized secondary market for investors seeking liquidity.
An even more recent innovation by Salomon Brothers suggests an important yet more limited role for securitization in the commercial loan market. Unlike conventional securitization structures, this proposal will create a security backed by a portion of a single loan and will have a single tranche. The chief goal of this structure is to tap institutional customers—that is, most money and portfolio managers—that are allowed to buy securities but are not permitted to buy bank loans.
The future role of securitization in the commercial loan market is not yet clear. While the idea of securitizing C&I loans is appealing, it has proven to be a complex and time-consuming process that has not been widely imitated. In contrast to the more evolutionary approach witnessed in other asset-backed markets, C&I loan securitizers have attempted to jump directly to the relatively sophisticated multi-tranche structures employed for mortgages, credit cards, auto loans, and high yield debt. Whether the commercial loan market can bypass the evolutionary stages of its predecessors is an open question.
Conclusion
Prior to 1985, the disintermediation of commercial lending was something that happened to banks. However, in the last half of the 1980s, the escalating pressure to disintermediate bank credit has led banks to promote disintermediation by selling commercial loans to nonbank purchasers. Prime rate funds and the bank-sponsored securitization of bank C&I loans are the two newest manifestations of this phenomenon.
This controlled disintermediation meets banks’ needs to preserve profitable customer relationships. Nevertheless, the reprieve may be only temporary. The standardization of commercial loan contracts and increasing expertise in pricing bank loans are both necessary to facilitate this managed disintermediation. However, these changes will ultimately lead to greater competition in the underwriting of commercial loans and reduce the profitability of the very relationships banks are struggling to preserve.
MMI—Midwest Manufacturing Index
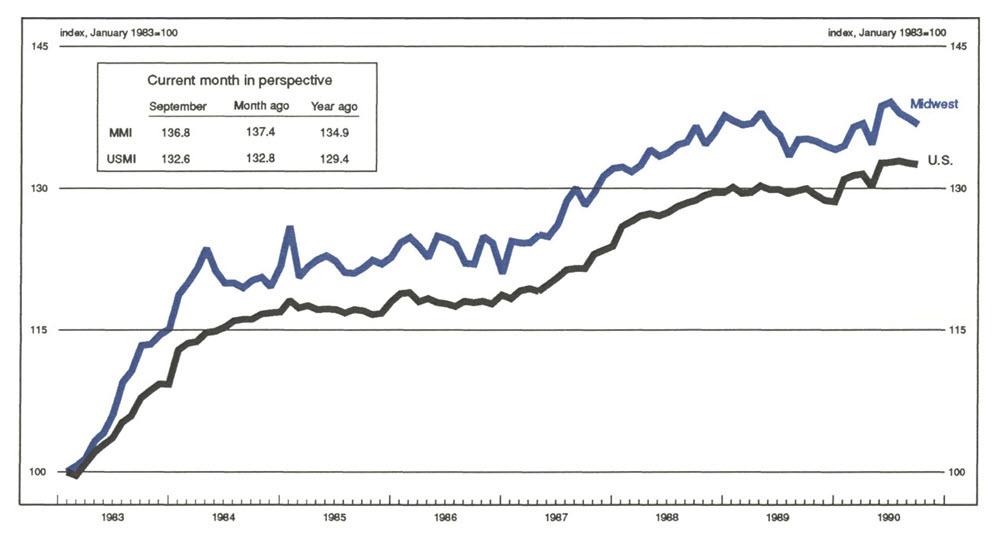
Manufacturing activity in the Midwest experienced its third consecutive monthly decline in September, according to the most recent MMI. The decline was widespread; only food-processing and chemically related industries expanded. With fourth quarter auto production being cut back, downward pressure on manufacturing activity is likely to continue.
Midwest manufacturing activity (down 0.4%) declined more than the nation (down 0.1%) in September and began its decline one month before the nation. Much of the region’s relative weakness in September was centered in employment. However, over the last three months manufacturing employment has been fairly flat, compared to steady declines nationally.


