

The following publication has been lightly reedited for spelling, grammar, and style to provide better searchability and an improved reading experience. No substantive changes impacting the data, analysis, or conclusions have been made. A PDF of the originally published version is available here.
On June 2, the Federal Reserve Bank of Chicago held its second annual Auto Outlook Symposium. This year’s program reassessed the health of the auto expansion. The recent sluggishness of auto sales dominated the program and led to discussions of short-term and long-term influences on sales. Expectations persisted of a rebound in sales from current weak levels, and the general tone of the meeting was cautiously optimistic.
With car sales particularly slow even after a boost in incentives, some symposium participants expressed concern that the auto expansion is not simply idling but has stalled. This Fed Letter reviews the discussions at the symposium and recent developments in the motor vehicle industry. Analysis suggests that several factors account for the sluggishness in the auto market over the last four months. These include rising interest rates, the shift to used cars, and special one-time disruptions such as delayed income tax refunds. The question for the industry over the next year is how vehicle sales will be affected by the interplay between factors constraining sales and factors that should boost sales.
Sales have been disappointing
Vehicle sales since the end of 1994 have been disappointing by almost any measure. On a seasonally adjusted annualized basis, sales through the first five months averaged an anemic 14.7 million units, down 700,000 units from 1994:Q4, and down 1 million units from the first five months of 1994. In April, sales hit a near-recessionary annualized rate of 13.9 million units, triggering widespread concern that sales had not just temporarily declined, but may actually be on a downward trend leading the economy into a recession. The primary source of the recent weakness is in passenger cars, where the seasonally adjusted annualized sales rate for the first five months of this year was 8.6 million units compared with 9 million in 1994:Q4. Moreover, despite aggressive incentives, passenger car sales were down 6% compared with the first five months of 1994. Luxury car sales declined more than 15% through the first five months. Small car sales were down more than 20%, with some models falling more than 25%. Indeed, the only bright spots in passenger cars were a few models such as the Chevrolet Lumina, or more recently, cars with high rebates such as the Dodge Neon, Ford Taurus, and Toyota Camry.
Although light truck sales have weakened from fourth-quarter levels, they have held up better than passenger car sales. The seasonally adjusted annualized sales rate for light trucks was approximately 5.8 million units for the first five months. This pace was down from the blistering 6.5 million units in the fourth quarter, but comparable as a whole to 1994. One continuing area of strength is the sports/utility market; the revamped Ford Explorer and Chevy Blazer have been selling extremely well, partly at the expense of Chrysler’s Jeep Grand Cherokee.
Total vehicle sales for the year to date are well below the expectations of most industry observers. For example, the Big Three forecast of 1995 light vehicle sales at the beginning of this year ranged from 15.4 million to 16.1 million units. Even the most cautious forecast of 15.4 million units, made by participants at last year’s auto symposium, now appears much too optimistic. Not surprisingly, given sales to date, this year’s symposium participants reduced their forecasts substantially for 1995 and 1996. The consensus forecast for 1995 is now 14.9 million light vehicles, with sales expected to hold steady in 1996 (see figure 1).
1. Car and light truck sales
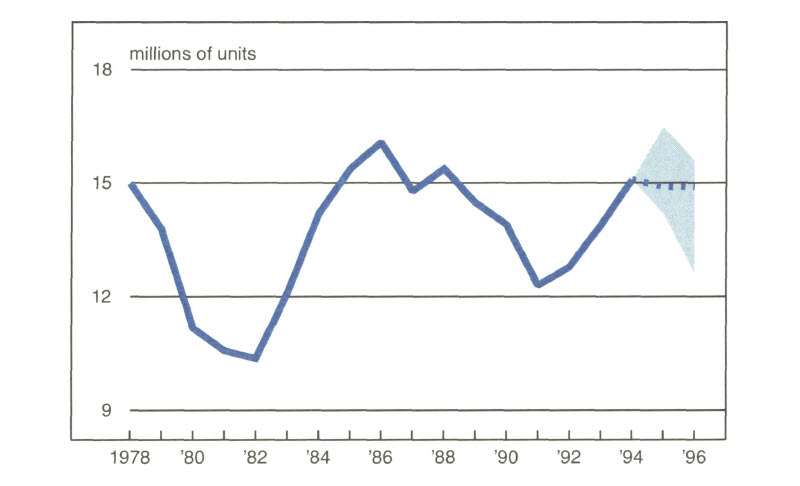
Source: Bureau of Economic Analysis, electronic database, 1995, and symposium participants.
Explaining the slippage
As vehicle sales have slumped more than expected, industry participants and observers have struggled to explain the weakness. It seems especially odd since most economic indicators—especially income growth—have remained generally favorable.
Declines in total employment over the last few months may be the first hint that macroeconomic conditions have deteriorated and are hindering vehicle sales. Yet evidence of substantial economic sluggishness is spotty, and the evidence from the national economy seems to confirm a soft landing.
The key question in the current situation is why sales are running 500,000 or more units below the seemingly reasonable forecast of 15 million to 15.5 million units, especially given the relative health of the economy. Participants noted many factors that account for this drop-off in sales. Special one-time disruptions that had an impact included higher tax payments, delayed refunds, and reduced fleet sales. Tax payments in April were up $20 billion from year-ago levels, possibly causing a substantial drag on consumer spending. When the IRS fell behind in issuing tax refunds, many consumers delayed vehicle purchases until they had the refund in hand to make a down payment. Additionally, fleet sales have declined since 1994:Q4, especially in April 1995, when both fleet and total sales fell dramatically. This reduction in fleet sales (approximately 35,000 vehicles) from expected levels was caused in large measure by a concerted effort of manufacturers to shift sales away from April until later in the year.
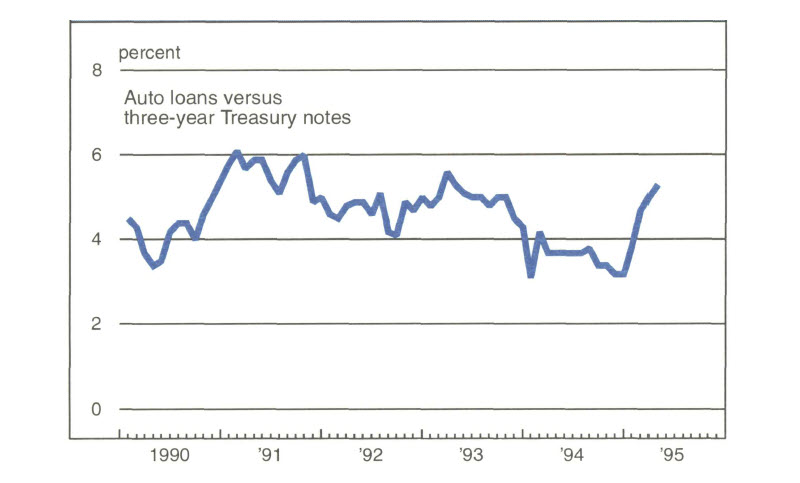
In the search for more fundamental explanations for the sluggishness, attention has also shifted to the impact of higher interest rates. Auto loan interest rates have increased 200 basis points since the beginning of the fourth quarter and have remained at these levels. These rates have increased far more rapidly than rates on instruments of comparable maturities. For example, rates offered by auto finance companies have increased at twice the pace of the three-year Treasury note rate. After declining during much of 1994, the spread between the interest rates on auto loans and on the three-year Treasury note has increased by over 2 percentage points since the end of the year (see figure 2).
2. Interest rate spread
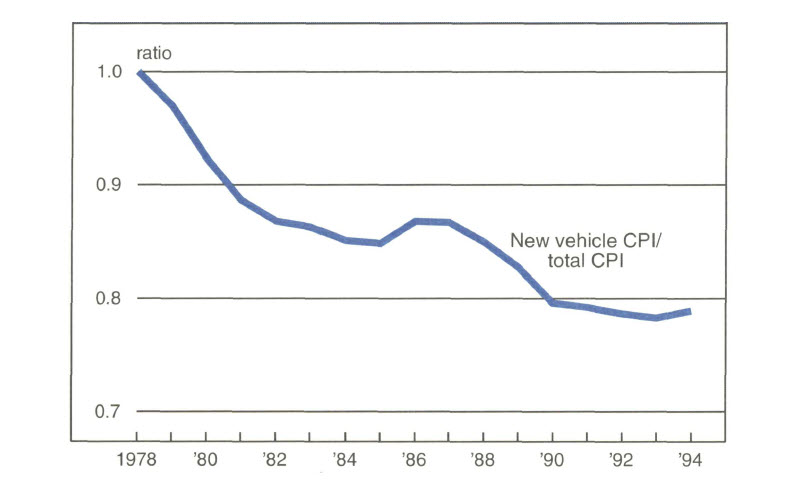
Higher interest rates have had a significant impact on the affordability of vehicles. For example, the average monthly payment for a new vehicle has increased by approximately $40 over the past year, an increase of 14%. Most of this increase stems from the rise in interest rates. Monthly payments are currently at almost 25% of per capita disposable income, up from less than 23% at the beginning of the year and to a level that has not been reached since the mid-l980s. As several participants pointed out, new vehicle prices have increased at a pace consistent with prices in the economy as a whole, a marked difference from past expansions (see figure 3).
3. Ratio of Consumer Price Indexes
In addition, the increase in monthly payments may be the reason for the continuing shift toward used vehicles. Used vehicle purchases have been increasing on both an expenditure and a volume basis since 1988. On a seasonally adjusted annualized basis, used vehicle sales surged to almost 17 million units in the first quarter, up from 16.5 million in the fourth quarter. This matches virtually one-for-one the falloff in new vehicle sales during the same period. In other words, total vehicle sales (new and used) were flat from the fourth quarter sales pace—not down, as new vehicle sales alone would suggest.
The shift toward used vehicles may have also been accelerated by the surge in the number of higher-quality used vehicles entering the market from lease programs in the fourth quarter. These vehicles may be prompting buyers to move upstream in vehicle models. For instance, recent surveys suggest that used midsize cars are close substitutes for new compact vehicles. Similarly, high-quality used large or luxury cars are becoming a substitute for new midsize cars. One challenge for the industry will be the continuing interplay between new vehicle and high-quality used vehicle sales over the next few years, as the increasing number of leased cars reach the used vehicle market.
Beyond the near term
Even accounting for the impact of higher auto loan rates and the drag from higher tax payments, sales in the industry remain subpar compared with past expansions. Vehicle sales below 15 million units seem inconsistent with income growth and with most projections of pent-up demand since the expansion began in 1991. Consequently, one must look beyond short-term influences to explain the current sales sluggishness.
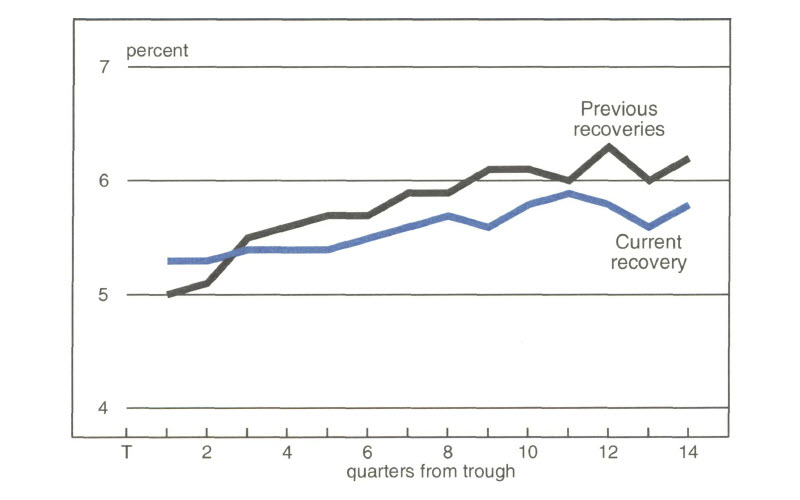
One issue discussed at the conference was the view that vehicles were “oversold” in the late 1980s, constraining sales in the current expansion. Assuming a trend sales growth rate of approximately 0.5%, purchases during the expansion of the 1980s were almost 8 million units above trend. They were also between 1 million and 1.5 million units above the projected level of pent-up demand during the early 1980s. The overselling of autos through aggressive incentives is also supported by expenditure data for the industry. Auto expenditures as a percentage of total consumer expenditures were extremely strong in the late 1980s.1 Not surprisingly, auto expenditures in the early 1990s have been below expected levels (see figure 4).
4. Motor vehicle share of consumer expenditures
Important changes have also been occurring in the market for vehicles. The propensity to purchase new vehicles declined dramatically over the last 20 years. In the early 1970s the ratio of new vehicle purchases per household was 18.5%; in the early 1990s it was about 14%. There was a similar reduction in the number of vehicles purchased annually by people over the age of 18.
Part of this change in behavior is due to the lengthening of the useful life of vehicles. The vehicle scrappage rate has declined over the last decade, especially among middle-aged vehicles, six to eight years old. Product quality improvements over the last few years should further lower the scrappage rate and, therefore, reduce vehicle purchases.
The most controversial issue raised at the conference was vehicle affordability. By standard measures, such as number of weeks of family income needed to buy a vehicle, affordability appears to have deteriorated substantially over the last 20 years. However, some observers question the accuracy of vehicle price measures as computed by government statistical agencies. Industry measures suggest a more favorable relationship between vehicle prices and income levels.
Bounce-back? Yes, but limited
The auto industry has already begun to deal with many of the factors causing sluggish vehicle sales. To counter the decline in affordability, the industry has begun to implement discount financing terms and increased rebates. These should help lower the relative price of new vehicles compared with used vehicles. For example, an increase in rebates of $500 per vehicle would reduce monthly payments to the level of mid-1994. A rebate of $1,050 would bring payments back to the level of the first quarter of last year. Although rebates of this size are not likely in the near term, discounts are likely and will represent an important offset for the consumer.2
Many challenges on the horizon will continue to affect the auto industry. These include extended durability of autos, continued pressure from new vehicle substitutes, and pricing and affordability concerns.
Tracking Midwest manufacturing activity
Manufacturing output indexes (1987=100)
| May | Month ago | Year ago | |
| MMI | 139.1 | 138.9 | 132.0 |
| IP | 123.0 | 123.3 | 119.0 |
Motor vehicle production (millions, seasonally adj. annual rate)
| May | Month ago | Year ago | |
| Autos | 6.1 | 6.5 | 6.2 |
| Light trucks | 5.4 | 4.9 | 5.1 |
Purchasing managers’ surveys: net % reporting production growth
| June | Month ago | Year ago | |
| MW | 53.9 | 54.2 | 73.1 |
| U.S. | 44.8 | 48.5 | 60.3 |
Manufacturing output indexes, 1987=100
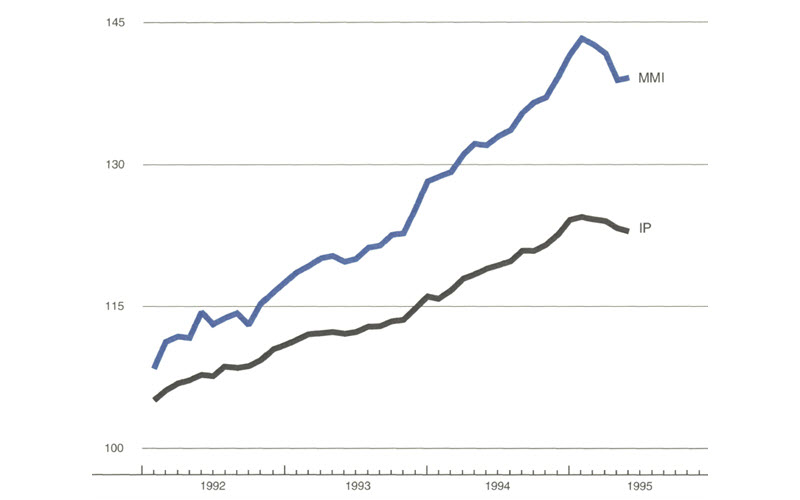
Sources: The Midwest Manufacturing Index (MMI) is a composite index of 15 industries, based on monthly hours worked and kilowatt hours. IP represents the Federal Reserve Board industrial production index for the U.S. manufacturing sector. Autos and light trucks are measured in annualized units, using seasonal adjustments developed by the Board. The purchasing managers’ survey data for the Midwest are weighted averages of the seasonally adjusted production components from the Chicago, Detroit, and Milwaukee Purchasing Managers’ Association surveys, with assistance from Bishop Associates, Comerica, and the University of Wisconsin-Milwaukee.
Midwest manufacturing output flattened out in recent months after weakening significantly in the first quarter of 1995, according to the Midwest Manufacturing Index. Much of the weakening in recent months was concentrated in durable goods industries, including transportation equipment and fabricated metals.
Retail sales and housing activity gained greater strength around the country in May and June. This has bolstered retailer and wholesaler confidence with inventory positions as well as District manufacturers’ production plans for the latter half of the year.
Notes
1 Besides the impact of buying ahead through aggressive incentives, it is also important to note that the expansion began with a substantial tax increase. The resulting drag on consumer spending appeared significant in the early stages of the expansion and should be incorporated into the analysis of the behavior of the vehicle expansion.
2 Typically, incentives provide only a temporary boost to sales in the industry, and in some periods involve “buying” future sales today. As discussed above, the current pickup in incentives may not reflect this trend because incentives may be offsetting substantial increases in auto loan rates and the increasing acceptance of used cars as an alternative to new vehicles. Consequently, some improvement in vehicle sales is expected. However, the gains will likely be modest.


