

The following publication has been lightly reedited for spelling, grammar, and style to provide better searchability and an improved reading experience. No substantive changes impacting the data, analysis, or conclusions have been made. A PDF of the originally published version is available here.
The Midwest, referred to as the Rust Belt since the wrenching adjustments of the early 1980s, has recently been performing more like a well-tuned machine than a region in decline.1 Its remarkable turnaround has been widely reported.2 The Midwest economy performed above the national average during the early 1990s recession. This was a remarkable achievement for a region that is dominated by manufacturing and the production of durables, sectors that tend to contract at a faster pace than the national economy during an economic downturn. We see further signs of the region's comeback in an unemployment rate that has been below the national average in each of the past four years—in each of the region's states, as well as in the aggregate; a share of national manufacturing employment that has increased to 18.9% from a low of 16.9% in 1983; a faster rate of GDP growth than the nation's; and a property market that is enjoying a miniboom. What can we point to in explaining these data? And what do these developments tell us about what is in store for the region?
In an effort to understand the underlying forces driving these developments, the Federal Reserve Bank of Chicago is currently performing an extensive analysis of the Midwest economy. This yearlong project involves a series of workshops and research studies, which are being carried out by Federal Reserve analysts and other researchers. An advisory board representing a cross section of Midwest political, business, and research leaders is providing guidance for the project. In the first half of the year, the Bank hosted workshops on metropolitan governance issues, the structure and performance of the Midwest economy, the region's rural economy, and issues in work force development. Meetings on tax, spending, and regulatory influences on regional performance, and global linkages with the region's economy are scheduled for the second half of the year. The findings of these workshops are being communicated through a series of publications and broad public forums. The project is scheduled to conclude with a conference toward the end of 1996. This Fed Letter highlights some of the issues discussed at the second workshop in the series, “The Midwest Economy: Structure and Performance,” held February 13, 1996.3
Favorable fundamentals
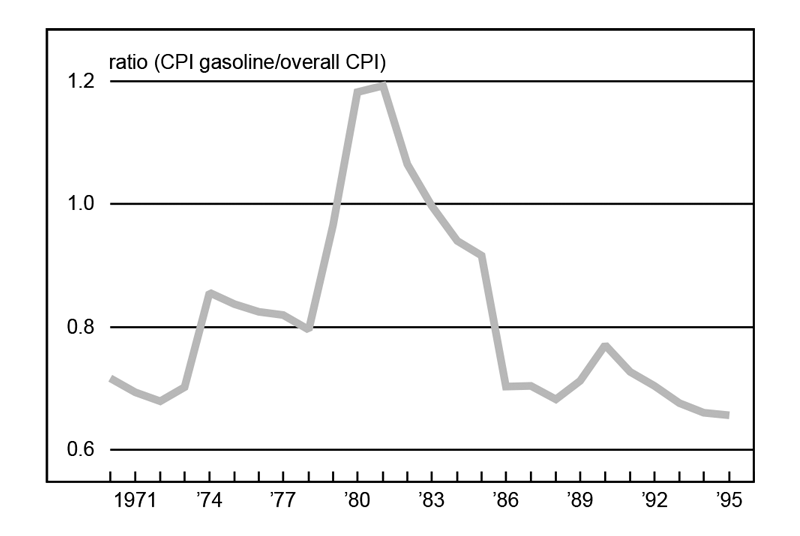
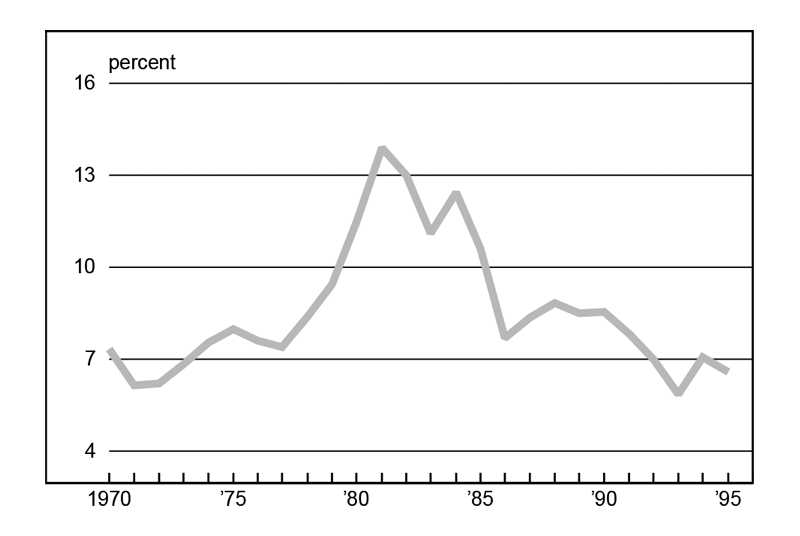
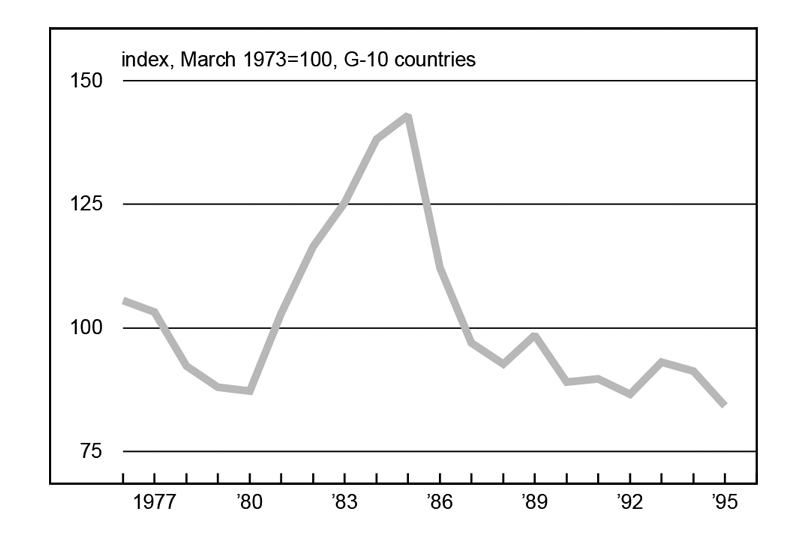
Three external factors have influenced the region's economic fortunes during the last decade: declining real energy prices, important as an input to the region's industries and as a determinant of demand for its products; declining interest rates, stimulating demand for durable goods; and the declining dollar, which has improved the international competitiveness of the region's companies and products (see figures 1, 2, and 3).4 These developments helped establish the region as the fastest-growing exporter of manufactured goods in the country. Research presented by Geoff Hewings at the workshop suggested that the fortunes of the Midwest depend directly on the fortunes of the North American economy and indirectly on developments in Europe and Asia.
1. Real price of gasoline
2. Ten-year Treasury yield
3. Trade-weighted dollar
It is instructive to contrast these favorable fundamentals with the factors that drove national economic growth in the early 1980s: personal tax cuts, Pentagon procurement, and capital gains in financial and real estate markets. None of these developments were favorable to the Midwest. In fact, large federal deficits, high real interest rates, and an overvalued dollar during that period made it more difficult for regional manufacturers to compete.5
Manufacturing productivity
In addition to the favorable external factors cited above, the implementation of best manufacturing practices, often referred to as lean manufacturing, has revitalized Midwest manufacturing. Lean manufacturing refers to a production system that gained widespread attention in the early 1980s. It combines aspects of both craft production, in which skilled labor produced output that was generally very customized, and mass production, where special purpose machinery was substituted for labor to produce identical components in large numbers. The defining principles of lean manufacturing are the pull system, whereby the flow of materials and products through the various stages of production is triggered by the customer (ultimately the end user, or, within a plant, an operation or a process downstream from a previous one), and the idea of continuous improvements to the production process. Implementing that production system works best with emphasis on teamwork on the shop floor, flexible work rules, integration of skills, low inventories of finished goods and work in process, and delegation of quality and quantity objectives to the shop floor.
The auto industry frequently serves as a showcase for the implementation of best manufacturing practices and its effects on competitiveness.6 A recent study by MIT's International Vehicle Program showed how the productivity of auto assembly plants changed between 1989 and 1993/94.7 Apparently, the best North American plants of U.S. auto assemblers have nearly caught up with the best Japanese plants. However, the recent data also show that “best practice” is a moving target; the plants that improved their productivity most were Japanese plants in North America.
How pervasive has been the introduction of best manufacturing practices? Two large-scale studies shed some light on this issue. Both Statistics Canada (in 1988) and the U.S. Census Bureau (1988 and 1993) administered surveys of manufacturing technologies to measure how advanced manufacturing technologies are used in their respective country's manufacturing plants.8 Both surveys found that the adoption of advanced manufacturing technologies has been widespread across plants and industries, typically involving multiple technologies applied per establishment. Larger plants were found to adopt the technologies surveyed more rapidly than smaller plants. Most important for the Midwest, there is no evidence that newer plants are implementing these technologies at a higher rate than older plants (see figure 4 for information on three of the 17 advanced manufacturing technologies surveyed). These results indicate that advanced manufacturing techniques are reshaping manufacturing on a broad scale. In fact, by linking the results of the survey on manufacturing technology to Canadian census data, researchers at Statistics Canada were able to track the technology adoption of specific establishments over time. They found that plants that used advanced manufacturing technology experienced increases in market share (this effect was especially prominent for those plants adopting several combinations of technologies), labor productivity, and wage rates relative to nonusers. Establishments that innovate seem to do better in the marketplace.
4. Application of some advanced technologies
| Flex. mfg. | CAD | Interco. network | |
| (% of plants using) | |||
| Plant Employment | |||
| 20-99 | 7.6 | 49.5 | 12.0 |
| 100-499 | 21.4 | 76.4 | 28.4 |
| 500+ | 40.4 | 87.2 | 47.1 |
| Age of Plant | |||
| Less than 5 years | 13.4 | 63.5 | 15.0 |
| 5-15 | 13.3 | 62.0 | 18.0 |
| 16-30 | 13.4 | 64.4 | 20.5 |
| Greater than 30 | 15.2 | 63.1 | 22.0 |
Source: U.S. Department of Commerce, Bureau of the Census, Current industrial reports, No. 6, 1993, tables 4D and 4E.
Such information is important as a first step in gauging the restructuring and productivity-enhancing measures taken by businesses. However, one needs to keep in mind that these surveys alone may not capture the process of technical diffusion. By relying on purely quantitative measures in assessing the effects of lean manufacturing technologies, we may miss crucial linkages inherent in this production system. For example, a recent study administered by the National Association of Manufacturers suggests that computer-aided design is a precursor to computer numerically controlled machines and computer-aided manufacturing.9
In addition, it may be helpful to understand the returns from new technology in the context of the management and goals of an entire plant. The issues are complex. Management needs to decide on the goal of implementing lean manufacturing (e.g., improving product, production, or process flexibility), as well as set rewards and incentives that are compatible with achieving that objective. For example, a practice of continuing to reward workers for maximum capacity utilization may work well in a plant that aims to achieve economies of scale, but in the context of striving for improved flexibility, more appropriate management incentives might be reduced changeover and/or lead times, and increased process range. A survey of plant managers by Statistics Canada confirmed the relevance of organizational and management issues in the context of technology implementation and adoption: Difficulties related to organizational change ranked highest among impediments to technical acquisition, even above issues such as skill shortages and labor training needs.10
Conclusion
In assessing the Midwest's economic turnaround, we can distinguish the supporting role of favorable fundamentals from structural changes, especially improvements in productivity. While the latter issues are very hard to document in all their complexity, there is strong evidence that advanced technologies have been widely applied in the manufacturing sector. However, little is yet known about the adjustment to new manufacturing techniques at the regional level. A regional breakdown of available data, as well as comparisons with manufacturing centers in Europe and Japan, is necessary to improve our understanding of these adjustment processes in different geographies, cultures, and legal frameworks.
What lessons can we draw from a longer view of the Midwest's performance for the role of development policies? What role, if any, can development efforts play in fostering the region's economic prospects? The evidence presented here seems to suggest a focus on technology implementation. Since the incidence of advanced manufacturing technology is either independent of plant age or increases with it, there seems to be little need to focus on attracting greenfield plants in order to further the competitiveness of the Midwest's industries. Innovation and technology networks might be more effective in transferring technology. Are market mechanisms adequate for the transfer of technology and management practices or is there a role for public or private/public partnership efforts? To what extent do advanced manufacturing techniques require that the skills of the existing work force be upgraded? In order for the region to remain competitive, policymakers need to address these questions.
Tracking Midwest manufacturing activity
Manufacturing output indexes (1987=100)
| April | Month ago | Year ago | |
|---|---|---|---|
| MMI | 147.0 | 143.4 | 139.7 |
| IP | 126.5 | 125.2 | 123.5 |
Motor vehicle production (millions, seasonally adj. annual rate)
| May | Month ago | Year ago | |
|---|---|---|---|
| Cars | 6.4 | 6.3 | 6.1 |
| Light trucks | 5.4 | 5.5 | 5.5 |
Purchasing managers' surveys: net % reporting production growth
| May | Month ago | Year ago | |
|---|---|---|---|
| MW | 62.1 | 55.6 | 52.9 |
| U.S. | 52.7 | 52.1 | 49.6 |
Purchasing managers' surveys (production index)
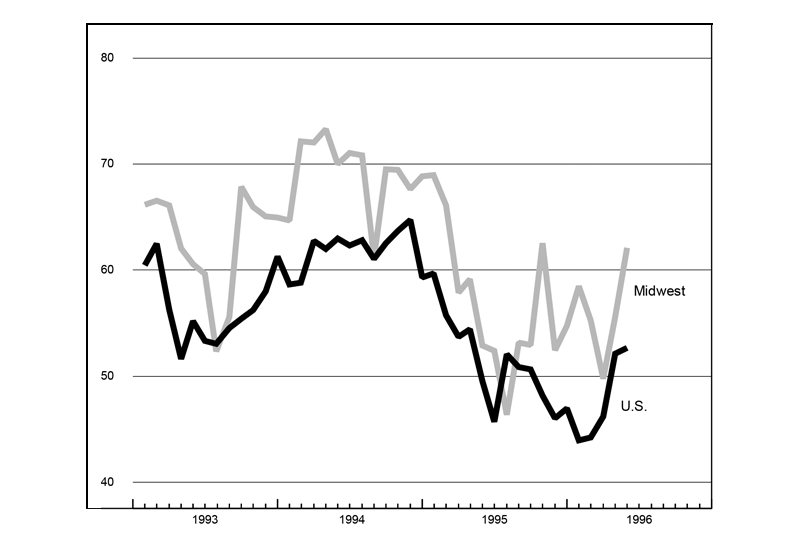
Midwest manufacturing activity rebounded from a strike-disrupted March. The Midwest Manufacturing Index was up 2.5% in April (versus 1.1% nationally), partly due to a 23% increase in light vehicle assemblies, of which the Midwest accounted for roughly half. Excluding autos and parts production, industrial production in April was flat nationwide. In May, national industrial production increased 0.5%, with vehicle assemblies unchanged.
Building on April gains, production in the Midwest continued to expand in May, according to the purchasing managers' surveys. The national survey showed moderate improvement, rising from 52 to 53 (where 50 designates no change). However, the Midwest index rose from 56 to 62—signaling fairly strong expansion in production. As the rebound effects from the strike subside, production activity in the region should also moderate.
Notes
1 The Midwest is defined as the Seventh Federal Reserve District, comprising parts of Indiana, Illinois, Michigan, and Wisconsin and all of Iowa.
2 See for example “Mid-western thunder,” The Economist, December 3, 1994, pp. 29–33; Michael Prowse, “Midwest toasts dollar's decline,” Financial Times, March 23, 1995, p. 6; and Edward Walsh, “Economic renewal puts luster on the Rust Belt,” Washington Post, March 19, 1996, p. A1.
3 Copies of the summaries of the workshop presentations and discussions are available from the Public Information Center, Federal Reserve Bank of Chicago, P.O. Box 834, Chicago, IL 60690-0834.
4 See David R. Allardice and William J. Bergman, “The Midwest economy: A well-oiled machine,” paper presented at the workshop “The Midwest Economy: Structure and Performance,” Chicago, February 13, 1996.
5 See Prowse, op. cit.
6 However, the implementation of advanced manufacturing is by no means restricted to that industry. For example, USX Corp.'s giant steel plant in Gary, Ind., now employs only one-quarter of the work force it did in 1970, yet it now produces more steel.
7 Diana Kurylko, “Assembly-hour gap closing,” Automotive News, March 4, 1996, p. 1.
8 See John Baldwin, Brent Diverty, and David Sabourin, “Technology use and industrial transformation: Empirical perspectives,” Statistics Canada, 1994; U.S. Department of Commerce, Bureau of the Census, Current Industrial Reports: Manufacturing Technology, 1988; and U.S. Department of Commerce, Bureau of the Census, Current Industrial Reports: Manufacturing Technology: Prevalence and Plans for Use, 1993.
9 Paul M. Swamidass, “Technology on the factory floor II,” The Manufacturing Institute, 1994.
10 Remarks by John Baldwin at the workshop.


