

The following publication has been lightly reedited for spelling, grammar, and style to provide better searchability and an improved reading experience. No substantive changes impacting the data, analysis, or conclusions have been made. A PDF of the originally published version is available here.
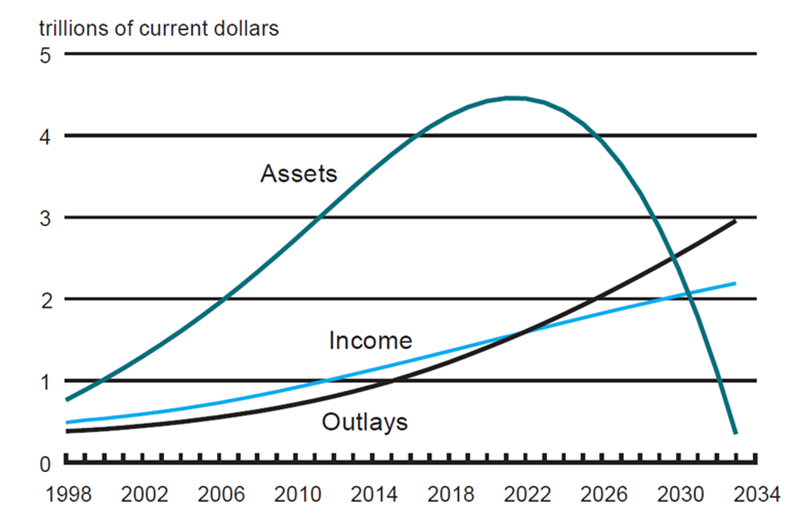
By 2022, Social Security outlays will begin to outstrip its revenues. Because of these deficits, the Social Security Trust is expected to run out of cash in 2034 (see figure 1).1 The source of this problem is Social Security’s Pay-As-You-Go structure, whereby beneficiaries are paid, not from their own accumulated deposits, but from the contributions of workers who are currently depositing money into the system. As large numbers of the baby boom generation retire, a small number of post-baby boom workers will be supporting the pensions of this large population.
1. SSA forecasts (intermediate scenario)
To avert the predicted bankruptcy, there are three options: 1) increase revenues by increasing the payroll tax and the earnings cap, 2) reduce benefits, and/or 3) increase the rate of return on funds in the Social Security Trust. In this Chicago Fed Letter, we take a closer look at the third option, increasing the rate of return on Social Security funds.
Under current law, the funds that remain after benefits have been distributed are stored in the form of risk-free Treasury securities. In recent history, however, equity investments have significantly outperformed Treasury securities. For example, the after-inflation annual return on Standard & Poor’s 500 stocks for the 1947–96 period was 9.5%, while that of long-term Treasury bonds was only 1.8%.2 This difference in returns between stocks and Treasury bonds is known as the equity premium. Capitalizing on the equity premium by investing in stocks has been proposed as a painless way to prolong the viability of Social Security and is the impetus behind many reform packages. Currently, there are three House bills and two Senate bills of this type pending in the 106th Congress. The White House has also informally presented its own reform plan incorporating equities.
The reform plans fall into four categories. The first category comprises plans that dismantle the current Social Security system and replace it with personal retirement accounts.3 With these plans, workers are allocated individual retirement accounts in which to deposit a percentage of their earnings. They can invest these funds in a selection of pre-approved mutual funds or portfolios offered by pre-certified institutions. Upon retirement, individuals receive annuities based on their account balances.
The second category maintains the Social Security system but allows for a small part of workers’ earnings to be deposited into individual accounts.4 These proposals are modeled after the Federal Retirement Thrift plan available to federal employees. Funds in individual accounts can be invested in pre-approved mutual funds, and individual Social Security benefits are reduced by the amount diverted to the personal accounts.
The third class of proposals does not allow for individual accounts but permits the Social Security Trust fund to invest in stocks. An independent board would be established to oversee investments.5
Finally, there is a hybrid type of plan that allows for both individual accounts and a limited amount of investment of the Trust in the stock market.6 As with the first two types of plans, individuals can invest money in their individual accounts in pre-approved funds, and their Social Security benefits are reduced accordingly. In addition, a pre-legislated percentage of the Trust fund would be invested in stocks.
The issue of stock market risk
The above review of the proposals shows that the reformers advocate two ways of increasing returns of Social Security deposits—allowing individuals to use their deposits to invest in the market and permitting the Trust fund to invest directly. Both of these types of proposals make two important assumptions that should be examined more closely.
The first assumption is that investment in equities will generate higher returns than investment in government bonds. While it is true that, historically, the average equity premium has been quite large, these high equity returns do not come without cost. Stocks are riskier than government securities. The equity premium is properly regarded as compensation for the additional risk borne by stocks. Thus, investing in equities would introduce additional risk into the Social Security system. Policymakers need to assess how much additional risk is involved, who will bear this risk, and whether the potential benefits of these proposals outweigh the additional risk.
The second assumption underlying these proposals is that the average historical rates of return to equities will continue into the future. This assumption is potentially dangerous. As Cochrane (1997) and Marshall and Duffy (1998) point out, periods during which equity prices are high7 tend to be followed by periods of unusually low stock returns.8 Stock market prices are currently extremely high by any measure. Thus, we would expect several years of lower-than-average returns to equity investors. For example, Welch (1998) reports that, among financial economists, consensus forecasts of the future equity premium range from 3% to 6%, lower than the postwar mean equity premium of nearly 8%.9
Because of the additional risk and the possibility of lower-than-average equity returns, the potential benefits of investing Social Security monies in the stock market are somewhat ambiguous.
Assessing the risk of equity investment for the Social Security Trust
We quantify one element of the risk added to the Social Security system when a portion of the Trust is invested in equities. Our measure of risk is the probability that the Social Security Trust will run out of funds prior to 2034, the date projected for Social Security bankruptcy under the Social Security Administration’s (SSA) intermediate scenario.
We consider three alternative scenarios that represent the range of proposals. The low investment scenario invests 10% of annual Trust fund balances in equities. This scenario is representative of the Feldstein proposal.10 The second scenario is the moderate scenario with 21% of the Trust fund money being directed to equities, consistent with the White House proposal of Social Security reform.11 Finally, the high investment scenario envisions 50% of Social Security deposits invested in equities, consistent with House plan HR874.12
We model the risk of equities in two different ways. Our first approach ignores the current high valuation of the stock market. Specifically, we assume that future returns follow a normal (bell-shaped) distribution with the mean and variance equal to 1941–98 historical estimates.
Our second approach uses a dynamic model of returns.13 With this model, the future distribution of returns is predicted by the current state of the market. In particular, we follow Fama and French (1989)14 in using the dividend yield, the default premium, and the term premium to predict equity returns.15
We estimate the dynamic model using data from 1941 to 1998 and then use the estimated model to simulate future returns. The simulations use a “bootstrapping” methodology to account for the fact that the distribution of historical returns is not normal, but fat-tailed. With the fat-tailed distribution, there is greater likelihood that extreme events—for example, very low returns—may occur. Because of this bootstrapping and because we explicitly incorporate the lowering effect of current high price–dividend ratios on future expected returns, this method represents a more conservative assumption about the distribution of future returns than our first approach.
Using the distribution of returns implied by each approach, we simulate the evolution of the Social Security Trust fund and obtain the date of bankruptcy of the fund. We do these simulations 50,000 times to obtain a distribution of bankruptcy dates. We then compare this distribution of predicted end dates to the SSA’s projected 2034 bankruptcy date.
Our results are quite striking. If one assumes that future equity returns will have the same mean and variance as in the past, then investing Social Security Trust funds in the stock market is an unqualified boon. As figure 2 shows, the probability that equity risk causes the Trust to go bankrupt before its current projected bankruptcy date (2034) is less than 0.2% for all three scenarios. When 21% of the Trust is invested in stocks (a level roughly corresponding to the White House proposal), the median date of bankruptcy rises to 2045, a full 11 years later than the current projected bankruptcy date.
2. Social Security simulation results
| Investment Options | Probability of bankruptcy before 2034 |
Median year of bankruptcy |
| Current System | ||
| No investment in equities | - | 2034 |
| Assuming historical mean and variance of equity return |
||
| Low equities (10%) | 0.02 | 2038 |
| Moderate equities (21%) | 0.06 | 2045 |
| High equities (50%) | 0.11 | 2053 |
| Dynamic model with bootstrapping |
||
| Low equities (10%) | 0.13 | 2035 |
| Moderate equities (21%) | 0.53 | 2038 |
| High equities (50%) | 1.01 | 2046 |
Source: Author’s calculations.
Under the second, more conservative approach, however, the potential benefits of equity investment are considerably lower: with 21% of the Trust invested in stocks, the median bankruptcy date of the Trust is 2038—only a four-year reprieve over the SSA’s projected bankruptcy date. In addition, the risk of early bankruptcy (before 2034) is somewhat higher. Still, these probabilities are quite small—mostly less than 1%—suggesting that investing Trust funds in stocks would pose little additional bankruptcy risk to the Social Security system.
Some additional issues
In reality, these proposals are more complex than our simulations. One of the complications not addressed in the simulations is that many proposals include a minimum annuity that ensures that, even if individuals invest badly, they will receive some minimum Social Security benefit. Thus, individuals’ losses are limited, but any gains are theirs to keep. Since they are insured against losses, individuals have an incentive to put their money in riskier investments. This would increase the probability of substantial losses for the system as a whole (but not for the individual), so the strain on Social Security would be even greater than the simulations indicate.
Who would ultimately bear the risk if there were a sustained drop in the stock market? Currently, the individual investor bears the downside risk with IRA and 401K plans, while private corporations bear the risk with corporate pension plans. If Social Security were to invest funds directly in equity markets or if Social Security were converted to a system of individual accounts with guaranteed minimum benefits, the taxpayers would bear the downside risk.
If there were no guaranteed benefits, individuals would bear the risk, but this scenario hardly seems consistent with the stated purpose of Social Security to provide a safety net. Furthermore, if many workers were affected by a sustained adverse event in the stock market, the government might be pressured to provide funds to bail out these unlucky individuals. In that event, taxpayers would bear the ultimate risk.
We conclude from this analysis that allowing equity investment of Social Security Trust funds would introduce a relatively small amount of additional risk into the Social Security system. The resulting benefits, however, would also be modest. Equity investment does not represent a painless way to “save” Social Security. The actuarial imbalances implied by Social Security’s current economic and demographic assumptions may ultimately require politically painful tradeoffs.
Tracking Midwest manufacturing activity
Manufacturing output indexes (1992=100)
| September | Month ago | Year ago | |
|---|---|---|---|
| CFMMI | 131.7 | 132.7 | 127.5 |
| IP | 139.5 | 139.8 | 135.2 |
Motor vehicle production (millions, seasonally adj. annual rate)
| September | Month ago | Year ago | |
|---|---|---|---|
| Cars | 5.7 | 5.7 | 6.5 |
| Light trucks | 6.9 | 7.6 | 5.9 |
Purchasing managers' surveys: net % reporting production growth
| October | Month ago | Year ago | |
|---|---|---|---|
| MW | 60.4 | 57.5 | 57.5 |
| U.S. | 58.3 | 61.7 | 52.6 |
Motor vehicle production (millions, seasonally adj. annual rate)
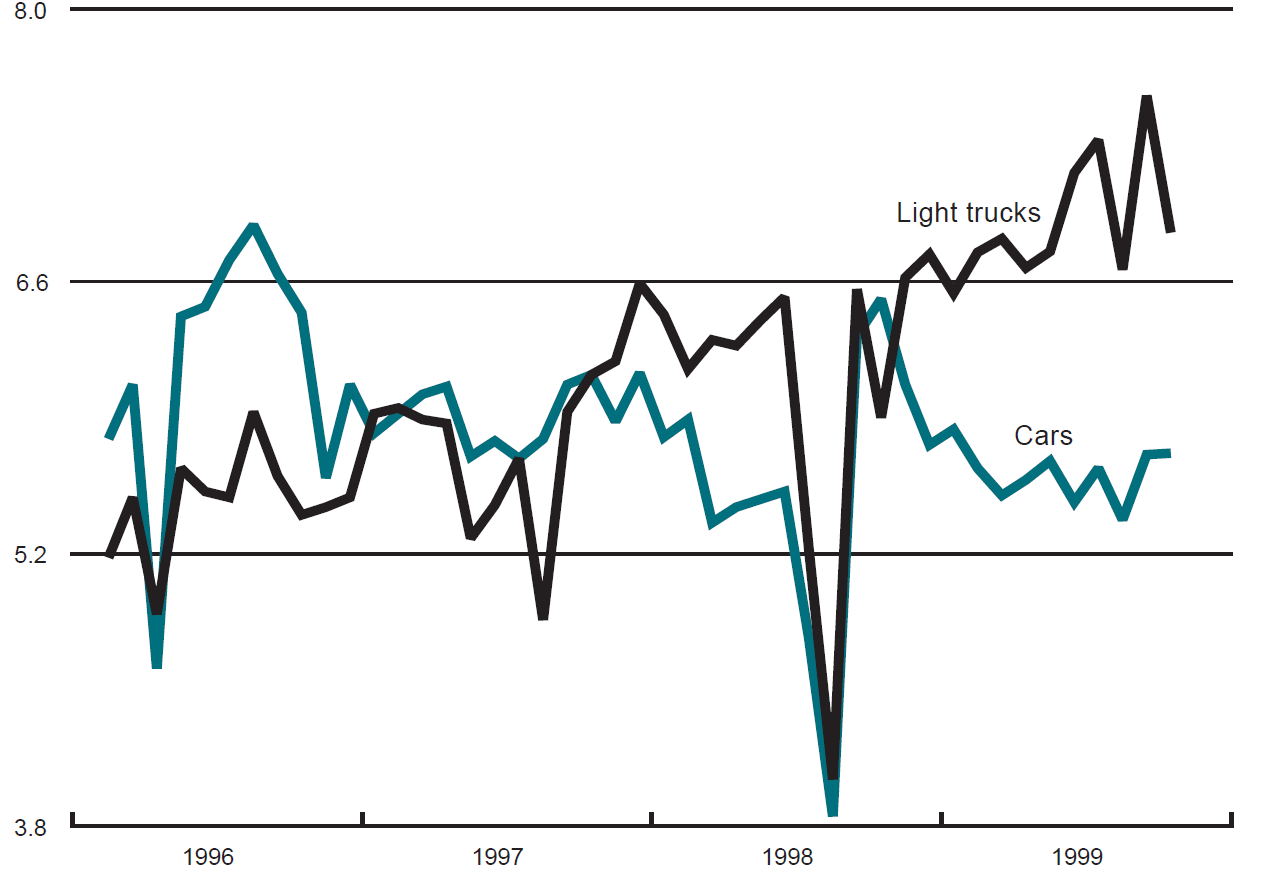
Light truck production decreased from 7.6 million units in August to 6.9 million units in September, and car production remained constant at 5.7 million units for both August and September. The Chicago Fed Midwest Manufacturing Index (CFMMI) fell 0.8% from August to September. The revised data show the index rose 0.6% in August. The national Industrial Production Index for manufacturing (IP) decreased 0.2% in September.
The Midwest purchasing managers’ composite index (a weighted average of the Chicago, Detroit, and Milwaukee surveys) for production increased to 60.4% in October from 57.5% in September. The purchasing manager’s indexes increased for all three surveys for the second consecutive month. The national purchasing managers’ survey for production decreased from 61.7% in September to 58.3% in October.
Notes
1 In this article, the term “Social Security Trust” refers to the combined Federal Old-Age and Survivors Insurance (OASI) and Disability Insurance (DI) Trust Fund, or OASDI.
2 John Cochrane, 1997, “Where is the market going? Uncertain facts and novel theories,” Economic Perspectives, Federal Reserve Bank of Chicago, Vol. 21, No. 6, pp. 3–37.
3 For example, Senate bill S263 (Roth) and House bills HR251 (Sanford) and HR874 (Porter).
4 Senate bill S21 (Moynihan and Kerrey).
5 House bill HR871 (Markey, Bartlett, and Pomeroy).
6 Initially, the White House plan belonged in this category. As this article went to press, however, the White House announced it was dropping equity investment by the Trust from its plan.
7 That is, they are high relative to stable measures of fundamental value such as earnings, dividends, or book value.
8 David Marshall and Denise Duffy, 1998, “Whither the stock market?” Chicago Fed Letter, August, No. 132.
9 Ivo Welch, 1998, “Views of financial economists on the equity premium and other issues,” Anderson Graduate School of Management, UCLA, unpublished manuscript.
10 Feldstein’s plan proposes that 2% of earnings be directed to individual accounts. Since the payroll tax is 12.4% of earnings, this means that 16% of Social Security taxes (2%/12.4%) would be in individual accounts. We assume that individuals would invest in a manner similar to current private IRA investments, with 60% of their portfolio in stocks and 40% in bonds. This implies that about 10% of Social Security earmarked funds (16% x 60%) would be in equities. Details of Feldstein’s proposal are obtained from Martin Feldstein, 1998, “Two percent personal retirement accounts: Their potential effects on Social Security tax rates and national saving,” National Bureau of Economic Research working paper, No. 6540.
11 Jacob Lew, 1999, Testimony before the House Committee on Ways and Means, Washington, DC.
12 HR874 proposes that 10% of earnings be directed to individual accounts. Following the same method as detailed in footnote 10, this implies that 81% of Social Security taxes (10%/12.4%) would be in individual accounts. Assuming a 60% rate of investment in equities, this leads to about 50% of Social Security inflow (81% x 60%) being invested in equities.
13 The dynamic model we use is known as a vector autoregression (VAR). For a detailed discussion of the VAR methodology, see Michael Kouparitsas, 1998, “Are international business cycles different under fixed and flexible exchange rate regimes?” Economic Perspectives, Federal Reserve Bank of Chicago, Vol. 22, No. 1, pp. 46–64.
14 Eugene Fama and Kenneth French, 1989, “Business conditions and expected returns on stocks and bonds,” Journal of Financial Economics, Vol. 25, No. 1, pp. 23–49.
15 For equity returns, we use the value-weighted returns of New York Stock Exchange, American Stock Exchange, and Nasdaq stocks. The default premium measure we use is the difference between the yield on AAA corporate bonds and the yield on Treasury bonds of similar maturity. For the term premium, we use the difference in the yields of 30-year Treasury bonds and 30-day Treasury bills.


