

The following publication has been lightly reedited for spelling, grammar, and style to provide better searchability and an improved reading experience. No substantive changes impacting the data, analysis, or conclusions have been made. A PDF of the originally published version is available here.
Much has been made in recent months of the low personal saving rate in the U.S. The rate’s drop from around 5% in the early 1990s to 0% today is a cause of serious concern. Many take it as a sign that the current expansion is very fragile and about to end. The argument runs as follows: The saving rate is unsustainably low and must increase sooner or later. When it does, consumption must go down and this expansion will end.
Figure 1 shows the personal saving rate. This measure is computed as personal income less personal taxes (i.e., disposable personal income) less personal outlays, divided by disposable personal income. It averaged 8% from 1959 to 1985, about 5.8% from 1985 to the end of the last recession, and has been plunging since then. Since April 1998, it has oscillated between –0.2% and 0.4%. This plunge seems exceptional, and, so the argument goes, must soon be reversed.
1. Personal saving
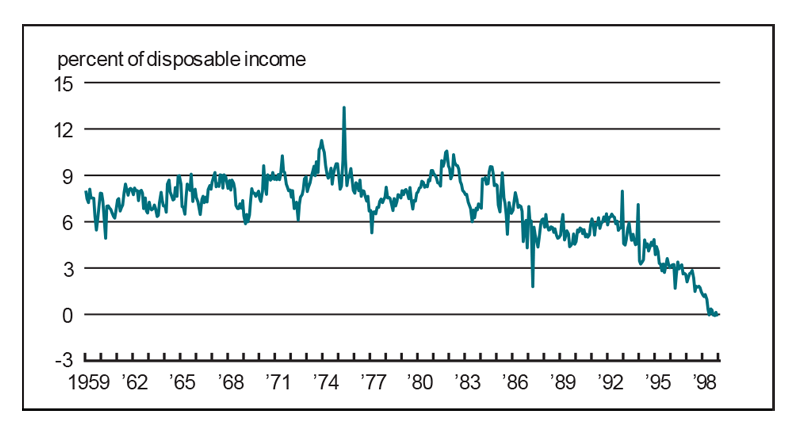
Source: U.S. Department of Commerce, Bureau of Economic Analysis.
In this Chicago Fed Letter, I question the argument’s mechanical view of saving and consumption on theoretical grounds and whether the personal saving rate is a meaningful measure for the purposes of this argument. I argue that broader aggregates need to be considered because saving can take many forms.
The argument considered
The argument outlined above appeals to common sense: Consumers cannot spend more than they earn, at least in the long run, and some minimal amount of saving seems commendable. In the past, as figure 1 shows, that amount of saving was reasonable. In the present expansion, consumers are spending with abandon, but when they come to their senses, they will have to halt their spending spree.
But the argument is not self-evident, and it relies on fairly strong assumptions about consumers’ behavior. The argument does not try to explain why the personal saving rate is so low, but it implicitly assumes that the present level of saving is an aberration. For some unspecified reason, the judgment of consumers has temporarily lapsed. Should we trust an argument that presumes its proponent to be smarter than everyone else in the economy?
In theory, a low saving rate can arise from perfectly rational behavior. The usual model for thinking about saving is the permanent income model, which derives saving behavior from consumers’ consideration of their known lifetime income, rather than from current income. If consumers learn that their income will be higher than expected in the future, they adjust their consumption to this new level of lifetime wealth, even before their income has increased. This would lead to a justifiable fall in saving. Ultimately, saving will increase when income increases, not by a reduction in consumption.
One reason consumers could expect their future income to be higher is an expected increase in the performance of the economy, say, because firms are expected to be more productive in the future. Now would be a good time to consume, because investment (which involves the sacrifice of consumption) will be more productive in the future. Such future improvements would not be reflected in current income, but in a higher valuation of the firms. On the surface, consumers would thus appear to be spending “paper gains,” fooled by an exuberant stock market. In reality, they would have revised their expectations and acted accordingly. Of course, consumers and markets may all be dead wrong about the U.S. economy’s future performance. But the debate becomes a matter of assessing a change of expectations about the future.
Is this the right measure of saving?
Much attention has been paid to various flaws in the measure plotted in figure 1, especially after a methodological change in the measure by the U.S. Department of Commerce’s Bureau of Economic Analysis (BEA) in August 1998. The change removed certain forms of capital gains from income, reducing the reported figures for income but leaving the figures for personal outlays unchanged. The BEA had good reasons for changing the measure (treating capital gains in a way consistent with other national income and product accounts), but the change suggests that the personal saving rate may be much too narrow a measure, focusing as it does on certain forms of income only. Tinkering at the edges with the BEA’s measure is not enough. Rather than debate what items should be included in or excluded from the BEA’s measure of personal saving, I argue that it is necessary to consider broader aggregates.
To better understand this, we can divide the economy into the private sector and the public sector (government). The private sector, in the national accounts, is subdivided into households and (privately owned) businesses. But that distinction is artificial because households ultimately own the firms. For the subject at hand, the exact timing and arrangement of flows between firms and households is of little importance. In one arrangement, firms produce and turn over revenue to households as wages and dividends. Households then make saving decisions and turn over their savings to firms for investment. In another arrangement, firms make the saving decision for the households and skip the round-trip from firms to households (as income) back to firms (as saving). Under both arrangements, households save just as much but, under the latter, the BEA’s measure of personal saving would be nil.
Thus, besides personal saving, there is “corporate saving,” but since it is done on behalf of households, there is no reason to separate it from personal saving. If we consider total private saving, that is, personal saving plus corporate saving,1 we arrive at the levels shown in figure 2. Private saving is significantly higher than personal saving; moreover, its behavior during the last expansion was quite different, remaining roughly stable at 6% from 1985 to 1997. Only in the last year and a half has it fallen markedly.
2. Saving
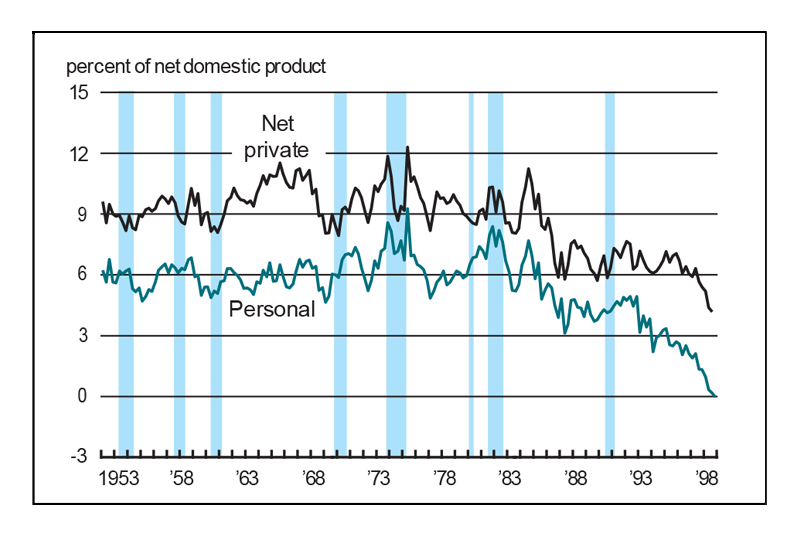
Source: U.S. Department of Commerce, Bureau of Economic Analysis.
We can also look at total U.S. saving, by adding private and public saving (net of capital consumption; the patterns are the same if one looks at gross saving). The results are shown in figure 3. The (net) national saving rate, which had been falling steadily since the late 1960s, bottomed out in the third quarter of 1992 at 2.4% and has risen steadily since then to 7.4%.
3. Government and total saving
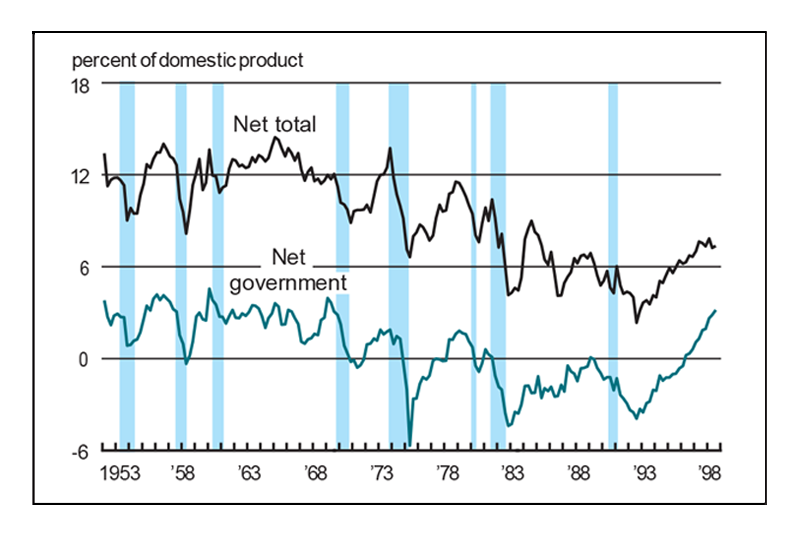
Source: U.S. Department of Commerce, Bureau of Economic Analysis.
The difference in behavior, of course, is traceable to government saving, which had been mostly negative since the first oil shock in 1973. Since the third quarter of 1992, government saving (federal, state, and local) has moved from –3.9% to 3.2% of gross national product. Government saving tends to be procyclical, since revenues shrink and expenditures increase during recessions, but the recent increase in government finances is unprecedented.
Why is the personal saving rate so low?
Figure 4 shows the disposition of personal income, broken down into three categories: outlays, taxes, and savings. The widely cited personal saving rate that just turned negative can be inferred from the figure: It is the ratio of saving to outlays plus saving. Figure 4 shows that while images of Americans raiding the piggy bank to fuel a consumption binge might make good copy, they are at least partly incorrect. Personal outlays take a larger share of income, but so do taxes. Figure 4 also gives more insight into the paradox of a lower personal saving rate coupled with a higher national saving rate. As tax payments are biting a larger chunk of their income, why are households cutting back on saving rather than spending?
4. Personal income breakdown
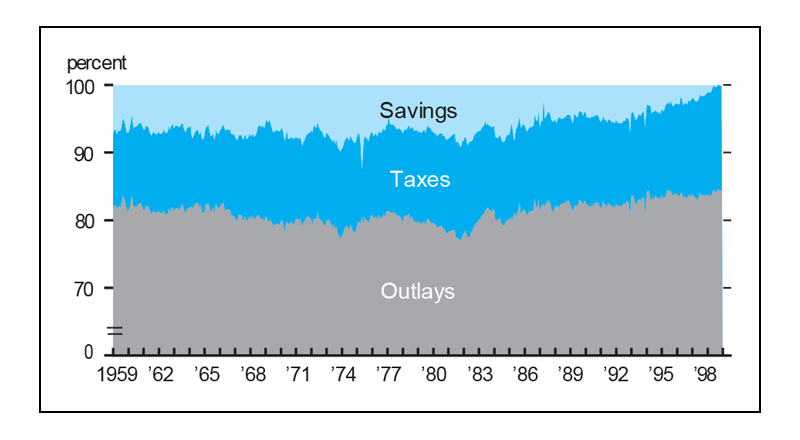
Source: U.S. Department of Commerce, Bureau of Economic Analysis.
Figure 3, which shows government and private sector saving rates, suggests an answer. Consumers are letting government do their saving for them, the same way they are letting businesses do it as shown above. In other words, consumers look at the taxes they are paying now as partly an investment, which will pay off in the future, in the form of lower taxes or higher benefits from the government. If that is the case, then a fall in taxes now would result not in higher consumption but in a higher saving rate, as consumers would resume saving for themselves instead of through the government.
An interesting implication of this argument is that a cut in taxes would reverse the trend in the personal saving rate and let consumers do the saving for themselves, something which may or may not be desirable in the context of the Social Security debate. But a tax cut would do little to alter consumption behavior.
Reasons to worry?
There are reasons to worry about the saving rate in general. Investment is, by and large, financed by saving, and an economy needs to invest in order to maintain and expand its capital stock. Are we investing too little in the U.S.? Figure 5 shows the share of gross domestic product that is taken by gross domestic investment.
5. Domestic investment and saving
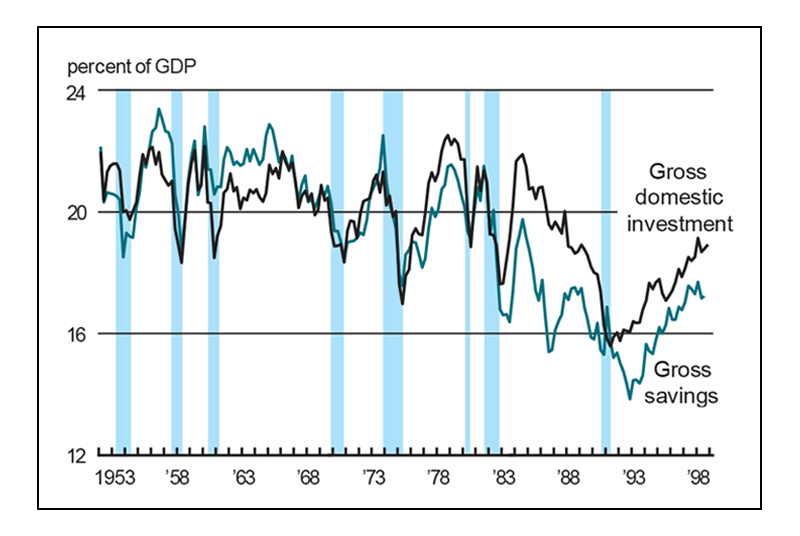
Source: U.S. Department of Commerce, Bureau of Economic Analysis.
Like figure 3, figure 5 displays a downward trend over the past 50 years, although, interestingly, the current expansion stands in marked contrast to the 1980s. The investment rate has steadily increased from a post-World War II low of 12.2% in the second quarter of 1990 to a current rate of 16.1%, slightly above the post-World War II mean of 15.6%. How is domestic investment financed? In accounting terms, it is saving less net foreign investment. As figure 5 shows, in recent years saving has been less than domestic investment. In other words, net foreign investment has been negative, because we spend some of our saving to finance our trade deficit. The overall pattern, however, is the same.
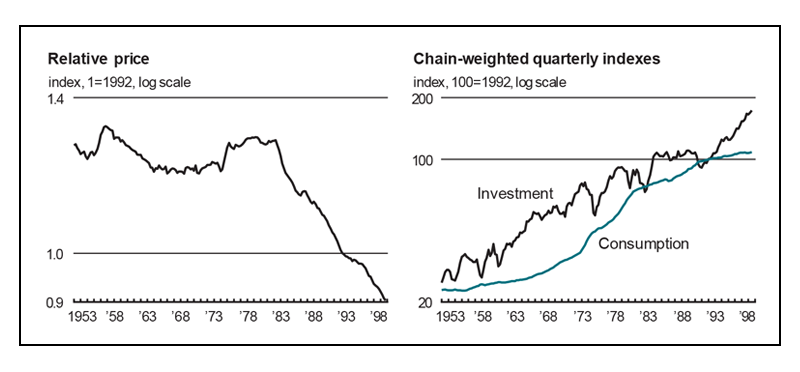
Should we worry about this long-term downward trend? It depends on what explains it. The rates plotted in figure 5 are really budget shares, and budget shares do not tell the complete story. I may be spending less of my income on apples and still be buying more apples than before, if the price of apples has fallen enough.
In fact, as shown in the left panel of figure 6, the relative price of investment goods has fallen markedly. Investment goods are becoming cheaper, and expenditures on investment goods (which is the investment rate) are declining as a share of total income. This is not a sign that, as a nation, we are saving less and building fewer factories, but rather, that it is costing us less to build the same number of factories. The right panel of figure 6 confirms that, when one looks at quantities, consumption and investment have been following the same secular growth trend. And, if anything, this allegedly “consumer-driven” expansion seems to be as much about investment.
6. Investment versus consumption
Source: U.S. Department of Commerce, Bureau of Economic Analysis.
Conclusion
There appear to be good reasons not to worry about the saving rate. Once the appropriate aggregates are considered, this expansion does not appear to be out of line with past experience. The reason for considering these aggregates is that saving can be carried out on behalf of consumers by firms and government. And, in fact, it is— something to bear in mind in any discussion of fiscal policy as a means to boost consumption. Finally, the long-term downward trend in the national saving rate need not be worrisome if proper account is taken of changes in relative prices.
Notes
1 This includes undistributed corporate profits, inventory valuation and capital consumption adjustments, and wage accruals less disbursements.


