

The following publication has been lightly reedited for spelling, grammar, and style to provide better searchability and an improved reading experience. No substantive changes impacting the data, analysis, or conclusions have been made. A PDF of the originally published version is available here.
Bank deposit growth is declining. At the end of June 2000, deposits funded only two-thirds of bank assets, compared with 77% at the end of 1992. Core deposits (total deposits less time deposits larger than $100,000), the banks’ bread-and-butter source of funding, have declined at an even faster rate, from 62% of total bank assets in 1992 to 46% at the end of June 2000.1 Not only are banks losing a stable source of funding, but the composition of deposits and other liabilities is shifting toward more interest-sensitive instruments. Banks are relying more on deposits purchased through brokers, advances from the Federal Home Loan Bank System, and volatile liabilities.
These developments are raising concerns among regulators and bankers.2 Core deposits provide a stable source of funding to banks, insulating them from fluctuations in market rates. As a smaller portion of bank assets is funded by core deposits, banks face increasing pressure on profits. At the same time, the maturities of bank assets are lengthening, increasing banks’ exposure to interest rate risk. In an environment of rising interest rates and declining asset quality, the additional pressure on profits, liquidity, and risk can affect the safety and soundness of the industry.
The negative effects of declining deposit growth can stretch beyond the banking sector. As banks’ liquidity risk increases, their ability, or willingness, to fund loan growth might decrease. As a result, at a time when banks are becoming more sensitive to credit risk and tightening underwriting standards and loan terms, deposit erosion can further impair the ability of some borrowers to obtain funds or can increase their cost of funding. Because some borrowers have few alternatives to bank financing, constraints on banks’ ability to fund profitable investments can adversely affect economic activity.
In this Chicago Fed Letter, I address the following questions related to changes in bank funding sources. How pervasive is the decline in deposit growth? Are all banks facing similar funding pressures? Has the erosion in deposits been greater for smaller institutions? What is the impact of declining deposits on loan growth? Is lending by small banks, which are more dependent on deposits, more likely to be constrained as a result of the decline in deposit growth? Are all loan portfolios affected to the same degree by slower deposit growth? And, what are the implications for borrowers?
Shifts in banks’ funding sources
Technological advances and deregulation over the past 15 years have significantly increased the competitive pressures facing banks. Consumers and businesses that previously purchased financial services from banks are increasingly turning to capital markets or other financial intermediaries. For instance, according to Morningstar, Inc., at the beginning of 1985, there were only about 700 mutual funds, compared with over 5,500 today. Over the same period, assets of mutual fund companies increased more than tenfold in inflation-adjusted terms, to reach over $6 trillion at the end of June 2000. Rising equity values over this period undoubtedly played a large role in changing the composition of household portfolios. At the end of June 2000, deposits accounted for only 12% of household assets, down from 22% in 1990. In contrast, over the same period, equity securities and mutual fund assets held by households increased from 60% of total financial assets to nearly 74%.
Mirroring these developments, the share of bank assets funded by deposits, particularly core deposits, has been declining steadily since 1992 (figure 1). Banks have filled the funding gap by increasing their reliance on other liabilities. For instance, at the end of June 2000, advances from the Federal Home Loan Bank (FHLB) System funded 3% of all bank assets, compared with 0.17% at the end of 1992. Banks are also raising a smaller fraction of their retail deposits directly from their own customer base and relying increasingly on brokered deposits. This makes their cost of funds more sensitive to interest rate fluctuations, potentially putting pressure on profits. Moreover, deposit growth has not kept pace with loan growth, raising the specter of liquidity risk. Since 1993, bank loans have grown at an annual rate of 6% in inflation-adjusted terms, compared with a 2.9% growth in deposits. As a result, the loan-to-deposit ratio has reached new highs, increasing from 73% in 1992 to nearly 92% at the end of June 2000.
1. Funding sources, 1992–00
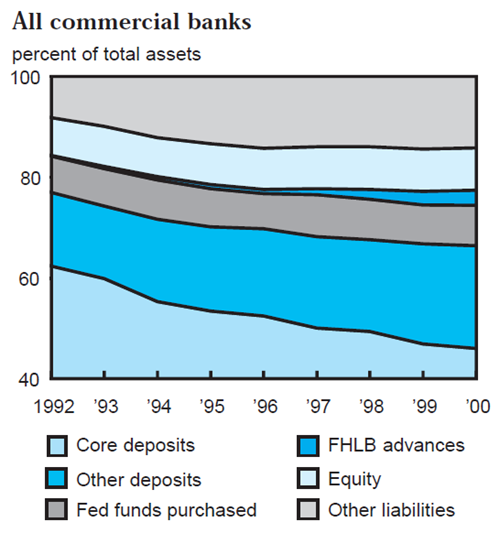
Notes: Core deposits are defined as total deposits minus time deposits in greater than $100,000 denominations.
Source: Federal Deposit Insurance Corporation.
The impact of these developments is likely to differ for small and large banks. Because smaller institutions have fewer alternatives to deposits, they typically fund a greater fraction of their assets through core and other deposits and rely less on federal funds purchased and other liabilities (figure 2). Moreover, small banks on average have higher interest expenditures on deposits and federal funds purchased. The greater a bank’s reliance on deposits, the more it needs to hold liquid assets to meet unexpected surges in demand for funds by depositors. Hence, it is not surprising that small banks also tend to allocate a smaller fraction of their assets to loans than large banks.
2. Small versus large banks, 1992–99
| Small banks | Large banks | |
| Total deposits, % of total assets |
86.48* | 74.14 |
| Core deposits, % of total deposits |
89.50* | 88.06 |
|
Federal funds purchased, |
1.28* | 8.66 |
| Equity capital, % of total assets |
10.27* | 8.33 |
| Net loans & leases, % of total assets |
55.39* | 61.29 |
| Average interest expense on deposits, % |
3.36* | 3.09 |
| Average interest expense on federal funds purchased, % |
6.85* | 5.88 |
| Total assets ($ miilions) | 104.31* | 8,245.31 |
Notes: Small banks have total assets less than or equal to $1 billion. Large banks have total assets greater than $1 billion. Core deposits are defined as total deposits minus time deposits in greater than $100,000 denominations.
Source: Bank-level averages from merger-adjusted quarterly data from banks’ Report of Condition and Income (call report).
Deposit growth at small and large banks
It is typically assumed that deposit erosion has been greater for small banks; however, figure 3 shows that this is not the case. Over the 1992–99 period, assets funded by total deposits at large banks declined from 79% to 71.5% versus a decline from 88% to 84% at small banks. Core deposits of large banks declined from 71% of total assets in 1992 to 61% in 1999 versus a decline from 80.5% to 73.6% for small banks.
3. Funding sources, 1992–99

Source: Merger-adjusted quarterly data from the banks’ Report of Condition and Income (call report).
The differences between deposit erosion at small and large banks arise not because large banks have grown faster, but because deposit growth at small banks has been greater. During the 1992–99 period, total assets of small and large banks expanded at statistically similar rates: 1.70% average quarterly rate for small banks and 1.76% for large banks. On the other hand, total deposits at small banks grew at an average quarterly rate of 1.6%, compared to a 1.2% quarterly increase at large banks.3
At the same time, despite similar growth rates of total assets at small and large banks, loan growth at smaller institutions has been stronger. While the average quarterly growth rate of loans at small banks over the 1992–99 period was 2.19%, loans at larger institutions grew at a significantly lower 1.72% rate.
Relationship between loan and deposit growth
What is the relationship between loan and deposit growth? In one sense, this is a chicken-and-egg question. Do banks seek new deposits because they experienced strong loan growth? Or, do they seek new profitable lending opportunities because their deposit base expanded?
The evidence suggests that both are true. For instance, the evidence in Kashyap and Stein (1995) suggests that, at the aggregate level, loan growth in the current quarter is positively correlated with deposit growth in the current and previous three quarters.4 An analysis of bank-level data provides results consistent with the aggregate results and also suggests that the reverse is true. That is, deposit growth in the current quarter is positively correlated with past growth in loans.
4. Sensitivity of loan growth to deposit growth
| Total loans |
C&I loans |
Real estate loans |
Consumer loans |
|
| Growth rate of Total depostits |
||||
| Small banks | 0.4400* | 0.3879* | 0.4868* | 0.2633* |
| Large banks | 0.2846* | 0.1779* | 0.2514* | 0.2066* |
| Growth rate of core deposits |
||||
| Small banks | 0.3913* | 0.3301* | 0.4461* | 0.2136* |
| Large banks | 0.2218* | 0.1375* | 0.1720* | 0.1382* |
Notes: The table reports selected coefficient estimates from a regression of quarterly growth rate of different loan categories on: average quarterly growth rate of total or core deposits over the previous four quarters, the ratio of loan loss reserves to total assets, the ratio of book value of equity to total assets, state-level unemployment rate, and state-level quarterly growth in personal income. Except for growth rates of total and core deposits, all bank-specific explanatory variables are lagged one quarter and state-level economic activity is measured at the current quarterly rate.
Source: Author’s calculations using quarterly data from banks’ Report of Condition and Income (call report).
Furthermore, the positive relationship between loan and deposit growth appears to be stronger for small banks. For instance, a 1% increase in loan growth over the previous four quarters implies a 0.36% increase in the total deposits of small banks, compared to a 0.29% increase in the total deposits of large banks.5 At the same time, loan growth at small banks is more sensitive to shifts in deposit growth rates (figure 4). Specifically, over the 1992–99 period, a 1% decline in average deposit growth over the previous four quarters was associated with a 0.44% decline in total loans of small banks, compared to a 0.28% decline for large banks.
The relatively higher sensitivity of loan growth to deposit growth at small banks holds for all types of loans. At small banks, a 1% decline in deposit growth is associated with 0.49% decline in loans secured by real estate, a 0.39% decline in commercial and industrial (C&I) loans, and a 0.26% decline in consumer loans. In contrast, a similar deterioration in deposits of large banks is associated with 0.25%, 0.18%, and 0.21% declines in the three loan categories, respectively.
Lending at small banks also shows higher sensitivity to declines in core deposits. While a 1% decline in the growth rate of core deposits at small banks leads to a 0.39% decline in total loans, it results in a 0.22% decline in total loans of large banks.
The bank-level results regarding the higher sensitivity of loan growth to deposit growth at small institutions are not only consistent with aggregate data but also are intuitive. Because small banks focus more on traditional banking activities of deposit taking and lending, it is not surprising that the correlation between these activities is higher at smaller institutions.
Conclusion
In recent years, banks have been funding a smaller fraction of their assets with deposits. The deterioration in deposit growth has raised concerns about bank profits, liquidity risk, and credit availability, particularly at small banks. However, contrary to common perception, deposits at small banks have grown at a faster rate than at large banks over the 1992–99 period. Concomitant with faster deposit growth, small banks have also experienced faster loan growth. Statistical evidence using bank-level data and controlling for bank characteristics and economic activity confirms the strong positive relationship between deposit and loan growth rates. Moreover, the positive correlation between deposit taking and lending activities appears to be stronger at small banks. In particular, deposit growth at smaller banks tends to be more sensitive to lagged loan growth, bank characteristics, and economic activity. Hence, a future deterioration in any one of these measures, whatever its source, is likely to lead to a larger decline in the deposit base of smaller banks. Moreover, the impact of a given decline in deposits on loan growth tends to be larger for small banks. Consequently, credit extended by small banks is more likely to be adversely affected by the recent decline in deposit growth. This can adversely impact credit available for small businesses. Small banks lend a greater fraction of their assets to small businesses than large banks do. As deposit growth slows down, small businesses might feel the brunt of the decline in credit available from small banks unless larger institutions make up the difference.
The decline in deposits and the concomitant deterioration in the liquidity of banks’ balance sheets also increase the sensitivity of loan growth to interest rate changes. Research shows that monetary policy actions have a greater impact on banks with lower levels of security holdings, and this effect is larger for small banks.6 Hence, a contractionary monetary policy, increased inflationary expectations, or other phenomena that increase interest rates are likely to have a more adverse effect on lending policies of small banks.
The impact of declining deposits on borrowers is not likely to be confined to the amount of available credit. Research shows that banks that fund a greater percentage of their assets with core deposits tend to insulate their borrowers against aggregate changes in credit risk and market rates by smoothing interest rates charged on loans.7 Hence, as banks fund a smaller percentage of their assets with core deposits, interest rate increases are more likely to be passed through to borrowers.
Tracking Midwest manufacturing activity
Manufacturing output indexes (1992=100)
| September | Month ago | Year ago | |
|---|---|---|---|
| CFMMI | 167.5 | 167.2 | 156.0 |
| IP | 151.8 | 151.3 | 142.9 |
Motor vehicle production (millions, seasonally adj. annual rate)
| October | Month ago | Year ago | |
|---|---|---|---|
| Cars | 5.2 | 5.8 | 5.7 |
| Light trucks | 6.7 | 6.9 | 7.1 |
Purchasing managers' surveys: net % reporting production growth
| October | Month ago | Year ago | |
|---|---|---|---|
| MW | 51.4 | 56.8 | 60.0 |
| U.S. | 48.4 | 52.1 | 58.8 |
Purchasing managers' surveys (production index)
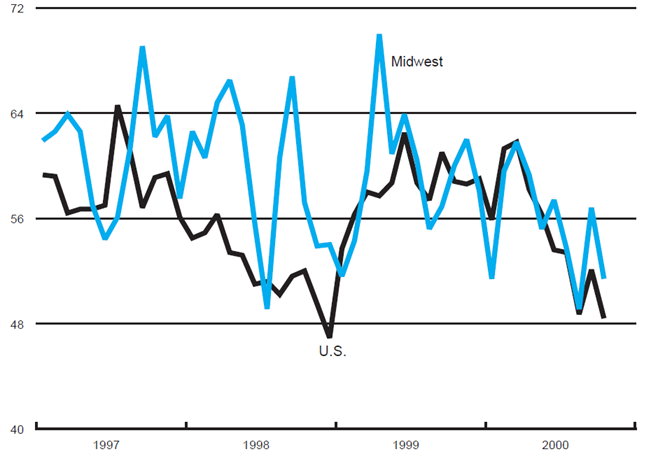
The Midwest purchasing managers’ composite index (a weighted average of the Chicago, Detroit, and Milwaukee surveys) for production decreased to 51.4% in October from 56.8% in September. The purchasing managers’ index increased in Detroit but declined in both Chicago and Milwaukee. The national purchasing manager’s survey decreased from 52.1% to 48.4% during this period.
The Chicago Fed Midwest Manufacturing Index (CFMMI) rose 0.2% from August to September, reaching a seasonally adjusted level of 167.5 (1992=100); revised data show the index was at 167.2 in August. The Federal Reserve Board’s Industrial Production Index for manufacturing (IP) increased 0.3% in September. Auto production decreased from 5.8 million units in September to 5.2 million units in October, and light truck production also decreased from 6.9 million units in September to 6.7 million units in October.
Notes
1 All statistics on aggregate activities of banks were obtained from the Federal Deposit Insurance Corporation’s website http://www.fdic.gov.
2 For instance, see Roger W. Ferguson, Jr., 2000, “Community banks: Opportunities and challenges in the ‘post modernization era,’” remarks before the Independent Community Bankers of America, Washington, DC, May 22; Alan Greenspan, 2000, “Evolving challenges for bankers and supervisors,” remarks before the National Association of Urban Bankers, Urban Financial Services Coalition, San Francisco, CA, May 25; and John Reosti, 2000, “Small banks leaning more on brokered deposits,” American Banker, Vol. 165, No. 190, October 3, p. 1.
3 The differences between the growth rates of core and total deposits at small and large banks are statistically significant at the 5% level.
4 See Anil K Kashyap and Jeremy C. Stein, 1995, “The impact of monetary policy on bank balance sheets,” Carnegie-Rochester Series on Public Policy, Vol. 42, pp.151–195.
5 The differences in the sensitivity of deposit growth to loan growth at small and large banks are significant at the 1% level. The estimates are from a model of deposit growth in the current period as a function of average loan growth in the previous four quarters, lagged capital ratios, lagged loan loss reserves, current state-level economic activity, and average one month certificate of deposit rate, using quarterly bank-level data.
6 See Kahsyap and Stein (1995) and Anil K Kashyap and Jeremy C. Stein, 2000, “What do a million observations on banks say about the transmission of monetary policy,” The American Economic Review, Vol. 90, No. 3, pp. 407–428.
7 See Mitchell Berlin and Loretta J. Mester, 1998, “On the profitability and cost of relationship lending,” Journal of Banking and Finance, Vol. 22, Nos. 6–8, pp. 873–897; and Mitchell Berlin and Loretta J. Mester, 1998, “Deposits and relationship lending,” Review of Financial Studies, Vol. 12, No. 3, pp. 579–607.


