

The following publication has been lightly reedited for spelling, grammar, and style to provide better searchability and an improved reading experience. No substantive changes impacting the data, analysis, or conclusions have been made. A PDF of the originally published version is available here.
The auto industry is quite concentrated geographically, with the Seventh District being home to about 37% of the industry’s light vehicle output. The industry is also known for being highly cyclical, a characteristic it shares with most other durable goods industries. However, during the last decade or so, the auto sector has undergone a number of structural changes. This Chicago Fed Letter identifies these changes and discusses how they might affect the industry’s and possibly the region’s response to a slowdown in economic activity.
By some measures, the auto industry’s spatial concentration has even increased over the last 20 years, as coastal light vehicle assembly plants have mostly shut down and new plants have opened in the heart of the country. The core of the industry, generally referred to as the auto corridor, encompasses a fairly compact region that extends from Detroit west to Chicago and south to Tennessee. It is home to approximately two-thirds of the industry’s plants and employment (see figure 1). Within that region, independent supplier plants in turn are more dispersed than company-owned parts plants, which tend to concentrate in southern Michigan as well as northern Ohio and Indiana. In addition, supplier plants that have opened since 1980 are concentrated more in the corridor’s southern half, as well as in nonmetropolitan counties, than older plants.
1. Auto corridor’s share of the industry, 1997
| % plants | % employment | |
| Light vehicle assembly and captive suppliers | 72 | 70 |
| Independent suppliers | 68 | 60 |
Note: Auto corridor defined as Illinois, Indiana, Kentucky, Michigan, Ohio, Tennessee, and Wisconsin.
Source: ELM database; state manufacturing directories.
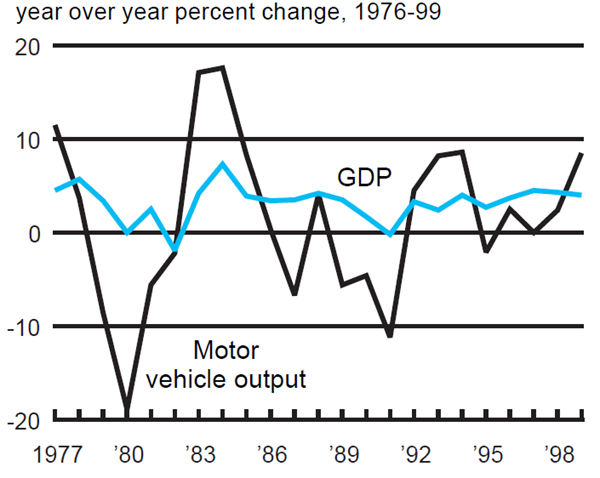
Figure 2 illustrates the industry’s cyclical nature. Graphing the annual growth rate of real gross domestic product (GDP) as well as the annual growth rate of motor vehicle output for the last 20 years, the figure clearly shows the amplitude of the motor vehicle cycle to be higher than that of the GDP cycle.
2. Annual change in output
Changing supply chain
Most prominent among structural changes within the industry ranks the widespread application of lean—or just-in-time—manufacturing, with its emphasis on streamlining and improving linkages across the supply chain. Instead of organizing production according to a preset schedule, lean manufacturing operates on the premise of a so-called pull system, whereby the flow of materials and products through the various stages of production is triggered by the customer. As a result, inventory buffers within the production system are much smaller today than they were even ten years ago. Showcasing the extent of these tight linkages, in summer 1998 a strike at two of General Motors’ (GM) own component plants shut down virtually its entire network of assembly plants in North America within three weeks.
This reduced level of inventories, both within assembly plants and along the entire supply chain, is expected to influence the industry’s response to a sales slowdown.
Specifically, such tighter production linkages would affect the industry’s cyclicality in two ways. First, they would increase the speed at which slower sales would work their way back through the entire production chain simply because of the widespread elimination of inventory buffers. In other words, having demand and its fluctuations more closely linked to the supply chain would reduce the extent of unplanned inventory building at the various stages of the production process. Second, tighter production linkages would seem to reduce the industry’s cyclicality, because they leave less opportunity for inventories to build up and, thereby, amplify initial changes in demand into larger changes in production.
In addition to tightening the supply chain, the industry has moved to an environment in which a larger share of the input to the automobile is produced by independent suppliers, as opposed to assembler-owned facilities. Along with that change came a greater reliance by assembly companies on a relatively small number of so-called first-tier suppliers, i.e., companies that interact directly with the assembler. Hence, the fortunes of assembler and supplier companies have become more strongly linked in the wake of implementing such a streamlined supply chain. Thus, the recent brief shutdown of several Ford assembly plants in conjunction with the Firestone tire recall rather quickly led to reduced production and layoffs at some of Ford’s key suppliers.1
To assess the regional impact of production cutbacks in light of today’s industry structure, one not only needs to know the spatial distribution of assembly and supplier plants but also to understand in some detail the nature of the linkages between suppliers and assembly plants. Yet, there is very little information available to document specific production linkages between individual supplier plants and assembly plants. A study that analyzes the spatial distribution of supplier networks of ten individual assembly plants points to a regional rather than local extension of supplier linkages in today’s industry.2 The study suggests that, on average, it is sufficient for a supplier to be within a day’s drive of its assembly plant customers rather than in their immediate vicinity. Tight clustering around assembly plants is observed only for specific parts, such as seats, that disproportionately affect inventory costs. Hence, any assembly plant’s slowdown is likely to have regionwide ripple effects, concentrated within a 400-mile radius, since between half and two-thirds of the plant’s supplier base is likely to be located within this distance.
Implementation of lean manufacturing has also changed the role of assembly plants, the final step in the production of a car or light truck. Plants have become more nimble in terms of their production setup and are now able to produce multiple car models—generally based on a single platform—on the same assembly line. Being able to adjust the product mix without having to shut down the plant enables production at a given assembly plant to respond more quickly to changes in demand and, therefore, makes it less dependent on a single market segment. This ability to quickly adjust the output mix would seem to reduce the unplanned buildup of finished products. This would have the effect of making cyclical downturns less pronounced.
Changing labor force
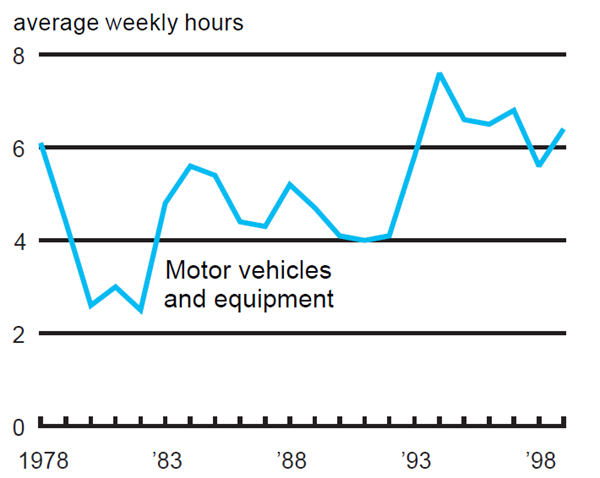
Structural changes also extend to the labor market characteristics of the industry. First, the use of overtime in the industry grew considerably between 1992 and 1994 and has remained at rather high levels since then (see figure 3). That suggests that increases in demand since the mid-1990s have been met to some extent by using existing production facilities more intensively, with a notable number of plants operating on three shifts. Hence, it would seem that the industry is currently in a position to meet a possible sales slowdown with a reduction of overtime rather than an immediate reduction in employment.
3. Production workers’ overtime
Second, and probably of longer-term relevance, the composition of employment between hourly and salaried workers has been changing. During the last 15 years the percentage of white-collar workers among the Big Three has been steadily increasing—to just over 30% in 1999.3 This reflects two underlying trends. First, growth in blue-collar payrolls at assembly companies has been constrained by productivity increases within assembly plants, as well as by the larger extent to which work is now being contracted out to independent suppliers. For example, earlier this year GM broke ground on the second of two new assembly plants to be built in Lansing, Michigan, a location where the company has had a major presence for many decades. The new facility is patterned on GM’s most productive lean facilities. Once completed, it will take up less than half the space and require just under half the number of hourly workers than the plant it replaces.
At the same time, the technology content of a finished vehicle has risen considerably. A standard industry database identifies 21 different types of sensors in cars, ranging from airbag sensors to temperature sensors.4 One of the most interesting applications has been the transformation of the rear-view mirror into a high-tech part.5 Today, mirrors are available that dim automatically when bright headlights shine from behind. That is being done by combining a light sensor with a film of electrochromic material. While this is a far cry from the way we tend to think of mirrors, leading suppliers are trying to pack even more technology into the mirror by making it the portal for in-car communications. Such increases in the share of technology content raise the share of white-collar workers required to engineer and produce vehicles. If past experience is any guide, this development is likely to dampen the industry’s cyclicality, since blue-collar jobs tend to be more exposed to the industry’s cycles than white-collar jobs.
The increasing share of white-collar jobs is not necessarily restricted to assembly companies. Tier 1 suppliers are now performing a larger share of design and engineering of the vehicle as opposed to bidding on contracts for prespecified parts. This requires them to have a larger research and engineering staff in-house. However, these trends are much harder to document for the supplier industry, which is notoriously hard to track in general.
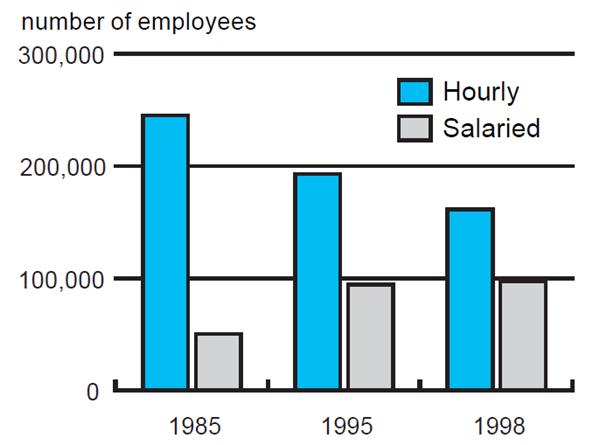
To address the regional effects of the changing workforce, one needs to keep in mind that not all states within the auto corridor are exposed to the auto industry in the same degree or form. For example, Michigan continues to be the mainstay of the industry. Figure 4 shows that four of the five auto corridor counties with the highest auto employment are located in southeastern Michigan. However, the underlying structure of Michigan’s auto sector has changed as well. The Big Three have shed almost 60% of their hourly employment in the state since 1985. At the same time, the number of salaried employees has almost doubled (see figure 5).6 Yet Michigan’s role as a center for white-collar employment in the industry is not restricted to the assembler companies.
4. Top 5 auto counties, 1997
| State | County | Employees |
| Michigan | Wayne | 62,594 |
| Michigan | Macomb | 43,312 |
| Michigan | Oakland | 34,832 |
| Michigan | Genesee | 32,630 |
| Indiana | Madison | 26,917 |
5. Big 3 Michigan employment
According to a list published earlier this year by the trade weekly, Automotive News, half of the 150 largest auto parts supplier companies are headquartered in Michigan. On balance, this suggests that despite the industry’s continued concentration in the state, next time Detroit sneezes, the cold Michigan catches won’t be quite as severe.
Conclusion
The auto industry has undergone a number of structural changes during the last 20 years. It seems that, on balance, these developments would tend to alter the industry’s response to a slowdown by making it somewhat less cyclical. What is harder to gauge is the regional impact of a sales slowdown, given the new structure of the industry. At a regional level, the industry certainly seems as spatially concentrated as it has been for a long time. Due to the spatial characteristics of supplier networks, the ramifications of a slowdown might be less local within the auto corridor than, say, 20 years ago. However, automobiles are durable goods and, as such, are subject to larger fluctuations than the overall economy (see figure 2). Finally, any analysis of the likely effects of a sales slowdown hinges critically on the specific characteristics of such a slowdown, such as its duration, the number of market segments it affects, and its underlying drivers. The range of possible scenarios is very wide, as indicated by the variation in the capacity utilization for the industry during the last two decades: Capacity utilization reached a low of 53.5% in 1982 and a high of 88.1% in 1999.
Tracking Midwest manufacturing activity
Manufacturing output indexes (1992=100)
| August | Month ago | Year ago | |
|---|---|---|---|
| CFMMI | 166.9 | 168.0 | 156.0 |
| IP | 151.3 | 151.2 | 142.5 |
Motor vehicle production (millions, seasonally adj. annual rate)
| September | Month ago | Year ago | |
|---|---|---|---|
| Cars | 5.9 | 5.7 | 5.8 |
| Light trucks | 7.0 | 6.7 | 6.9 |
Purchasing managers' surveys: net % reporting production growth
| September | Month ago | Year ago | |
|---|---|---|---|
| MW | 56.8 | 49.1 | 56.9 |
| U.S. | 52.1 | 48.7 | 61.0 |
Motor vehicle production (millions, seasonally adj. annual rate)
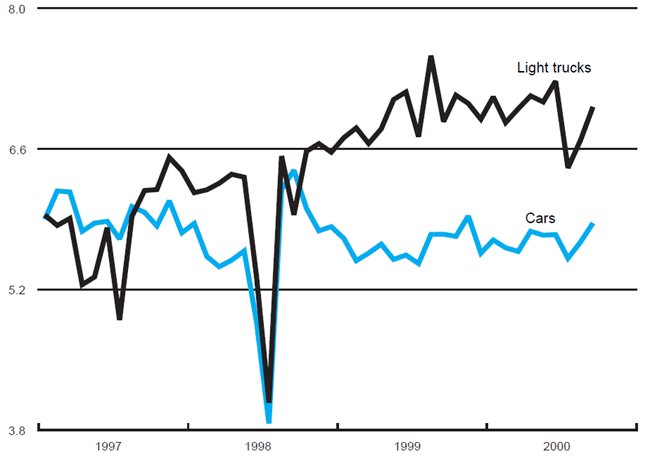
Light truck production increased from 6.7 million units in August to 7 million units in September. Car production also increased from 5.7 million units in August to 5.9 million units in September.
The Chicago Fed Midwest Manufacturing Index (CFMMI) fell 0.6% from July to August, reaching a seasonally adjusted level of 166.9 (1992=100). Revised data show the index was at 168.0 in July and had risen 0.1% from June. The Federal Reserve Board’s Industrial Production Index for manufacturing (IP) increased 0.1% in August and July. The Midwest purchasing managers’ composite index (a weighted average of the Chicago, Detroit, and Milwaukee surveys) for production increased to 56.8% in September from 49.1% in August. The index increased in Chicago and Detroit but declined slightly in Milwaukee. The national purchasing manager’s survey increased slightly from 48.7% to 52.1% during this period.
Notes
1 See Micheline Maynard, 2000, “The automotive ecosystem proves fragile,” New York Times, September 24, p. BU 8.
2 Thomas Klier, 1999, “Agglomeration in the U.S auto industry,” Economic Perspectives, Federal Reserve Bank of Chicago, Quarter 1, pp. 18–34. See also Geoffrey J. D. Hewings, Graham R. Schindler, and Philip R. Israilevich, 1998, “Interstate trade among Midwest economies,” Regional Economics Applications Laboratory and Federal Reserve Bank of Chicago, May.
3 According to data cited in a presentation by Sean McAlinden at the seventh annual outlook symposium, Federal Reserve Bank of Chicago, Detroit, June 2, 2000.
4 Data on sensors from ELMGuide supplier database, 1997.
5 See Norihiko Shirouzu, 2000, “High-tech hotbed for carmakers: Lowly mirror,” Wall Street Journal, August 24, p. B1.
6 This probably overstates Michigan’s reduced exposure to hourly auto employment as supplier employment has grown relative to assembler employment in light of increased outsourcing.


