

The following publication has been lightly reedited for spelling, grammar, and style to provide better searchability and an improved reading experience. No substantive changes impacting the data, analysis, or conclusions have been made. A PDF of the originally published version is available here.
Much of the credit for the U.S’ record-breaking economic expansion and productivity surge has been attributed to technological advances, particularly within information technology (IT) industries or in the application of these technologies to other industry sectors. While the so-called new economy is benefiting all U.S. regions, the level and character of IT / high-tech (IT / HT) development varies widely from one region to another. This Chicago Fed Letter examines regional measures of IT / HT presence and their implications for regional growth.
Measuring IT / HT regions
A look at the history of U.S. regional growth shows that IT / HT presence has been a poor indicator of the future growth and success of regional economies. During the high-tech boom of the 1980s, most regions sought to emulate the computer hardware boom in California’s San Jose area and the Route 128 area of Boston, as well as the aerospace activity of southern California. However, tech-intensive regions such as the Boston area and defense-laden Los Angeles foundered badly in the late 1980s and early 1990s. At the same time, a few new areas such as Austin, Texas, and Sioux City, Iowa–Nebraska, proved successful in emulating computer hardware success. Other regions proved highly successful in unexpected ways. For example, a partially unforeseen boom in computer software boosted the Seattle and Denver regions. And the lower-tech Midwest astounded everyone with its competitive revival in old-line manufacturing. Later in the 1990s, Los Angeles successfully filled a demand for entertainment content in video, cable television, and on the web, even as its aerospace industry continued to languish. All these success stories involved technology, especially information technology. But the high-tech measures of yesteryear offered little if any insight into future regional success and failure. To improve the predictive power of IT / HT measures, we need to examine whether the existing measures adequately capture technology’s far-reaching impact across many sectors of the economy.
What have been the most common indicators of regional high technology? A commonly used definition is the production of those high-tech goods and services, such as computers and telecommunication services, that practically everyone would consider to be high tech. For example, the widely reported American Electronics Association (AEA) study classifies industries—both service industries and manufacturing—as being high tech and tabulates the concentration of employment within U.S. regions. According to their definition, the Mountain region had the highest intensity of its workforce in high-tech industry categories, accounting for approximately 6% of its total nonfarm employment in 1998, followed by the New England and Pacific regions.1 The Midwest ranks eighth out of the nine Census districts in the concentration of total jobs classified as high tech, although it ranks fourth in absolute number of jobs (see figure 1). The region accounts for over 16% of the nation’s total payrolls, yet just over 12% of jobs in high-tech industries as defined by AEA. While the Midwest remains the most manufacturing-intensive region in the U.S., it has a (relatively) higher concentration of its services in high-tech categories than of its manufacturing.
1. AEA employment measures, 1998
| Region | HT Workers per 1,000 |
Region | HT employment (000s) |
| Mountain | 60 | Pacific | 962.2 |
| New England | 43 | South Atlantic | 758.5 |
| Pacific | 38 | Mid Atlantic | 659.9 |
| Southwest | 28 | Midwest | 555.4 |
| South Atlantic |
27 | Southwest | 450.5 |
| Plains | 27 | New England | 355.2 |
| Mid Atlantic | 26 | Mountain | 324.6 |
| Midwest | 22 | Plains | 309.6 |
| Southeast | 15 | Southeast | 135.6 |
Among Midwest states, Illinois had the highest number of high-tech jobs, 218,000, ranking fourth in the AEA study behind California, Texas, and New York, and slightly ahead of Massachusetts. Illinois has become one of the lesser states in overall manufacturing concentration—both high tech and otherwise—but it achieves a strong high-tech concentration due to the Chicago area’s high concentration in communications services industries.
The Chicago area is not alone in its high-tech concentration. A recent study estimated that U.S. metropolitan areas accounted for 94% of the nation’s IT / HT output in 1999, exceeding their 80% share of overall income and total employment. Technology and ideas flow most readily among companies, entrepreneurs, and workers who reside and work in proximity. Apparently, older cities, as well as new ones, may thrive in the new economic landscape—as New York City’s successful “silicon alley” collection of software and internet configuration / content firms illustrates. Importantly for regional policymaking, the well-documented tendency of high-tech regions to perpetuate themselves—due to the spatial proximity of similar and complementary activities—is strong. IT / HT workers tend to gravitate toward existing urban concentrations of IT / HT activity because they are most likely to hear of better job opportunities in such places and to be more mobile in transitioning from job to job. Entrepreneurs find it advantageous because “new ideas are in the air,” because the specialized support services such as venture capital are proximate, and because it is easier to find specialized workers. This means that the San Jose–Silicon Valley phenomenon is unlikely to be easily replicated.
Nonetheless, some spatial spread of the new economy along a subset of industries and dimensions is now taking place. As the new economy has evolved toward information transmission, development of information content, and application of new technologies to old-line industries, certain segments of the service sector have become high-growth sectors, displacing some of the former importance of hardware manufacturing and systems software production. The software applications boom was the initial manifestation of this trend, followed by businesses producing informational content and systems for the trading of information and goods / services over the worldwide web. As evidenced by the booming internet configuration and application sectors in the economies of San Francisco, Los Angeles, New York, and Chicago, information technology has begun to move out of the domain of a small number of large hardware and software companies to business consulting companies, old economy adapters of new technologies, and entirely new companies or industries that seek to exploit the value added of the internet.
Industry or activity?
The rapid evolution of new industries arising from technological change points up deficiencies in analyzing the regional presence of the new economy based on particular industries. Although there are the obvious high-tech goods and services, such as digital phones and wireless web services, there are also many hybrid industries, as well as old-line industries now undergoing technological transformation, for example, management consulting, some types of retail, new logistics management businesses, and manufacturing of standard products using advanced processes.
One notable example for the Midwest is the automobile industry. At first blush, we might not think of motor vehicles as high-tech goods. But modern vehicles are equipped with a range of high-tech devices, such as on-board computers that monitor the function of the engine, sensors that detect when one wheel is slipping and transfer power to another, and global positioning systems that provide driving directions. So, too, auto manufacturing has pioneered production processes such as just-in-time auto assembly and supply chain management. However, the automobile industry is not included in the AEA’s compilations.
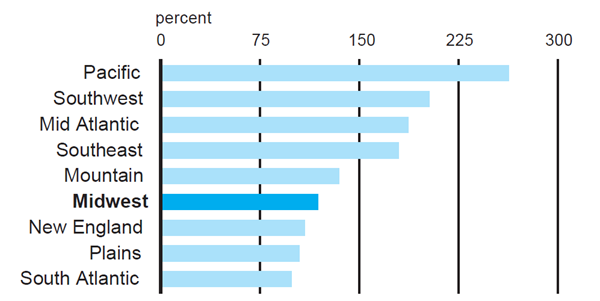
A recent study by the Michigan Economic Development Corporation (MEDC) and the Michigan Automotive Partnership points out just how sensitive such estimates can be. The study uses a more comprehensive definition of high-tech industries derived by the U.S. Department of Labor that includes the automobile and aerospace industries. (The Labor Department definition of high tech is based in large part on research and development performed by an industry.) When the more comprehensive definition is used, Michigan’s ranking in high-tech employment jumps from 17th in the nation to fourth. At the same time, the Midwest region’s employment concentration rank in high-tech industries rises from eighth out of nine to third, largely due to the heavy Midwest presence in automotive production (figure 2).
2. MEDC employment measures, 1998
| Region | HT Workers per 1,000 |
Region | HT employment (000s) |
| New England | 97 | Midwest | 1,950.7 |
| Pacific | 92 | Pacific | 1,713.1 |
| Midwest | 91 | South Atlantic | 1,550.1 |
| Southwest | 75 | Mid Atlantic | 1,272.3 |
| Mid Atlantic | 73 | Southwest | 933.6 |
| Mountain | 71 | Plains | 663.8 |
| Plains | 69 | New England | 652.2 |
| South Atlantic | 66 | Mountain | 566.4 |
| Southeast | 63 | Southeast | 464.3 |
The auto industry also demonstrates how defining a region’s tech intensity by its concentration of entire industries rather than by industrial activities can sometimes be misleading. That is because the various activities that take place within a single industry sector are often distinct in their degree of reliance on technology, as well as disparate in location. Consider research and development (R&D) activity, which gives an indication as to the amount of technology that goes into a product. While an emphasis on R&D in defining high-tech industries may make sense on a national scale, it may be less useful at the regional level. This is because production is not necessarily located where product development takes place. Thus, much of the auto industry’s R&D continues to take place in the Midwest, especially in Michigan, while automotive production has clearly decentralized to other states, such as Kentucky, South Carolina, and Tennessee, as well as to other countries. Therefore, Michigan’s argument for inclusion of the auto industry as a technology producer may be valid; whereas, such an argument for Tennessee may be less so.
Both the rapid evolution of industries and the problems of defining the high-tech industries suggest that broader or cross-industry indicators of regional economy IT / HT may be insightful. In contrast to its low AEA rankings by IT / HT employment, Michigan spends more on R&D for each dollar of gross state product than any other state, helping the Midwest to rank third among U.S. regions (see figure 3). In addition to the R&D intensity by location illustrated above, it is often instructive to look at the occupational intensity of regions across all industries for those occupations that tend to be associated with technological pursuits and activities. For example, according to National Science Foundation estimates, the Midwest ranks seventh in the concentration of scientists and engineers (figure 4). Patent data may also add insight to a region’s production of new ideas across all its industry sectors and activities. The Midwest states were issued 16,049 patents in 1999 (figure 5), or 17% of the national total. Only the Pacific region, with 25% had a higher share. One caveat to these data is that not all ideas and processes are patented, possibly because their usefulness is not outlived by the patent process gestation or because their proprietary nature may be easily preserved without formal patenting.
3. Industry R&D spending, 1997
| Region | R&D per $1,000 GSP |
Region | Total R&D (000s) |
| Pacific | 31 | Pacific | 41,834 |
| New England |
28 |
Midwest | 29,249 |
| Midwest | 23 | Mid Atlantic | 27,617 |
| Mid Atlantic | 21 | South Atlantic |
23,289 |
| Mountain | 19 | New England | 12,999 |
| South Atlantic |
17 | Mountain | 8,767 |
| Plains | 12 | Southwest | 7,983 |
| Southwest | 9 | Plains | 6,250 |
| Southeast | 5 | Southeast | 2,110 |
Source: National Science Foundation and the U.S. Bureau
of Economic Analysis.
4. Scientists and engineers, 1997
| Region | Per 1,000 workers |
Region | Total (000s) |
| New England | 120 | Pacific | 1,974.6 |
| Pacific | 107 | South Atlantic |
1,912.7 |
| Mid Atlantic | 94 | Mid Atlantic | 1,646.8 |
| Mountain | 85 | Midwest | 1,537.2 |
| South Atlantic |
82 | Southwest | 888.8 |
| Plains | 76 | New England | 803.1 |
| Southwest | 72 | Plains | 723.7 |
| Midwest | 72 | Mountain | 669.7 |
| Southeast | 55 | Southeast | 407.7 |
5. Patents by region, 1999
| Region | Patents per $bil. GSP |
Region |
Total patents |
| Pacific | 16 | Pacific | 22,442 |
| New England | 16 | Midwest | 16,049 |
| Mountain | 14 | Mid Atlantic | 15,341 |
| Midwest | 12 | South Atlantic |
10,647 |
| Mid Atlantic | 12 | Southwest | 7,707 |
| Plains | 11 | New England | 7,387 |
| Southwest | 9 | Mountain | 6,527 |
| South Atlantic |
8 | Plains | 5,686 |
| Southeast | 5 | Southeast | 2,211 |
Source: U.S. Patent Office.
Finally, there is a wide body of opinion that the source of the new economy’s success lies not with tech intensity and leadership per se, but rather with the underlying characteristics of the U.S economic system and its regional variants. With highly developed and specialized capital markets, new ideas can make their way to market, and the rewards of risk and innovation can accrue to their originators, thereby encouraging progress and change. Entrepreneurship is the buzzword of the day, but behind this phenomenon, a fertile infrastructure of institutions, law, and culture makes possible rapid growth from new technologies, as well as growth that arises from changes in consumer preferences, behavior, and firm / industry organization. Deregulation of the old-line telephone industry, beginning in the 1970s, paved the way to today’s entirely revamped telecommunications industry. More recently, the deregulation of electric power in some states, combined with new technologies of fuel cells and gas turbines, is sparking new industry growth. How, then, can we measure and identify entrepreneurial activity and climate by region? As a measure of activity, investment flows may be the most inclusive and broad indicator, namely those of the venture capital industry, which funds early-stage industries and innovations before such businesses approach highly structured equity markets. Accordingly, regional policymakers now eagerly track the trends in placement of venture capital as an indicator of the emergence of new industrial activity. The Midwest is sharing in a surge of such investment (figure 6). Even so, this surge appears to be little more than part of a national phenomenon; the Midwest’s share of such investments is not gaining on other regions (figure 7). Still, who can say what new industries or industry segments may arise from Midwest placements of venture capital?
6. Growth in venture capital, 1997–99
7. Venture capital, 1997
| Region | Dollars per $10,000 GSP |
Region |
Total ($mil.) |
| Pacific | 37 | Pacific | 5,075 |
| New England | 31 | New England | 1,469 |
| Mountain | 13 | South Atlantic |
1,369 |
| South Atlantic |
10 | Mid Atlantic |
1,125 |
| Mid Atlantic | 9 | Southwest | 744 |
| Southwest | 9 | Mountain | 630 |
| Plains | 7 | Midwest | 542 |
| Midwest | 4 | Plains | 393 |
| Southeast | 4 | Southeast | 168 |
Source: PriceWaterhouseCoopers.
Conclusion
Technological change continues to have startling implications for the national economy, as well as for states and regions. Currently, the IT boom and related productivity revival have refocused regional policy leaders to thinking about how to position their regions to thrive in the new economy. As past experience and technology rankings suggest, there are no easy answers as to which regions will succeed or how they should focus their policies and resources. Looking at how technology is changing the global marketplace, regional policymakers may do well to consider what role technology and entrepreneurial climate play in their home economics. How can a region’s human and physical assets, industrial concentrations, and business environment be parlayed into a successful economy going forward? We believe that because of the inherent advantages of proximity for some IT/HT activities, not all regions can become the hotbeds of rapid new economy growth that they hope to be.
However, the new economy has many dimensions, offering alternative avenues for regional growth and development. In setting a course for successful adaptation to a changing economic landscape, each region may benefit from identifying, and then further developing, its own particular assets and opportunities.
Notes
1 The regions discussed in this article are defined as follows: Midwest—IL, IN, MI, OH, and WI; New England—CT, MA, ME, NH, RI, and VT; Mid Atlantic—NJ, NY, and PA; South Atlantic—DC, DE, FL, GA, MD, NC, SC, VA, and WV; Southeast—AL, KY, MS, and TN; Southwest—AR, LA, OK, and TX; Plains—IA, KS, MO, MN, ND, NE, and SD; Mountain—AZ, CO, ID, MT, NM, NV, UT, and WY; and Pacific—AK, CA, HI, OR, and WA.


