Reflections on the Current Monetary Policy Environment
Introduction
Good morning and thank you. It is a pleasure to be here.
Today, I would like to briefly give you my outlook for the U.S. economy before discussing some long-term economic trends and my views of appropriate monetary policy. Let me note that my comments will reflect my own views and do not necessarily represent those of my colleagues on the Federal Open Market Committee (FOMC) or within the Federal Reserve System.
I will start my remarks with a discussion of my relatively optimistic outlook for the U.S. economy. I’ll then talk about some underlying structural trends that imply that both growth and real interest rates in the U.S. will likely be lower in the long run than we thought they would be just a couple of years ago. I’ll finish with my views of appropriate monetary policy in the U.S.
Let me now turn to my outlook for the U.S. economy.
U.S. Economic Outlook
I anticipate U.S. gross domestic product (GDP) will grow in the range of 2 to 2-1/2 percent over the remainder of this year. After the sluggish first-quarter annualized growth rate of 0.8 percent is accounted for, this would leave the increase in GDP for 2016 as a whole close to 2 percent — or about the same pace as in 2015.
The U.S. consumer is the linchpin behind this relatively optimistic outlook. True, consumer spending was somewhat soft last winter, but it rebounded quite a bit in April and what little data we have for May were positive. The most important factor supporting household spending is the substantially improved labor market in the U.S. Over the past two years, the unemployment rate has fallen to 5 percent, half its 2009 peak; and job growth has averaged 233,000 per month. These gains have raised incomes and buoyed confidence over future job prospects. Lower energy prices and accommodative monetary policy have provided additional support to the spending wherewithal of households. All of these factors should continue to generate solid increases in consumer spending — particularly given my assumption that interest rates will stay quite low for some time.
There are, however, several factors weighing on economic activity in the U.S. The slowdown in global economic growth — notably in emerging market economies — and uncertainty about international prospects have contributed to a rising dollar and declining commodity prices since mid-2014. The trade-weighted dollar has appreciated about 20 percent since June 2014, while oil prices are down more than 50 percent over the same period. U.S. firms that sell their products in global markets and those exposed to commodity markets have felt the brunt of these relative price movements. All told, net exports have made noticeable negative contributions to U.S. growth in the past two years.
Uncertainties over foreign prospects also have at times contributed to heightened volatility and some elevation in risk premia in U.S. financial markets. The associated tightening in credit conditions have weighed on domestic spending. Notably, in addition to falling energy prices and the rising dollar, tighter U.S. financial conditions probably contributed to especially weak business capital expenditures in late 2015 and early 2016.
Since last winter financial markets have calmed down and credit spreads have retreated; oil prices have stabilized; and the dollar has depreciated a bit. Of course, we need to keep in mind that to some degree this welcome reduction in headwinds was influenced by monetary policy communications — a point I will return to later this morning.
Adding things up, I see growth in the U.S. recovering from the tepid first quarter and increasing in the range of 2 to 2-1/2 percent for the remainder of 2016 and in 2017. For reference, this pace is modestly stronger than my assessment of the underlying growth trend and should therefore support continued reduction in labor market slack.
I should note, though, that I see the balance of risks to this outlook as weighted to the downside. True, the solid labor market and continued low energy prices could lead to stronger household spending than expected — with attendant spillovers to other components of domestic demand. But the downside risks — notably that the international situation could deteriorate more than expected and related movements in the dollar and financial conditions could weigh more heavily on domestic spending — seem more likely to me. Also, I don’t see other sectors of spending picking up the slack if for some reason the U.S. consumer were to falter.
The U.S. Congress has mandated that the Federal Reserve foster economic conditions with the aim of promoting two economic goals — maximum employment and price stability. As a monetary policymaker, I think it is important to benchmark the economy’s performance relative to these goals. So how are we doing?
Along with most of my colleagues on the Federal Open Market Committee, I judge that an unemployment rate that averages somewhat under 5 percent over the longer run is consistent with the Federal Reserve’s maximum employment mandate. The current unemployment rate is 5 percent. However, other measures — subdued wage growth being a particularly important one — suggest that some slack remains in the labor market. Let me be clear: We have made tremendous progress. But I’m not completely confident that we have met our employment objective just yet, and probably won’t be until the unemployment rate is modestly below its long-run normal level. Now, given my outlook for growth, I expect the unemployment rate will edge down to between 4-1/2 and 4-3/4 percent by the end of next year. So, I do think the FOMC’s employment objective is within sight.
How about the inflation objective? Well, the performance on this leg of the dual mandate has not been as good. In January 2012 the FOMC set 2 percent inflation — measured by the annual change in the Price Index for Personal Consumption Expenditures (PCE) — as the explicit inflation target consistent with our price stability mandate.1 However, over the past eight years, PCE inflation has averaged only 1.5 percent. To get a sense of where total inflation is likely to be headed over the next year or so, I prefer to strip out the volatile and transitory food and energy components and look at so-called core inflation. Core PCE inflation also has run well below 2 percent for quite a long time. We did see some higher readings on core inflation early this year, but the last couple of monthly numbers were more subdued. Still, on a year-over-year basis, core inflation was 1.6 percent in April; that’s up from the 1.3 percent pace that prevailed through most of last year. I am encouraged by this development, but not satisfied — we still have a way to go before we are back to target.
I am projecting core inflation to end 2016 at 1.6 percent. Further ahead, I see both core and total inflation moving up gradually to approach our 2 percent inflation target within the next three years. This path reflects the dissipating effects on consumer prices of earlier declines in energy prices and the appreciation in the dollar as well as the influence of further improvements in labor markets and growth in economic activity.
However, as with growth, I see downside risks to the outlook for inflation. The recent pickup in core inflation could prove to reflect more temporary volatility than I have assumed (we saw this happen in 2012). Or international developments may result in further declines in energy prices or greater appreciation of the dollar. Most worrisome to me is the risk that inflation expectations might drift lower. Here, I find it troubling that the compensation for prospective inflation one can glean from a number of financial asset prices has fallen considerably over the past two years. More recently, some survey-based measures of inflation expectations, which had previously seemed unmovable, edged down to historically low levels. True, financial market inflation compensation and some survey measures of inflation expectations have risen a bit of late, but they still remain quite low.
To recap, I expect the U.S. economy to grow at a moderate pace over the next couple of years. This growth will be primarily driven by further increases in household spending. I also expect to make additional progress toward our 2 percent inflation target. While I see this path for the U.S. economy as the most likely outcome, there are a number of downside risks to my outlook for both growth and inflation.
Before discussing the implications of this forecast for my views on appropriate monetary policy, let me put my growth outlook in a longer-run context.
My Growth Forecast in Longer-Run Context
By historical standards, my forecast of real GDP growth in the range of 2 to 2-1/2 percent might not seem particularly optimistic. It’s in line with the average pace of growth since 2009, which is about 2-1/4 percent. By comparison, over the previous three expansions, real GDP growth averaged closer to an annual rate of 3-1/2 percent. The decline from 3-1/2 percent growth to 2-1/4 percent makes one sit back and take notice. What’s going on? Why has growth in real activity been so subdued in the current expansion?
For one thing, the financial crisis and the ensuing Great Recession had far-reaching negative effects. You are all too well aware of these scars. With the support of accommodative monetary policy, these impediments to growth have been slowly dissipating. Nonetheless, I think these and other headwinds will take some more time to fade away completely.
In addition, as I survey the economic landscape, I see other factors that could hold growth back even after these impediments recede. Broadly speaking, an economy’s long-run growth potential depends upon increases in its available productive resources and the technological improvements that enable those resources to produce more. The trend for neither looks particularly favorable.
The most important productive resource is labor. Here, demographics are working against us. The U.S. Census Bureau projects that over the next ten years the population aged 16 and over will grow perhaps 0.4 percentage point per year slower than it did between 1990 and 2010. And the share of the population participating in the labor force has been trending down since around 2000 after rising steadily for the previous 35 years. Moreover, increases in educational attainment and workforce experience are rising more slowly than in the 1980s and 1990s.2 For all of these reasons, we are likely in the midst of a slowdown in growth of the effective labor input into the aggregate production function for the U.S. This translates directly into slower growth in potential output.3
Economic growth over the longer run also depends upon technological progress. By one carefully estimated measure — made by John Fernald at the San Francisco Fed and his co-authors — the underlying trend in total factor productivity (TFP) growth has declined from 1.8 percent during the productivity boom of the mid-1990s through the mid-2000s to a mere half a percent today.4 That is in line with the period of low productivity growth from the 1970s through the mid-1990s. Some economists, such as Robert Gordon (2012) at Northwestern, think that the slowdown in trend productivity growth possibly is here to stay. Gordon argues that the search for transformative technologies that spurred productivity and economic growth in the past has become increasingly costly and more difficult to harvest: We have already picked the low-hanging fruit.
Not everyone subscribes to this view. Rapid advances in the field of medicine and in energy production are two examples of where we have seen huge productivity improvements. It may be that transformative innovations are being created today, but have yet to make their way through the pipeline to show up as measurable increases in factor productivity. We’ll have to wait and see.
Productivity and potential output growth are also influenced by the amount and quality of the capital that workers use in the production of goods and services. Since the recession ended, business investment in structures, equipment and intellectual property has grown somewhat more slowly than in other recent expansions. And when you consider that this comes on the heels of huge declines in investment during the Great Recession, the level of spending and the associated growth rate in the productive capital stock per worker — what we refer to as capital deepening — are very low. This reduced pace of capital formation also translates into lower growth in potential output.
With low interest rates and plenty of cash on hand, firms might be expected to invest more. Instead, businesses are opting to restructure debt or return money to shareholders by issuing dividends or buying back stock. What is going on here?
In my position I have an opportunity to speak to a broad cross section of business executives and learn firsthand about the issues they face. Of course, it’s difficult to generalize, but one persistent theme I hear is that firms feel their productive capacity is about right-sized to the current level of demand and their modest baseline expectations for growth in sales. Another common theme is that businesses are very attentive to what could go wrong with their plans. The greater weight they put on costly downside scenarios, the more reluctant they will be to commit funding to a long-run capital expansion project. Of course, businesses are also going to be less enthusiastic to spend if technological advancement truly has slowed so that new capital won’t be all that more productive than current capacity.
It remains to be seen if the slowdown in productivity growth is temporary or long lasting. That said, the notion that longer-run potential growth is slowing is a view that has been gaining traction. This assessment is reflected to some degree in the economic projections of FOMC participants. In January 2012, FOMC participants assessed the long-run potential growth rate of the economy to be around 2-1/2 percent.5 Today, the median FOMC participant believes that longer-run real GDP growth is only 2 percent. Even the most optimistic of my colleagues places this number at around 2.4 percent.6
When measured against these benchmarks, my forecast of real GDP growth in the range of 2 to 2-1/2 percent in 2016 is simply saying that the economy will expand a bit faster than its longer-run productive capabilities. This number may be disappointing — we would certainly like stronger sustainable growth — but there is nothing much that monetary policy can do about labor force trends or technical progress. Still, these are structural conditions the FOMC must recognize when setting monetary policy.
Lower Potential Growth, Lower Equilibrium Interest Rates
All else being equal, equilibrium real interest rates, which are the rates consistent with fully employed resources, will be lower in an economy with slower potential output growth. In turn, lower real rates imply lower nominal rates when inflation is at its target. So, the equilibrium federal funds rate — which is the funds rate associated with a neutral monetary policy (policy that is neither expansionary nor contractionary) — is lower in an economy with lower potential output growth. Therefore, the FOMC must take estimates of potential output growth into account when calibrating the stance of monetary policy.
There are other reasons why equilibrium interest rates could be lower than they were in the past. For example, former Fed Chair Ben Bernanke has frequently discussed the global savings glut. This refers to the large pools of saving being generated by fast-growing emerging market economies that are seeking safe, profitable opportunities for investment. Not being able to find these in their domestic markets, many investors in such economies are moving funds across their borders, lowering interest rates across the globe. Former Treasury Secretary Lawrence Summers has expanded on this theme, speculating that the lack of investment opportunities reflects in part soft worldwide aggregate demand, which has discouraged structural investment and capital stock growth (his view of the “secular stagnation” hypothesis).
All of these factors imply that the federal funds rate consistent with a neutral stance for monetary policy may be lower than we used to think. How big might the difference be? Well, in March, FOMC participants’ projections for the longer-run nominal federal funds rate were in the range of 3 to 4 percent, with the median projection at 3-1/4 percent.7 Four years ago, when forecasts of potential growth were higher, the Committee was projecting the longer-run fed funds rate would be in the range of 3-1/4 to 4-1/2 percent — about 50 basis points higher than today’s estimates.8 In other words, even after policy has normalized, the federal funds rate will likely end up at a lower level than it has averaged in the past.
What Is Next for Monetary Policy?
I’d now like to talk about what the transition path to that new level might look like.
An important element in Federal Reserve communications is our well-known FOMC dot chart. Quarterly, each of the 17 FOMC participants submits his or her projections of key economic variables, along with assumptions for the appropriate monetary policy path that underlies those forecasts.9 These are published in what is known as the FOMC’s Summary of Economic Projections, or SEP. The dot chart is found in the SEP; each dot shows a participant’s view of the appropriate target federal funds rate at the end of each of the next three years and in the longer run.
The chart I am showing today reflects our views as of last March’s FOMC meeting. The next dot chart will be published after our upcoming meeting on June 14 and 15.
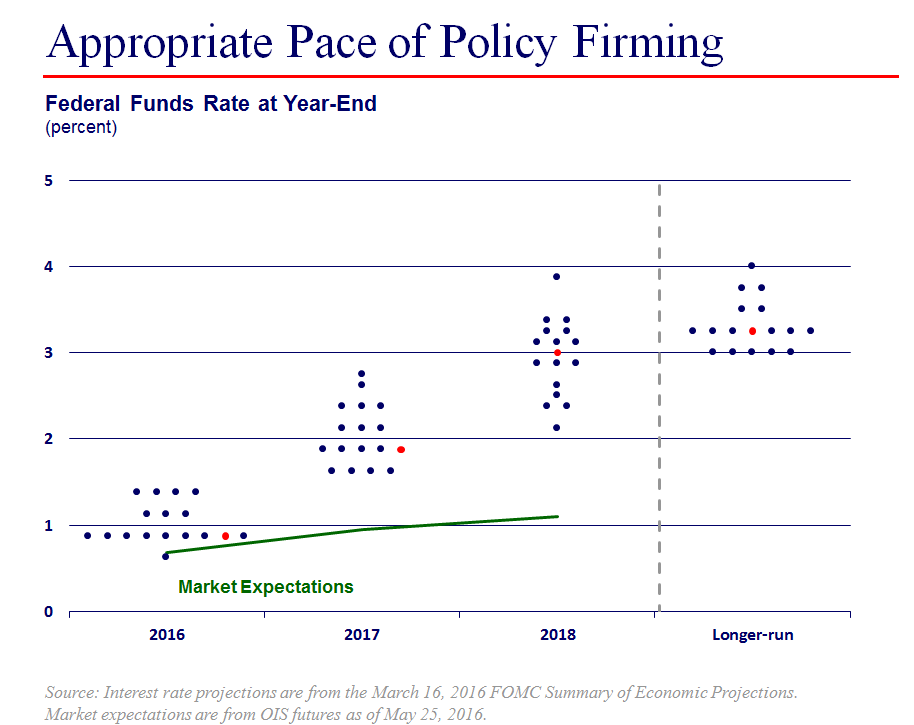
Focus for a moment on the median of the policy projections, indicated by the red dots. In March, the median participant thought two rate hikes would be appropriate over the remainder of this year. The median FOMC participant foresaw an additional 100 basis points or so of tightening in 2017 and again in 2018. By historical standards, this is a very gradual path. It is even slower than the so-called measured pace of increases over the 2004–06 tightening cycle — that was 25 basis points per meeting, or 200 basis points a year.
One reason for this slow adjustment is the view among many participants that the neutral level of the federal funds rate today is even lower than its eventual long-run level that I just discussed. Indeed, by some estimates, given the variety of headwinds faced by the U.S. economy, the equilibrium inflation-adjusted rate is currently near zero. The degree of accommodation in actual policy needs to be judged against this benchmark. So the 75 to 100 basis point range for the nominal fed funds rate at the end of 2016 in the median SEP forecast may not be terribly far from neutral.10 The equilibrium real rate should rise gradually as the headwinds fade over time. And as it does, the benchmark to judge policy accommodation will also rise. But this is likely to be a slow adjustment — even in 2018, the dots aren’t back up to their long-run range, even though the SEP forecasts for unemployment are generally lower than their long-run levels and inflation is projected to be at its 2 percent target.
I now want to spend some time talking about the dispersion in the SEP dots. As you can see, nine participants agreed with the median forecast of two rate increases in 2016. This is a strong consensus.
Still, seven FOMC participants thought the federal funds rate at the end of this year should be higher than the median. As Fed speakers began talking after our April meeting, some news accounts suggested there had been a significant shift in Fed sentiment, as the commentary covering these speakers emphasized arguments for more aggressive tightening than that represented by the median. If you find this confusing, I have a simple piece of advice: Before you infer that the consensus has shifted so quickly, count to seven first!
Clearly, each individual’s policy view depends on his or her baseline forecast and perception of risks to that outlook. Naturally, these forecasts and risks will differ among participants. This is a feature of a healthy policy debate.
Some analysts complain that the dispersion of dots clouds the Fed’s policy message, and some advocate eliminating the dot chart entirely. I disagree. The dots put on full display our robust policy discussions and differences of opinion. This adds value: Since policy assumptions are so critical for economic projections, omitting the dots would be pulling down a curtain to remove from view participants’ broad judgments relating to the range of issues surrounding our policy deliberations. Instead, our transparency conveys important information to the public.
The individual SEP projections are without attribution, so there are many untold stories behind the dots. But an individual’s public discourse often provides a good idea of that particular FOMC participant’s policy rationale. There is also useful information in the portion of the FOMC minutes describing the SEP, including discussion that goes some way toward connecting the dots. So while not perfect, the SEP dot chart and associated commentary provide very useful indications of the range of potential FOMC policy actions. And, in the end, the actual FOMC policy decision reflects a consensus-building process among these different views. Once made, this consensus is clearly communicated in the post-meeting statement, the Chair’s press conference, meeting minutes and speeches by Federal Reserve officials. These tell you where the weight of the Committee stands.
As I mentioned, the chart I’m showing you is from March. The next one will come out after our FOMC meeting two weeks from now. I can’t tell you what that dot chart will look like — the information we’ve received since March could change some participants’ forecasts and risk assessments in a way that will change their views of appropriate policy. But I can talk about how I am thinking about the process. And, frankly, I’m really of two minds at the moment, and I expect to take this quandary with me into the next FOMC meeting.
On the one hand, under the Committee’s current approach to renormalizing policy, I think it may be appropriate to have two 25 basis point moves between now and the end of the year. I see the value in making small and gradual adjustments to the fed funds rate as the data improve and confirm my positive baseline outlook for the U.S. And this is my base-case view of appropriate policy. On the other hand, if I think outside of the baseline, I also think that a reasonable case can be made for holding off increasing the funds rate until core inflation actually gets to 2 percent on a sustainable basis.
Let me explain my thinking behind these two views.
First, let me give the rationale behind supporting two rate hikes this year. As I noted earlier, I see growth picking back up to the 2 to 2-1/2 percent range for the rest of this year and next and inflation gradually returning to target. This is essentially the forecast I had in March and in April, and it is conditioned on a policy path that is broadly consistent with the median portion of the March SEP dot chart.
The FOMC began policy renormalization last December because the Committee judged it had sufficient confidence in continued U.S. growth and in inflation rising to 2 percent over the medium term. These were the preconditions we had set for liftoff. But in March, in the face of strong first-quarter headwinds, it seemed appropriate to delay the next move and monitor developments. Since our March meeting, the data have improved, and two rate increases this year could be viewed as just confirming our earlier expectations for a gradual renormalization conditional on a solid economic outlook with confidence in inflation firming.
I see recent data improvements as largely in line with my March baseline economic forecast. Notably, the pullback in risk spreads and market volatility that have occurred since mid-February provide important support to my outlook for growth. I believe not raising rates in March and April and the FOMC’s communication of a more gradual path for the fed funds rate — communicated importantly by the downward shift in the policy dots between the December and March SEPs — contributed significantly to the improvement in financial conditions. So, any move toward more aggressive tightening than two 25 basis point moves in 2016 would risk undoing these positive developments.
I view risk-management issues to be of great importance today. As I noted earlier, I still see the risks as weighted to the downside for both my growth and inflation outlooks. And given that the fed funds rate is still barely above its effective lower bound, policy is much better positioned to counter unexpected strength than to address downside shocks. So I still judge that risk-management arguments continue to favor providing more accommodation than usual to deliver an extra boost to aggregate demand. Such a boost would provide a buffer against possible future downside shocks that might otherwise drive us back to the effective lower bound.
Focusing more on risk management brings me to a second policy option. One can advance risk-management arguments further and come up with a reasonable case for holding off increasing the funds rate for much longer, namely, until core inflation actually gets to 2 percent on a sustainable basis.
The past several years have been a period of disinflationary pressures around the world. Global monetary policies have responded, albeit with unwelcome delays in some cases. In the U.S., we have experienced an unsatisfactory slow crawl back toward 2 percent inflation. We have a symmetric inflation objective, and we have undershot it for so long that the public’s belief in our commitment to that objective seems under fire — just look at the survey and market measures of long-term inflation expectations. In order to ensure confidence that the U.S. will get to 2 percent inflation, it may be best to hold off raising interest rates until core inflation is actually at 2 percent. The downside inflation risks seem big — losing credibility on the downside would make it all that more difficult to ever reach our inflation target. The upside risks on inflation seem smaller. Currently, financial market bets on core inflation rising above 2-1/2 percent are well out of the money. That’s just half a percentage point above target, and symmetric inflation-targeting central banks will experience inflation deviations of one percentage point (or more) periodically. After all, we have certainly experienced this magnitude deviation on the downside in the U.S., even for core inflation measures. The question is whether such upside risks would increase substantially under a policy of holding the funds rate at its current level until core inflation returned to 2 percent. I just don’t see it. Given the shallow path of market policy expectations today, there is a good argument that inflationary risks would not become serious even under this alternative policy threshold. And when inflation rises above 2 percent, as it inevitably will at some point, the FOMC knows how to respond and will do so to provide the necessary, more restrictive financial conditions to keep inflation near our price stability objective.
So these are two potential policy options that have some attraction from my perspective. And, of course, I am sure other FOMC participants have additional thoughts, as well as everyone here today. I can’t say I know how our policy deliberations will come out, but I can confidently predict that we will have a healthy discussion of all of the issues! There is a lot to mull over, and I can guarantee my colleagues and I will be preparing hard and thinking deeply about the tough issues facing the Committee today. Let me close with one final prediction: Our robust discussions will be evident in our June dot chart.
Thank you.
Notes
1 This was first acknowledged in Federal Open Market Committee (2012a); for the most recent statement of our longer-run goals see Federal Open Market Committee (2016b).
2 Aaronson and Sullivan (2002).
3 Indeed, Fernald (2014) estimates that contributions to labor productivity from increasing labor quality declined noticeably in the 2003–07 period and, on average, he does not expect any boost to productivity growth from increases in labor quality going forward.
4 Byrne, Fernald and Reinsdorf (2016).Total factor productivity captures the residual growth in total output of the national economy that cannot be explained by the accumulation of measured inputs, such as labor and capital.
5 See Federal Open Market Committee (2012b). The full range of the longer-run estimates was 2.2 percent to 3 percent, and the central tendency was in the 2.3 percent to 2.6 percent range.
6 Federal Open Market Committee (2016a).
7 Federal Open Market Committee (2016a).
8 Federal Open Market Committee (2012b).
9 Although 17 participants provide projections and attend FOMC meetings, a rotating subgroup of ten vote on monetary policy decisions.
10 Federal Open Market Committee (2016a).
References
Aaronson, Daniel, and Daniel G. Sullivan, 2002, “Growth in worker quality,” Chicago Fed Letter, Federal Reserve Bank of Chicago, No. 174, February.
Byrne, David M., John G. Fernald and Marshall B. Reinsdorf, 2016, “Does the United States have a productivity slowdown or a measurement problem?,” Federal Reserve Bank of San Francisco, working paper, No. 2016-03, March.
Federal Open Market Committee, 2016a, Summary of Economic Projections, Washington, DC, March 16.
Federal Open Market Committee, 2016b, “Statement on longer-run goals and monetary policy strategy,” Washington, DC, as amended effective January 26.
Federal Open Market Committee, 2012a, press release, Washington, DC, January 25.
Federal Open Market Committee, 2012b, Summary of Economic Projections, Washington, DC, January 25.
Fernald, John G., 2014, “Productivity and potential output before, during and after the Great Recession,” Federal Reserve Bank of San Francisco, working paper, No. 2014-15, June
Gordon, Robert J., 2012, “Is U.S. economic growth over? Faltering innovation confronts the six headwinds,” National Bureau of Economic Research, No. 18315, August.