

Summary
There was an annual increase of 12 percent in the Seventh Federal Reserve District’s agricultural land values in 2022—which helped them reach a new peak, even though the yearly gain was smaller than that of 2021. Values for “good” farmland in the District were unchanged in the fourth quarter of 2022 from the third quarter, according to 147 agricultural bankers who responded to the January survey. Sixteen percent of the survey respondents expected farmland values to rise during the January through March period of 2023, 10 percent expected them to fall, and 74 percent expected them to be stable.
District agricultural credit conditions during the fourth quarter of 2022 remained healthy. In the final quarter of 2022, repayment rates for non-real-estate farm loans were again higher than a year ago, plus loan renewals and extensions were lower than a year ago once more. Less than 1 percent of agricultural borrowers were not likely to qualify for operating credit at the survey respondents’ banks in 2023 after qualifying in the previous year. That said, non-real-estate farm loan demand relative to a year ago was lower for the tenth consecutive quarter. There were again more funds available for lending than in the same quarter of the prior year at survey respondents’ banks in the final quarter of 2022, after the streak of 12 quarters with more funds available had been interrupted in the third quarter of 2022. The average loan-to-deposit ratio for the District rose to 70.6 percent in the fourth quarter of 2022—its highest reading since the fourth quarter of 2020. At the end of 2022, the District’s average nominal interest rates on farm operating, feeder cattle, and farm real estate loans were at their highest levels in 15 years, whereas average real rates for all three were last higher at the end of the first quarter of 2021.
Farmland values
In 2022, the District saw a strong annual increase of 12 percent in its farmland values (see table and map below). Although this result may seem like a letdown after the even larger increase in 2021, 2022’s annual gain was the second largest in the past ten years. In the final quarter of 2022, Illinois, Indiana, Iowa, and Wisconsin still had double-digit year-over-year increases in their agricultural land values, but Indiana was the only District state to have an increase that was larger than in the fourth quarter of 2021. On the whole, the District’s farmland values were unchanged in the fourth quarter of 2022 from the third quarter, ending a string of eight consecutive quarterly increases.
Percent change in dollar value of “good” farmland
| October 1, 2022 to January 1, 2023 |
January 1, 2022 to January 1, 2023 |
|
|---|---|---|
| Illinois | +2 | +14 |
| Indiana | +1 | +23 |
| Iowa | –2 | +11 |
| Michigan | * | * |
| Wisconsin | –1 | +11 |
| Seventh District | 0 | +12 |
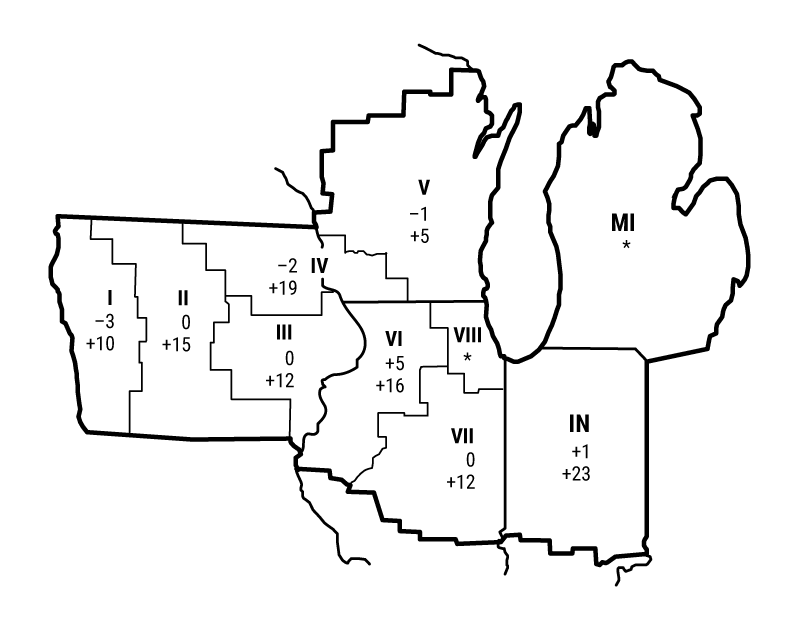
Top: October 1, 2022 to January 1, 2023
Bottom: January 1, 2022 to January 1, 2023
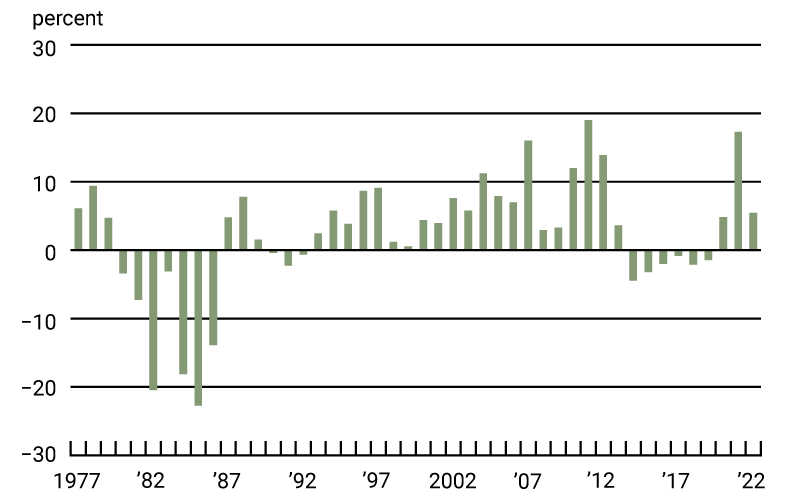
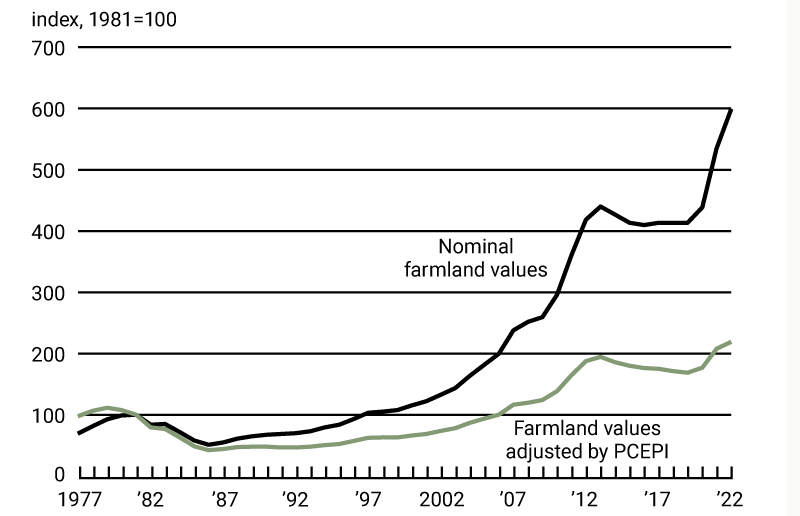
Adjusted for inflation by the Personal Consumption Expenditures Price Index (PCEPI), District farmland values experienced an annual increase of around 5 percent in 2022—the second-largest real increase of the past ten years (see chart 1). District farmland values climbed to a new peak in 2022. At the end of 2022, District farmland values were up 12 percent from their prior peak (in 2013) in real terms; they were up 36 percent from their 2013 peak in nominal terms (see chart 2).
1. Annual real change in Seventh District farmland values
2. Indexes of Seventh District farmland values
District farmland values got a boost from a record year for crop revenues. Even though District output of corn and soybeans was down from 2021, revenues for these crops were up in 2022 because of higher crop prices. Based on calculations using U.S. Department of Agriculture (USDA) data, the District states’ corn yield edged up 0.6 percent from 2021 to a record 199 bushels per acre in 2022. However, the District states’ soybean yield decreased 5 percent from 2021 to 59 bushels per acre in 2022. Harvested corn acres were down 1 percent from 2021, but harvested soybean acres were up 2 percent. In 2022, corn and soybean production for the District states declined 0.6 percent and 3 percent, respectively. With U.S. corn and soybean stocks lower in December 2022 than a year ago (see final table), the USDA in January projected prices for the 2022–23 crop year of $6.70 per bushel for corn (up 12 percent from the previous crop year) and $14.20 per bushel for soybeans (up 7 percent). When calculated with these prices, the estimated revenues from the 2022 harvests for District states would be up 11 percent for corn and 4 percent for soybeans relative to 2021 levels. Under this scenario, combined corn and soybean revenues would move up 8 percent from 2021, setting another record for the District.
Additionally, prices for livestock products were higher at the end of 2022, though costs for feed and other inputs were up as well. The index of prices for livestock and associated products in December 2022 was 25 percent above its level of a year ago; in December 2022, prices for hogs, cattle, and milk were up 12 percent, 12 percent, and 14 percent from a year earlier, respectively (see final table). Grabbing the most attention, egg prices soared 230 percent from December 2021, as the poultry sector faced repeated outbreaks of avian influenza that led to culling almost 58 million birds in 2022. Even when accounting for swollen costs to purchase agricultural inputs (such as diesel and fertilizer), higher receipts for both crop and livestock products led to U.S. net farm income expanding by 16 percent ($22 billion) from 2021, based on the USDA’s February assessment for 2022. In real terms, net farm income for the nation would be the largest since 1973. In the words of an Iowa banker, “We have a lot of happy farmers!” While optimism helped support farmland values, an Indiana banker worried that farmers were “making long-term purchases based on short-term cashflows.” Nearly two-thirds of survey respondents were of the view that agricultural ground was overvalued; only 1 percent of the respondents viewed farmland as undervalued
Credit conditions
Stronger agricultural credit conditions for the District also contributed to the optimism of farmers. The share of the District’s farm loan portfolio assessed as having “major” or “severe” repayment problems was 1.2 percent in the fourth quarter of 2022—lower than the share reported in any final quarter since collection of these data began in 1998. With 33 percent of survey respondents reporting higher rates of loan repayment than a year ago and just 2 percent reporting lower rates for the fourth quarter of 2022, the index of non-real-estate farm loan repayment rates was 131. In addition, non-real-estate farm loan renewals and extensions in the final quarter of 2022 were lower than in the final quarter of 2021, as 4 percent of survey respondents reported more of them and 17 percent reported fewer. Both of these indicators of farm credit conditions were better than a year earlier in each of the nine most recent quarters.
Despite fewer problems with lending, 20 percent of survey respondents’ banks tightened their credit standards for farm loans in the fourth quarter of 2022 compared with a year ago, while only 4 percent of the banks eased their credit standards—with the rest of the banks keeping their credit standards essentially unchanged. Meanwhile, 96 percent of responding bankers noted their banks did not change the amounts of collateral required for customers to qualify for non-real-estate farm loans during the final quarter of 2022 relative to a year ago; 3 percent noted their banks required larger amounts, while 1 percent noted their banks required smaller amounts.
Agricultural interest rates—in both nominal and real terms—jumped higher during the fourth quarter of 2022. As of January 1, 2023, the District’s average nominal interest rates on new operating loans (7.50 percent), feeder cattle loans (7.54 percent), and farm real estate loans (6.80 percent) were the highest since the fourth quarter of 2007. In real terms (after being adjusted for inflation with the PCEPI), the average interest rate on farm real estate loans moved into positive territory in the fourth quarter of 2022, after the average real interest rates on operating and feeder cattle loans had done so in the previous quarter. In real terms, all of these loan rates were last higher at the end of the first quarter of 2021. According to an Illinois banker, “The higher interest rates have not yet discouraged borrowing for real estate.”
During the October through December period of 2022, demand for non-real-estate farm borrowing was once again lower relative to the same period of a year ago: With 17 percent of survey respondents reporting an increase in the demand for non-real-estate farm loans from a year earlier and 35 percent reporting a decrease, the index of loan demand was 82 in the fourth quarter of 2022. At 102 in the final quarter of 2022, the index of funds availability indicated little change in the level of funds available for lending from a year ago; funds availability was higher than a year earlier at 21 percent of the survey respondents’ banks and lower at 19 percent. The District’s average loan-to-deposit ratio increased to 70.6 percent in the fourth quarter of 2022; this ratio was nearly 10 percentage points below the average level desired by the responding bankers.
Credit conditions at Seventh District agricultural banks
| Interest rates on farm loans | |||||||
| Loan demand | Funds availability | Loan repayment rates | Average loan-to-deposit ratio | Operating loansa | Feeder cattlea | Real estatea | |
|---|---|---|---|---|---|---|---|
| (index)b | (index)b | (index)b | (percent) | (percent) | (percent) | (percent) | |
| 2021 | |||||||
| Jan–Mar | 79 | 162 | 146 | 69.7 | 4.42 | 4.58 | 4.08 |
| Apr–June | 63 | 160 | 146 | 67.5 | 4.40 | 4.55 | 4.02 |
| July–Sept | 78 | 161 | 143 | 68.8 | 4.34 | 4.51 | 4.01 |
| Oct–Dec | 76 | 152 | 153 | 67.2 | 4.34 | 4.53 | 4.03 |
| 2022 | |||||||
| Jan–Mar | 83 | 148 | 159 | 65.0 | 4.64 | 4.74 | 4.44 |
| Apr–June | 82 | 129 | 133 | 67.0 | 5.42 | 5.53 | 5.17 |
| July–Sept | 91 | 96 | 121 | 68.2 | 6.52 | 6.58 | 6.13 |
| Oct–Dec | 82 | 102 | 131 | 70.6 | 7.50 | 7.54 | 6.80 |
bBankers responded to each item by indicating whether conditions in the current quarter were higher or lower than (or the same as) in the year-earlier quarter. The index numbers are computed by subtracting the percentage of bankers who responded “lower” from the percentage who responded “higher” and adding 100.
Note: Historical data on Seventh District agricultural credit conditions are available online.
Looking forward
According to survey respondents at the beginning of 2023, only 0.9 percent of their farm customers with operating credit in the year just past were not likely to qualify for new operating credit in the year ahead (slightly above the survey’s record low). Both farm real estate loan and non-real-estate loan volumes (except for the volume of operating loans) were projected to be smaller in the first three months of 2023 compared with the same three months of a year earlier. At the start of 2023, survey respondents forecasted capital expenditures by farmers would be higher in the year ahead than in the year just ended for machinery, equipment, trucks, and autos, but not for land purchases or improvements nor for buildings and facilities.
There were more responding bankers (16 percent) who predicted farmland values to go up in the next quarter (in this case, the first quarter of 2023) than those who predicted farmland values to go down (10 percent); 74 percent of the respondents predicted them to be stable. Given the trends reported here, slower growth in agricultural land values would seem likely for the first quarter of 2023.
Selected agricultural economic indicators
| Percent change from | |||||
|---|---|---|---|---|---|
| Latest period | Value | Prior period | Year ago | Two years ago | |
| Prices received by farmers (index, 2011=100) | December | 138 | 3.1 | 22 | 51 |
| Crops (index, 2011=100) | December | 129 | 1.1 | 21 | 41 |
| Corn ($ per bu.) | December | 6.58 | 1.4 | 20 | 66 |
| Hay ($ per ton) | December | 235.00 | –1.7 | 22 | 55 |
| Soybeans ($ per bu.) | December | 14.40 | 2.9 | 15 | 36 |
| Wheat ($ per bu.) | December | 8.98 | –2.0 | 5 | 64 |
| Livestock and products (index, 2011=100) | December | 150 | 4.9 | 25 | 66 |
| Barrows & gilts ($ per cwt.) | December | 63.00 | –5.8 | 12 | 28 |
| Steers & heifers ($ per cwt.) | December | 158.00 | 2.6 | 12 | 42 |
| Milk ($ per cwt.) | December | 24.70 | –3.5 | 14 | 36 |
| Eggs ($ per doz.) | December | 4.49 | 34.4 | 230 | 515 |
| Consumer prices (index, 1982–84=100) | December | 297 | –0.3 | 6 | 14 |
| Food | December | 317 | 0.3 | 10 | 17 |
| Production or stocks | |||||
| Corn stocks (mil. bu.) | December 1 | 10,809 | N.A. | –7 | –4 |
| Soybean stocks (mil. bu.) | December 1 | 3,022 | N.A. | –4 | 3 |
| Wheat stocks (mil. bu.) | December 1 | 1,280 | N.A. | –7 | –25 |
| Beef production (bil. lb.) | December | 2.23 | –8.2 | –6 | –4 |
| Pork production (bil. lb.) | December | 2.23 | –5.1 | –7 | –11 |
| Milk production (bil. lb.) | December | 18.9 | 3.8 | 1 | 0 |
| Agricultural exports ($ mil.) | November | 17,484 | –0.2 | –5 | 13 |
| Corn (mil. bu.) | November | 96 | 16.9 | –47 | –36 |
| Soybeans (mil. bu.) | November | 355 | –1.2 | –9 | –13 |
| Wheat (mil. bu.) | November | 48 | –4.9 | –8 | –30 |
| Farm machinery (units) | |||||
| Tractors, 40 HP or more | December | 9,722 | 77 | –6 | 0 |
| 40 to 100 HP | December | 6,429 | 59 | –9 | –11 |
| 100 HP or more | December | 3,293 | 128 | 2 | 31 |
| Combines | December | 735 | 134 | 16 | 46 |
Sources: Author’s calculations based on data from the U.S. Department of Agriculture, U.S. Bureau of Labor Statistics, and the Association of Equipment Manufacturers.


