

Summary
Agricultural land values for the Seventh Federal Reserve District surged 18 percent in the third quarter of 2021 from a year ago. Moreover, values for “good” farmland in the District overall were 6 percent higher in the third quarter of 2021 than in the second quarter, according to the 151 bankers who responded to the October 1 survey. Most survey respondents (68 percent) anticipated the District’s farmland values to go up again during the fourth quarter of 2021, while the rest anticipated stable District farmland values in the final quarter of this year (none anticipated them to go down).
The District’s agricultural credit conditions were better in the third quarter of 2021 than a year earlier. Repayment rates for non-real-estate farm loans were higher relative to the same quarter of the previous year for the fourth consecutive quarter (accompanied by lower loan renewals and extensions). In the third quarter of this year, the availability of funds for lending by agricultural banks was again higher than a year ago, even as the demand for non-real-estate farm loans remained lower than a year earlier for the fifth consecutive quarter. The average loan-to-deposit ratio for the District was 68.8 percent in the third quarter of 2021. Average interest rates on agricultural loans—in both nominal and real terms—kept falling during the third quarter of 2021.
Farmland values
Assisted by low interest rates, government support, and higher than normal farm incomes, the District saw a year-over-year gain of 18 percent in its agricultural land values in the third quarter of 2021. This was the largest year-over-year increase in the District’s farmland values in nine and a half years. Iowa led the way with a year-over-year jump in farmland values of 28 percent; other District states also saw double-digit year-over-year growth in farmland values (see map and table below). After being adjusted for inflation with the Personal Consumption Expenditures Price Index (PCEPI), District farmland values were still up 13 percent in the third quarter of 2021 relative to a year ago (see chart 1). In nominal terms, the District’s agricultural land values in the third quarter of 2021 were 6 percent higher than in the second quarter.
Percent change in dollar value of “good” farmland
| July 1, 2021 to October 1, 2021 |
October 1, 2020 to October 1, 2021 |
|
|---|---|---|
| Illinois | +3 | +13 |
| Indiana | +6 | +15 |
| Iowa | +10 | +28 |
| Michigan | * | * |
| Wisconsin | +1 | +10 |
| Seventh District | +6 | +18 |
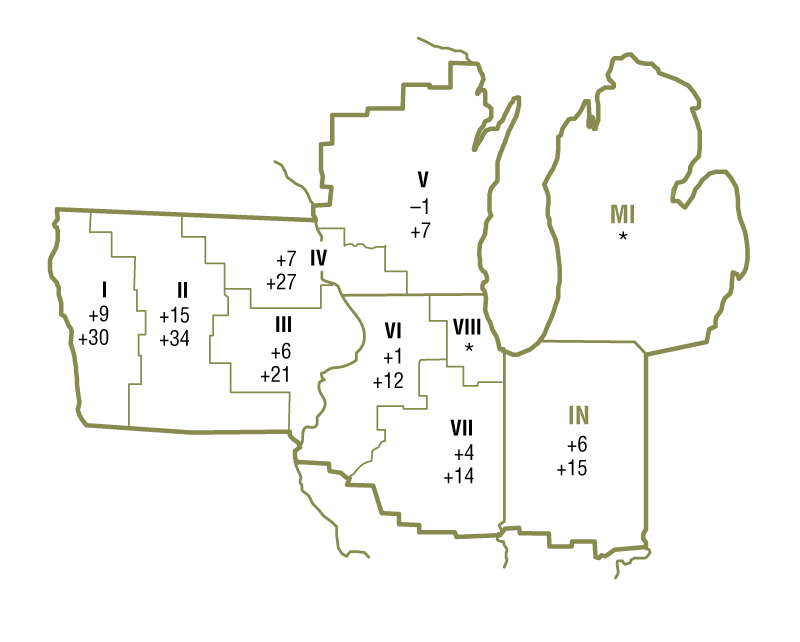
Top: July 1, 2021 to October 1, 2021
Bottom: October 1, 2020 to October 1, 2021
1. Year-over-year real changes in Seventh District farmland values, by quarter
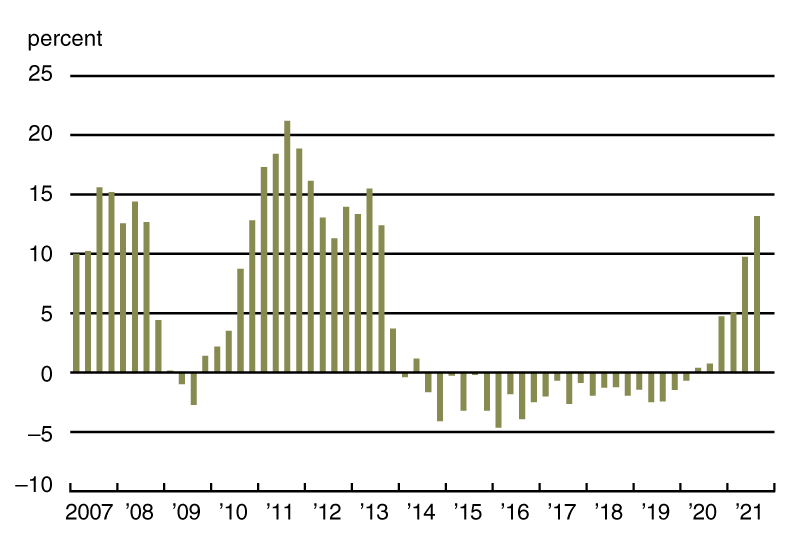
Sources: Author’s calculations based on data from Federal Reserve Bank of Chicago surveys of farmland values; and U.S. Bureau of Economic Analysis, Personal Consumption Expenditures Price Index (PCEPI), from Haver Analytics.
Although drought threatened a substantial portion of the Midwest over the summer, District-wide corn and soybean yields in 2021 rebounded strongly from 2020 and looked to set new highs, according to U.S. Department of Agriculture (USDA) data. In October, the USDA forecasted the five District states’ harvest of corn for grain in 2021 to increase by 7 percent from 2020 and be the largest since 2016. Similarly, the USDA forecasted the soybean harvest for the five District states in 2021 to rise by 11 percent from 2020 and set a record. The price of corn in September 2021 was 14 percent lower than in August, but still 60 percent higher than a year ago; likewise, the price of soybeans in September of this year was 11 percent lower than in August, but 32 percent higher than a year earlier (see the final table). In October, the USDA released price forecasts for the 2021–22 crop year of $5.45 per bushel for corn and $12.35 per bushel for soybeans. When calculated using these price estimates, the projected revenues from the 2021 corn and soybean harvests for District states would increase from 2020 by 29 percent and 27 percent, respectively.
Generally, livestock prices were up in September of 2021 from a year earlier. Compared with a year ago, average prices for hogs, cattle, eggs, and milk in September 2021 were up 38 percent, 21 percent, 24 percent, and 4 percent, respectively. However, milk’s average price in the third quarter of 2021 was down 5 percent from a year ago. A Wisconsin banker lamented that the “dairy industry is reeling from high input costs and moderate prices compared to their counterparts.” By the end of October 2021, the District states’ dairy sectors had received $896 million through the Coronavirus Food Assistance Program (CFAP). The CFAP had dispersed over $7.2 billion to farm operations in the five District states (24 percent of the $30.6 billion disbursed across the U.S.). Although Wisconsin bankers suggested they were not as sure as the others, 95 percent of District respondents indicated that the federal government had likely provided sufficient support to agriculture in their respective local areas during the pandemic.
Credit conditions
Agricultural credit conditions for the District showed improvement yet again in the third quarter of 2021. For the July through September period of 2021, repayment rates on non-real-estate farm loans were higher than a year earlier. The index of loan repayment rates was 143 in the third quarter of 2021, as 45 percent of responding bankers observed higher rates of loan repayment than a year ago and just 2 percent observed lower rates. Also, renewals and extensions of non-real-estate agricultural loans were lower in the third quarter of 2021 than a year ago, with only 1 percent of the responding bankers reporting more of them and 28 percent reporting fewer. Collateral requirements for loans in the third quarter of 2021 were essentially unchanged from the same quarter of last year, as 3 percent of the respondents reported that their banks required more collateral and 1 percent reported that their banks required less.
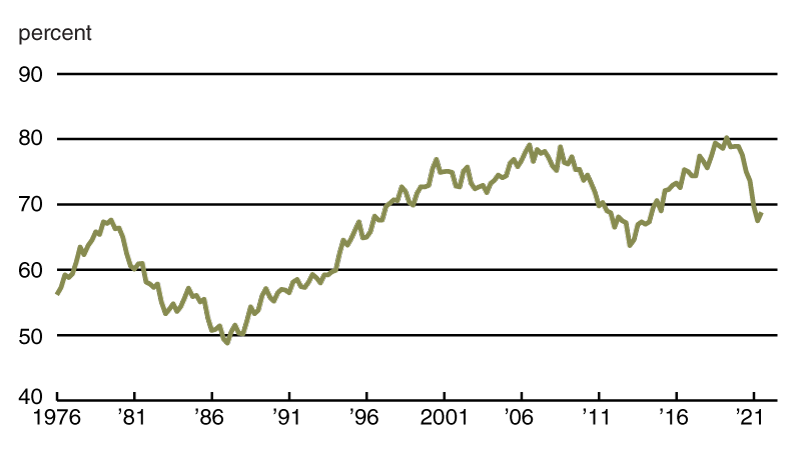
The District’s demand for non-real-estate farm loans was lower in the third quarter of 2021 than in the same quarter of 2020; thus, the District saw weaker demand for such loans relative to a year ago for the fifth quarter in a row. The index of loan demand was 78 in the third quarter of 2021, as 15 percent of survey respondents noted higher demand for non-real-estate loans than a year earlier and 37 percent noted lower demand. The availability of funds for lending by agricultural banks was still higher than a year ago. The index of funds availability edged up to 161 in the third quarter of 2021, as 62 percent of the survey respondents indicated their banks had more funds available to lend than a year earlier and merely 1 percent indicated their banks had less. Even though the District’s average loan-to-deposit ratio rose a bit to 68.8 percent in the third quarter of 2021, it was substantially lower than a year ago, when it stood at 75.0 percent (see chart 2). The gap between the average loan-to-deposit ratio and the average level desired by the responding bankers was 12.6 percentage points; moreover, 87 percent of the survey respondents stated that their respective banks were below their targeted levels. As of October 1, 2021, the District’s average nominal interest rates on new operating loans, feeder cattle loans, and farm real estate loans were at their lowest levels on record: 4.34 percent, 4.51 percent, and 4.01 percent, respectively. Furthermore, when adjusted for inflation using the PCEPI, the average interest rate for farm real estate loans dipped below zero for the first time since the first quarter of 1975.
2. Quarterly average loan-to-deposit ratio for Seventh District
Credit conditions at Seventh District agricultural banks
| Interest rates on farm loans | |||||||
| Loan demand | Funds availability | Loan repayment rates | Average loan-to-deposit ratio | Operating loansa | Feeder cattlea | Real estatea | |
|---|---|---|---|---|---|---|---|
| (index)b | (index)b | (index)b | (percent) | (percent) | (percent) | (percent) | |
| 2020 | |||||||
| Jan–Mar | 117 | 107 | 59 | 78.9 | 4.83 | 5.01 | 4.51 |
| Apr–June | 103 | 119 | 64 | 77.6 | 4.77 | 4.94 | 4.40 |
| July–Sept | 85 | 131 | 93 | 75.0 | 4.65 | 4.79 | 4.24 |
| Oct–Dec | 91 | 148 | 133 | 73.6 | 4.49 | 4.66 | 4.10 |
| 2021 | |||||||
| Jan–Mar | 79 | 162 | 146 | 69.7 | 4.42 | 4.58 | 4.08 |
| Apr–June | 63 | 160 | 146 | 67.5 | 4.40 | 4.55 | 4.02 |
| July–Sept | 78 | 161 | 143 | 68.8 | 4.34 | 4.51 | 4.01 |
b Bankers responded to each item by indicating whether conditions in the current quarter were higher or lower than (or the same as) in the year-earlier quarter. The index numbers are computed by subtracting the percentage of bankers who responded “lower” from the percentage who responded “higher” and adding 100.
Note: Historical data on Seventh District agricultural credit conditions are available online.
Looking forward
Sixty-eight percent of survey respondents anticipated District farmland values to rise in the final quarter of 2021, and the rest (32 percent) anticipated them to be stable. In addition, a large majority of respondents expected both farmers and nonfarm investors to have stronger rather than weaker demand to acquire farmland this fall and winter compared with a year earlier. Also, respondents overwhelmingly anticipated a rise in the volume of farmland transfers during this fall and winter relative to a year ago.
Illustrating agriculture’s much-improved situation from last year, net cash earnings (which include government payments) for crop, cattle, and hog farmers were expected to be up during the fall and winter from their levels of a year earlier, according to the responding bankers. For crop farmers, 85 percent of survey respondents forecasted net cash earnings to increase over the next three to six months relative to a year ago, and 5 percent forecasted these earnings to decrease. For cattle and hog farmers, 34 percent of survey respondents expected net cash earnings to increase over the next three to six months relative to a year ago, and 13 percent expected these earnings to decrease. Yet, the District’s dairy industry was not anticipated to fare as well, with 13 percent of responding bankers forecasting higher net cash earnings over the next three to six months relative to a year earlier and 21 percent forecasting lower such earnings.
By a wide margin the survey respondents forecasted loan repayment rates to rise rather than drop this fall and winter from a year ago: 59 percent of the responding bankers predicted a higher volume of farm loan repayments over the next three to six months compared with a year earlier, while only 1 percent predicted a lower volume. In addition, forced sales or liquidations of farm assets owned by financially distressed farmers were expected to decrease in the next three to six months relative to a year ago, according to 59 percent of the responding bankers (only 1 percent expected them to increase). On the whole, the non-real-estate farm loan volume of the survey respondents’ banks in the October through December period of 2021 was anticipated to be somewhat lower than in the same period of 2020, whereas the volume of farm real estate loans was anticipated to be higher.
An Iowa banker noted that 2021 had “given most farm customers their best returns to income in years,” but added that “concern will shift next year to higher input costs and high land prices.”
Selected agricultural economic indicators
| Percent change from | |||||
|---|---|---|---|---|---|
| Latest period | Value | Prior period | Year ago | Two years ago | |
| Prices received by farmers (index, 2011=100) | September | 109 | –0.7 | 22 | 24 |
| Crops (index, 2011=100) | September | 108 | –1.5 | 16 | 23 |
| Corn ($ per bu.) | September | 5.45 | –13.8 | 60 | 43 |
| Hay ($ per ton) | September | 188 | 0.0 | 25 | 18 |
| Soybeans ($ per bu.) | September | 12.20 | –10.9 | 32 | 46 |
| Wheat ($ per bu.) | September | 7.75 | 8.7 | 64 | 79 |
| Livestock and products (index, 2011=100) | September | 109 | 0.0 | 30 | 25 |
| Barrows & gilts ($ per cwt.) | September | 70.40 | –10.4 | 38 | 46 |
| Steers & heifers ($ per cwt.) | September | 127.00 | 1.6 | 21 | 22 |
| Milk ($ per cwt.) | September | 18.40 | 4.0 | 4 | –5 |
| Eggs ($ per doz.) | September | 1.03 | –3.7 | 24 | 51 |
| Consumer prices (index, 1982–84=100) | September | 274 | 0.3 | 5 | 7 |
| Food | September | 282 | 0.8 | 5 | 9 |
| Production or stocks | |||||
| Corn stocks (mil. bu.) | September 1 | 1,236 | N.A. | –36 | –44 |
| Soybean stocks (mil. bu.) | September 1 | 256 | N.A. | –51 | –72 |
| Wheat stocks (mil. bu.) | September 1 | 1,780 | N.A. | –18 | –24 |
| Beef production (bil. lb.) | September | 2.30 | –2.6 | –2 | 5 |
| Pork production (bil. lb.) | September | 2.27 | 2.4 | –3 | 1 |
| Milk production (bil. lb.) | September | 18.1 | –3.5 | 0 | 3 |
| Agricultural exports ($ mil.) | September | 12,004 | –5.1 | –2 | 15 |
| Corn (mil. bu.) | September | 100 | –25.9 | –33 | 26 |
| Soybeans (mil. bu.) | September | 80 | 65.6 | –72 | –44 |
| Wheat (mil. bu.) | September | 85 | –12.0 | –14 | 1 |
| Farm machinery (units) | |||||
| Tractors, 40 HP or more | September | 8,916 | 6.9 | 7 | 20 |
| 40 to 100 HP | September | 6,346 | 1.8 | 2 | 17 |
| 100 HP or more | September | 2,570 | 21.9 | 19 | 29 |
| Combines | September | 848 | 34.6 | 35 | 45 |
Sources: Author’s calculations based on data from the U.S. Department of Agriculture, U.S. Bureau of Labor Statistics, and the Association of Equipment Manufacturers.
Biofuels in the Midwest: Today and Tomorrow
On November 30, 2021, the Federal Reserve Bank of Chicago will hold a virtual event to explore the impacts of biofuels on the Midwest and related trends in agriculture. Registration is available online.


