

Summary
Rising 5 percent in the third quarter of 2023 from a year ago, agricultural land values for the Seventh Federal Reserve District slowed their year-over-year increases (this was the smallest such gain in three years). Also, values for “good” farmland in the District overall were 1 percent higher in the third quarter of 2023 than in the second quarter, according to the respondents from 137 banks who completed the October 1 survey. While 72 percent of the survey respondents anticipated District farmland values to be stable during the fourth quarter of 2023, 13 percent anticipated them to move up again in the final quarter of this year and 15 percent anticipated them to move down.
The District’s agricultural credit conditions were weaker in the third quarter of 2023 than a year earlier, as repayment rates for non-real-estate farm loans were no longer higher relative to the same quarter of the previous year. Moreover, renewals and extensions of such loans were slightly higher than a year ago. In the third quarter of this year, demand for non-real-estate farm loans was down relative to a year ago for the 13th quarter in a row. Plus, the availability of funds for lending by agricultural banks was dramatically lower than in the third quarter of 2022. For the second quarter in a row, the average loan-to-deposit ratio for the District moved up, reaching 74.3 percent in the third quarter of 2023. Finally, average interest rates on agricultural loans kept increasing.
Farmland values
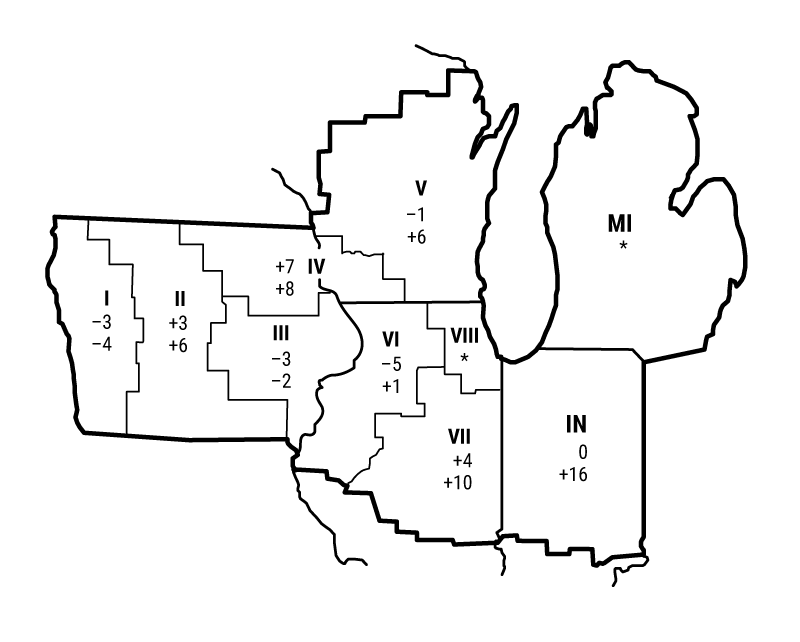
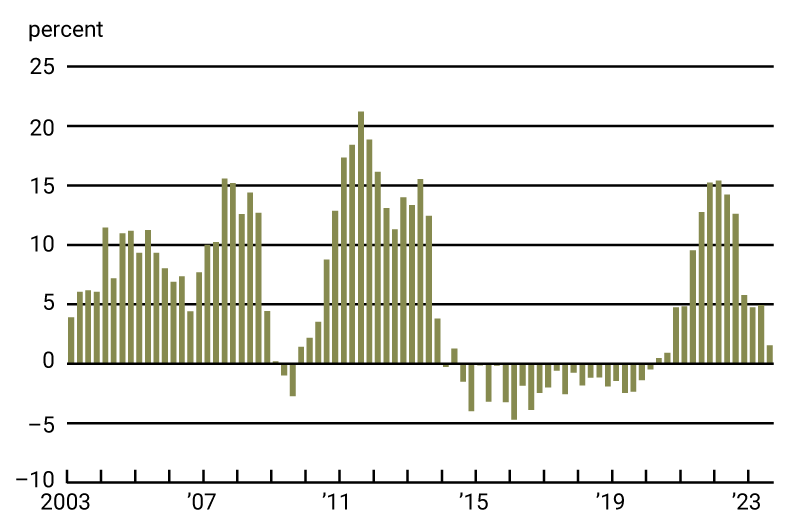
The District had a year-over-year gain of only 5 percent in its agricultural land values in the third quarter of 2023. This was the lowest year-over-year increase for District farmland values since the third quarter of 2020. Indiana led the way with a year-over-year gain in farmland values of 16 percent; Illinois and Wisconsin had year-over-year growth in farmland values of 6 percent and 9 percent, respectively (see map and table below). Growth in Iowa’s farmland values was stagnant in nominal terms. An Iowa banker expressed surprise that “farmland has not retreated in value.” In contrast, one Wisconsin banker cited “competition among large dairy operations” as the impetus for pushing farmland values higher there, and another noted that “nonfarm investors continue to push land prices higher.” After being adjusted for inflation with the Personal Consumption Expenditures Price Index (PCEPI), District farmland values were up less than 2 percent in the third quarter of 2023 relative to a year ago (see chart 1). In nominal terms, the District’s agricultural land values in the third quarter of 2023 were 1 percent higher than in the second quarter.
Percent change in dollar value of “good” farmland
| July 1, 2023 to October 1, 2023 |
October 1, 2022 to October 1, 2023 |
|
|---|---|---|
| Illinois | +1 | +6 |
| Indiana | 0 | +16 |
| Iowa | +1 | 0 |
| Michigan | * | * |
| Wisconsin | +1 | +9 |
| Seventh District | +1 | +5 |
Top: July 1, 2023 to October 1, 2023
Bottom: October 1, 2022 to October 1, 2023
1. Year-over-year changes in real Seventh District farmland values, by quarter
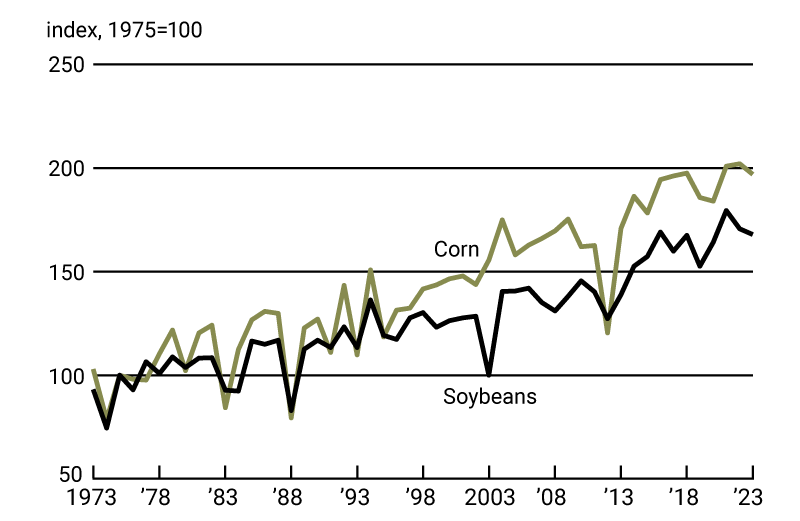
An Illinois banker reported that “crop yields are surprisingly very good; however, net farm income levels will be lower than 2022 due to lower commodity prices.” Despite a widespread drought across the District, corn and soybean yields for its five states in 2023 dipped just a bit from 2022 and stayed close to their historically highest levels, based on U.S. Department of Agriculture (USDA) data (see chart 2). With timely rains in many areas, both corn and soybean yields for the five District states in 2023 were the fourth highest of all time, according to October USDA data. Similarly, the USDA forecasted the five District states’ harvest of corn for grain and their harvest of soybeans in 2023 to be the fourth largest on record for each crop—with corn increasing by 0.5 percent and soybeans decreasing by 5.6 percent from their respective 2022 harvests. With large harvests projected for 2023 in District states and elsewhere, the price of corn in September 2023 was 27 percent lower than a year ago; likewise, the price of soybeans in September of this year was 7 percent lower than a year earlier (see the final table). In October, the USDA released price forecasts for the 2023–24 crop year of $4.95 per bushel for corn and $12.90 per bushel for soybeans. So, when calculated using these price estimates, the projected revenues from the District states’ 2023 combined corn and soybean harvest would be 20 percent under the record level of 2022, though still third highest in nominal terms, after the annual revenues of the previous two years.
2. Corn and soybean yield indexes for Seventh District states
Furthermore, the USDA price index for livestock and animal products was down 3 percent in September 2023 from a year earlier (again, see the final table). Compared with a year ago, average prices for eggs, hogs, and milk in September 2023 were down 54 percent, 11 percent, and 13 percent, respectively. In contrast, September cattle prices were up 27 percent from a year earlier. Even so, lower overall livestock and crop revenues, combined with higher farm interest rates, likely put a damper on farmland values.
Credit conditions
Agricultural credit conditions for the District softened in the third quarter of 2023. Agricultural interest rates—in both nominal and real terms—jumped higher during the third quarter of this year. As of October 1, 2023, the District’s average nominal interest rates on new operating loans (8.50 percent) and feeder cattle loans (8.47 percent) were at their highest levels since the second quarter of 2007; its average nominal interest rate on farm real estate loans (7.70 percent) was last as high in the second quarter of 2007. In real terms (after being adjusted for inflation with the PCEPI), the average interest rates on farm operating loans and feeder cattle loans were last higher in the third and fourth quarters of 2009, respectively; the average real interest rate on farm real estate loans was last higher in the fourth quarter of 2015.
For the July through September period of 2023, repayment rates for non-real-estate farm loans were about the same as a year earlier. The index of loan repayment rates was 100 in the third quarter of 2023 (and was last lower in the third quarter of 2020), as 7 percent of responding bankers observed higher rates of loan repayment than a year ago and 7 percent observed lower rates. Renewals and extensions of non-real-estate agricultural loans were a tad higher in the third quarter of 2023 than a year ago, with 6 percent of the responding bankers reporting more of them and 4 percent reporting fewer. Collateral requirements for loans in the third quarter of 2023 were up somewhat from the same quarter of last year, as 10 percent of the survey respondents reported that their banks required more collateral and none reported that their banks required less.
In the third quarter of 2023, the District saw weaker demand for non-real-estate farm loans relative to a year ago—this marked the 13th consecutive quarter of such softer demand. The index of loan demand was 81 in the third quarter of 2023, as 14 percent of survey respondents noted higher demand for non-real-estate farm loans than a year earlier and 33 percent noted lower demand. The availability of funds for lending by agricultural banks was much lower than a year ago for the second consecutive quarter. The index of funds availability dropped to 72 in the third quarter of 2023 (its lowest level since the first quarter of 1980), as just 7 percent of the survey respondents indicated their banks had more funds available to lend than a year earlier and 35 percent indicated their banks had less. The District’s average loan-to-deposit ratio rose to 74.3 percent in the third quarter of 2023. The gap between the average loan-to-deposit ratio and the average level desired by the responding bankers narrowed to around 6 percentage points, with 58 percent of the survey respondents stating that their respective banks were below their targeted levels.
Credit conditions at Seventh District agricultural banks
| Interest rates on farm loans | |||||||
| Loan demand | Funds availability | Loan repayment rates | Average loan-to-deposit ratio | Operating loansa | Feeder cattlea | Real estatea | |
|---|---|---|---|---|---|---|---|
| (index)b | (index)b | (index)b | (percent) | (percent) | (percent) | (percent) | |
| 2022 | |||||||
| Jan–Mar | 83 | 148 | 159 | 65.0 | 4.64 | 4.74 | 4.44 |
| Apr–June | 82 | 129 | 133 | 67.0 | 5.42 | 5.53 | 5.17 |
| July–Sept | 91 | 96 | 121 | 68.2 | 6.52 | 6.58 | 6.13 |
| Oct–Dec | 82 | 102 | 131 | 70.6 | 7.50 | 7.54 | 6.80 |
| 2023 | |||||||
| Jan–Mar | 78 | 102 | 123 | 70.3 | 7.97 | 7.93 | 7.14 |
| Apr–June | 77 | 83 | 105 | 72.8 | 8.24 | 8.19 | 7.33 |
| July–Sept | 81 | 72 | 100 | 74.3 | 8.50 | 8.47 | 7.70 |
Looking forward
An Iowa banker shared that he thought “the land market would be softening, but we still haven’t seen that yet.” On net, little change was expected regarding District farmland values in the final quarter of 2023 (13 percent of survey respondents anticipated them to rise, 72 percent anticipated them to be stable, and 15 percent anticipated them to fall). However, some softening in demand for agricultural land and, therefore, lower farmland values may be ahead in 2024: There were more survey respondents who expected farmers and nonfarm investors to have weaker demand to acquire farmland this fall and winter compared with a year earlier than those who expected these groups to have stronger demand. On the whole, respondents anticipated a dip in the volume of farmland transfers during this fall and winter relative to a year ago.
Net cash earnings (which include government payments) for crop and dairy farmers were expected to be down during the fall and winter from their levels of a year earlier, according to the responding bankers. For crop farmers, 12 percent of survey respondents forecasted net cash earnings to rise over the next three to six months relative to a year ago, while 79 percent forecasted these earnings to fall. For dairy farmers, 2 percent of survey respondents expected net cash earnings to increase over the next three to six months relative to a year ago, while 45 percent expected these earnings to decrease. The District’s cattle and hog operations were expected to do better, with 38 percent of responding bankers forecasting higher net cash earnings for cattle and hog farmers over the next three to six months relative to a year earlier and 32 percent forecasting lower such earnings. However, this positive news was primarily for the beef sector given higher cattle prices and lower hog prices.
Twelve percent of the responding bankers predicted a lower volume of farm loan repayments over the next three to six months compared with a year earlier, while 6 percent predicted a higher volume. Still, forced sales or liquidations of farm assets owned by financially distressed farmers were expected to be nearly flat in the next three to six months relative to a year ago, as 8 percent of the responding bankers expected them to increase and 10 percent expected them to decrease. Non-real-estate and real estate farm loan volumes of the survey respondents’ banks were generally anticipated to be lower in the October through December period of 2023 than in the same period of 2022. The lone exception was the volume of operating loans, which was expected to be higher. With regard to this last survey result, an Illinois banker offered one possible explanation: “We will have producers storing ’23 crop for better prices next spring, but needing funds for ’24 inputs.” In sum, agricultural credit conditions seemed poised for tougher sledding ahead.
Selected agricultural economic indicators
| Percent change from | |||||
|---|---|---|---|---|---|
| Latest period | Value | Prior period | Year ago | Two years ago | |
| Prices received by farmers (index, 2011=100) | September | 123 | –2.9 | –7 | 13 |
| Crops (index, 2011=100) | September | 114 | –4.2 | –11 | 5 |
| Corn ($ per bu.) | September | 5.21 | –9.1 | –27 | –5 |
| Hay ($ per ton) | September | 204.00 | –2.4 | –18 | 6 |
| Soybeans ($ per bu.) | September | 13.20 | –6.4 | –7 | 8 |
| Wheat ($ per bu.) | September | 7.07 | –3.8 | –19 | –9 |
| Livestock and products (index, 2011=100) | September | 133 | –0.9 | –3 | 23 |
| Barrows & gilts ($ per cwt.) | September | 65.60 | –11.7 | –11 | –7 |
| Steers & heifers ($ per cwt.) | September | 184.00 | –1.1 | 27 | 45 |
| Milk ($ per cwt.) | September | 21.00 | 6.6 | –13 | 15 |
| Eggs ($ per doz.) | September | 1.22 | –9.6 | –54 | 18 |
| Consumer prices (index, 1982–84=100) | September | 308 | 0.2 | 4 | 12 |
| Food | September | 325 | 0.2 | 4 | 15 |
| Production or stocks | |||||
| Corn stocks (mil. bu.) | September 1 | 1,361 | N.A. | –1 | 10 |
| Soybean stocks (mil. bu.) | September 1 | 268 | N.A. | –2 | 4 |
| Wheat stocks (mil. bu.) | September 1 | 1,780 | N.A. | 0 | 0 |
| Beef production (bil. lb.) | September | 2.15 | –9.1 | –10 | –7 |
| Pork production (bil. lb.) | September | 2.19 | –4.7 | –3 | –4 |
| Milk production (bil. lb.) | September | 18.2 | –3.4 | 0 | 1 |
| Agricultural exports ($ mil.) | August | 12,484 | 2.6 | –19 | –1 |
| Corn (mil. bu.) | August | 100 | 6.2 | –23 | –26 |
| Soybeans (mil. bu.) | August | 63 | 33.5 | –49 | 30 |
| Wheat (mil. bu.) | August | 53 | –16.4 | –42 | –45 |
| Farm machinery (units) | |||||
| Tractors, 40 HP or more | September | 8,384 | 4.1 | 0 | –6 |
| 40 to 100 HP | September | 5,297 | –5.5 | –8 | –17 |
| 100 HP or more | September | 3,087 | 26.3 | 18 | 20 |
| Combines | September | 896 | 16.2 | –1 | 6 |
Who Owns Midwest Farmland? And Why?
On November 28, 2023, the Federal Reserve Bank of Chicago will hold a hybrid event to explore aspects of Midwest farmland ownership and investments in agricultural ground. Registration is available online.


