

At this time last year, we found ourselves in the midst of likely the worst recession since The Great Depression. Today we continue to make very positive steps toward recovery. In fact, in a technical sense, the recession has ended. Across the board, many broad indicators of activity are increasing, as can be expected in the early stages of a recovery.
However, unemployment remains high, and many businesses are still producing and selling much less than they did two years ago. The recovery will probably be slower than many of us would like, and for some, particularly those looking for work, it might seem like there’s no recovery under way at all.
Current economic conditions lend themselves to very accommodative monetary policy. The question challenging the Federal Reserve in the coming year and beyond will be judging the appropriate timing and pace for reducing the current accommodation. On one hand, removing too much accommodation prematurely could choke off recovery. On the other hand, if the Fed leaves the current level of accommodation in place too long, inflationary pressures eventually will build. The Fed is preparing for these decisions by carefully monitoring business activity and remaining alert for signs of incipient inflation. As always, we’ll make our decisions with confidence about the long-term potential of our economy.
On a personal note, I’d like to extend my appreciation to our staff for their hard work during a very challenging year. Their accomplishments are highlighted on pages 4 and 5. The Chicago Fed’s achievements also speak well of the contributions of our directors in Chicago and Detroit. A special note of gratitude goes to Chicago Board Chairman John Canning as well as to Chicago and Detroit directors Roger Cregg, William Hartman, Michael Kubacki and Linda Likely, who completed their board service in 2009. Thanks also to Chicago director Mark Gaffney for his continuing commitment to the Federal Reserve, as he re-joined our Detroit board in 2010.
And finally, in the wake of the financial crisis, the essay in this year’s annual report offers a thoughtful look at how “art” and ”science” each have an important role to play in a healthy risk management process. I hope you find it informative.

Charles L. Evans
President and Chief Executive Officer
April 20, 2010
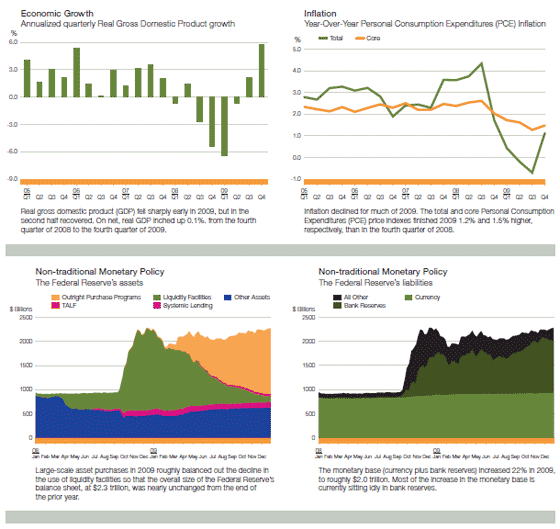
The U.S. economy began 2009 in the midst of a serious recession. Real gross domestic product (GDP) fell sharply in the first half of the year, declining 3.7% on an annualized basis. However, by mid-year, the rapid decline in economic activity had moderated, and real GDP grew at an annual rate of 3.8% in the second half of 2009. As 2010 begins, the economy has entered the early stages of a recovery.
That said, there is still a long way to go to make up the more than 8.2 million jobs that were lost during this recession. Business and household caution, the need to repair balance sheets, and restrictive bank credit are likely to hold back consumer and business spending, leading to a more gradual recovery than what has been typical following previous recessions of this magnitude.
With elevated levels of resource slack holding down cost pressures, the Personal Consumption Expenditures price index ended the year 1.2% higher than in the fourth quarter of 2008. Core PCE inflation, which excludes volatile food and energy prices, was up 1.5% compared with the fourth quarter of 2008, down considerably from the 2% inflation rate at this time in 2008.
The Economy
After falling for four consecutive quarters, real GDP increased at a 2.3% percent annual rate in the third quarter of 2009. Growth then accelerated to its strongest pace in more than six years, increasing at a 5.6% annual rate in the fourth quarter. Many firms that cut production and inventories very aggressively during the recession dialed back their inventory liquidation in the second half of the year, providing a boost to real GDP growth, and business spending on equipment and software began to increase.
Consumer spending also improved in the second half of 2009. In a positive sign, vehicle sales held up well even after the cash-forclunkers program ended. In the housing market, conditions were more mixed. Housing starts stopped falling early in 2009 and leveled off as the year progressed. Sales of existing homes increased sharply through most of 2009–buoyed by homebuyer tax credits and sales of foreclosed homes–but fell markedly around the turn of the year. The overhang of unsold homes has been noticeably reduced, setting the stage for a gradual recovery in new residential construction.
Financial conditions improved considerably over the course of the year. Large firms were again able to borrow at reasonable spreads, both short-term in commercial paper markets and long-term in corporate bond markets. However, the availability of bank credit remained a significant headwind for many small-and medium-sized companies. More generally, credit flows continue to be reduced because both borrowers and lenders are still dealing with losses from the recession, especially in real estate, and businesses and households are wary of taking on new debt burdens in an uncertain environment.
For many households and businesses it does not yet feel like much of a recovery. The unemployment rate increased to 10% by year’s end, up from 4.7% prior to the recession. Many businesses slashed payrolls during the recession. Indeed, employment still fell substantially during the second half of 2009 even as output was increasing. However, toward the end of the year the pace of job loss moderated significantly. In early 2010, some positive job growth occurred and the unemployment rate edged lower. While hiring has remained slow apart from temporary workers, the transition to permanent hiring should ensue once clearer signs of sustained increases in demand are evident.
With such a depressed labor market, workers are seeing little growth in wages and salaries. Combined with tight credit and the substantial loss in household wealth during the recession, these factors mean that consumer spending will gain momentum only as people get back to work.
Monetary Policy
The FOMC left unchanged its traditional policy instruments in 2009, leaving the target federal funds rate between zero and 0.25% and maintaining a spread of 25 basis points to the discount rate. With financial conditions continuing to improve in early 2010, the FOMC increased the spread to the discount rate to 50 basis points and returned the maximum maturity of discount loans to overnight.
As liquidity returned to the financial markets, usage of the Federal Reserve’s nontraditional liquidity facilities declined sharply in 2009. In fact, many of these facilities were closed in February 2010. In contrast, the Fed embarked on a program of large-scale asset purchases designed to improve the functioning of long-term credit markets, consisting of about $175 billion in Agency debt and $1.25 trillion in Agency mortgage-backed securities (MBS), as well as $300 billion in longer-term Treasury securities. Purchases of longer-term Treasury securities were concluded in October, while those for Agency debt and MBS ended in late March of 2010. The Federal Reserve’s asset purchases in 2009 roughly balanced out the decline in the use of liquidity facilities so that the overall size of the balance sheet was nearly unchanged from the end of the prior year.
The rise in the monetary base that accompanied these policies has generated a risk of inflation in the future. This risk is not imminent. Substantial resource slack is exerting downward pressure on inflation, and most of the increase in the monetary base is currently sitting idly in bank reserves where it is not generating spending pressure. However, as the economy recovers, leaving the current policy in place for too long would eventually fuel inflationary pressures. Accordingly, looking ahead, the Fed will have to balance fostering the recovery that is underway with preventing a future build-up of inflationary pressures.
The size of the Fed’s balance sheet could make it more difficult to begin to reduce accommodation when the time comes. The FOMC will address such concerns by using the new instrument of paying interest on excess reserves. When it is necessary to also drain reserves from the banking system, the Fed can turn to reverse repurchase agreements, a term deposit facility, and, if needed, sales of securities from its balance sheet.
Source for all charts: Bureau of Economic Analysis, Federal Reserve Board of Governors H.4.1 Release.
*This essay reflects information available as of April 20, 2010.
PROMOTING INFORMED PUBLIC POLICY AND FINANCIAL STABILITY
- Staff provided high-quality analysis of the financial crisis and regional economy to President Charles Evans and the Board of Directors in support of their policymaking role.
- Analysis included studies of the effect of large-scale asset purchases on long-term interest rates, the markets for credit card and dealer floor plan asset-backed securities, and differences in labor market dynamics during recessions and expansions.
- Specialized research relating to financial markets focused on financial market utilities and just-in-time liquidity.
- Longer-term research projects included analysis of markets for non-prime loans, community development financial institutions, and the relationship between output and inflation in modern empirical macroeconomic models.
ENSURING SOUNDNESS OF THE BANKING
- Supervision of emerging problem banks and bank holding companies intensified in response to weakening conditions in the financial industry.
- This included more frequent examinations, expanded examinations scopes, and many more enforcement actions.
- Overall resources for the supervision function were enhanced and resources re-deployed to the most essential activities.
- Interim targeted exams were conducted at problem banks to assess and identify deteriorating conditions sooner, and dedicated teams were created for problem institutions.
- The Seventh District successfully assumed responsibility for supervising two new large, complex holding companies–GMAC and Discover.
- Unprecedented levels of activity took place in discount window lending and collateral operations, with a 258% increase in collateral volume.
MAINTAINING A STRONG PAYMENTS SYSTEM
- The Federal Reserve System’s Customer Relations and Support Office (CRSO), headquartered at the Chicago Fed, delivered on strategic and operational initiatives while achieving aggressive cost and revenue objectives. These included exceeding sales and electronic access revenue targets in a challenging business environment.
- The CRSO worked closely with national Product Offices to identify cross-business product opportunities and more effectively serve customers.
- Currency-processing staff maintained a strong control environment, improved efficiency levels, and met all performance measures.
- Check-processing staff sustained high levels of performance while transitioning Des Moines check operation in January to the Chicago Midway Office.
- Chicago paper check processing transitioned in September to the Federal Reserve Bank of Cleveland
FOSTERING PRODUCTIVE RELATIONSHIPS
- Bank staff collaborated with a broad range of organizations on neighborhood stabilization efforts, foreclosure prevention, and community development. This effort included hosting more than 30 events focused on foreclosure issues and carrying out a wide variety of other community outreach activities.
- The Bank continued building relationships that improve understanding of Chicago financial markets through participation in the activities of the Working Group on Financial Markets, the OTC Derivatives Regulators’ Forum, and System workgroups.
- The District was successful in partnering with others throughout the Federal Reserve and delivering on System-level responsibilities.
- Money Smart Week in all Seventh District states continued to bring together consumers with organizations and individuals who provide financial education. More than 1,800 partner organizations throughout the Midwest offered roug hly 2,300 events and seminars to thousands of consumers.
- The Chicago Fed unveiled a redesigned Web site in 2009 to make it easier for visitors to find information. Check it out at Chicagofed.org
In what seemed like the blink of an eye, the Great Moderation gave way to the Great Recession. What some had considered the height of economic and financial performance descended into crisis. Practices and personages who were exalted just a few short years ago have retreated to discredit.
The financial crisis has prompted a re-evaluation of many views that had been widely held. To this end, scholars, investors, and policy makers have issued a series of “lessons learned” exposés that are intended as both mea culpas and roadmaps for reform.1 Within them are updated views of how risk should be measured and managed by banks and their regulators.
In this essay, we discuss the balance needed between statistical and intuitive perspectives of risk at financial firms, and why risk management at these firms was out of balance at the time of the recent crisis. The movement in risk management that began in the late 1980s, which stressed more technical methods, prompted a sea change in the skill sets of risk managers. The “artists,” who relied more on intuition to understand complicated risk landscapes, increasingly gave way to the “scientists,” who felt most at home with statistical models.
While the two camps are often seen to be in opposition, art and science each have an important role to play in a healthy risk management process. The models of the scientists can aggregate more data than individuals can. But, the limitations of technical approaches place a premium on those who can see risks that aren’t apparent in the models (for example, the possibility of a housing correction that goes far beyond the bounds of recent experience). The science of these models should be balanced by good judgment.
I. THE REVOLUTION IN RISK MANAGEMENT
“It was the age of wisdom, it was the age of foolishness.”
Charles Dickens, A Tale of Two Cities
People differ in their willingness to accept uncertainty. (Some people sky dive, while others are afraid to board an airplane.) Insurance and financial hedging strategies allow people to express their appetite for risk. Chicago has long been a leading center in both arenas; we are home to a number of the nation’s largest insurance concerns, and to a group of leading derivatives exchanges and clearinghouses.
Arguably, the willingness to take risk is an essential ingredient in the entrepreneurial and inventive spirits that expand our horizons and our standard of living. Markets and institutions that intermediate risk—transferring it from those with low tolerance for uncertainty to those willing to bear it—are important to a well-functioning economy.
Yet is also essential that those institutions manage the risk that they take on in a safe and sound manner. Their failure to do so causes damage to others and to the financial system.
To head off worst-case outcomes, financial companies typically establish a risk “appetite,” which dictates how much uncertainty they are willing to bear. Limits are set to enforce compliance, and regular analysis is undertaken to measure exposure against these tolerances.
Years ago, the management of credit risk (traditionally, the one form of risk most systematically addressed by banks) was largely confined to the evaluation of loan applications. The metric of choice for expressing risk appetite was a ceiling on loan size. Relatively little work was done to analyze risk in the loan portfolio after the initial review of individual applications.
From these humble origins, the science of measuring risk has evolved dramatically during the past twenty years, especially at larger, more complex banks. In the early 1990s, large institutions started looking to traded securities markets to make inferences about asset dynamics. One important innovation that emerged from this investigation was the calculation of correlations among assets. This laid the foundation for the review of portfolios, as opposed to individual holdings.
The importance of looking at things in this context is illustrated by the following example. Consider a portfolio with loans to two entities: a golf course operator and an umbrella manufacturer. Individually, each company faces some weather-related risk: sunny climes favor the golf, while rain promotes umbrella sales. But taken together, their results should be unaffected by the forecast, unless an extreme event like a hurricane arrives to damage both. The risk of the two together is far less than that of the two considered separately.
Risk managers also started using market prices to make inferences about the risk characteristics of assets. For example, the trading patterns for bonds issued by a specific firm were employed to estimate default probabilities for loans made to that firm. The next step in this process was to infer that firms in the same industry or risk class would have similar default probabilities. This step-wise progression allowed analysts to estimate prices for products that were not traded.
This trend coincided with the exponential growth of securitization and derivatives markets. These markets have increased transparency around a broad range of asset classes (See related article). Advances in financial theory and computer speeds, combined with the expanding availability of price information from securitization markets, provided the power behind new approaches to risk management. Entire financial institutions could now be thought of as portfolios, and modern portfolio theory provided a framework to analyze them statistically.
Among the quantitative tools used by modern risk managers are Value at Risk (VaR) (See related article) and Economic Capital (EC). One reason firms like these metrics is that they express the risk of portfolios with a single number, which can be used both as a measure of exposure and as the basis for limit-setting.
In their basic formulations, VaR and EC exercises often rest on two key assumptions which need to be understood (See related article). First, the future is assumed to resemble the recent past. And second, some versions assume a normal distribution for past and future outcomes.
These assumptions lead the signals sent by VaR and EC models to be very procyclical. When times are good, the history used for risk analysis includes few bad days. The implied distribution of possible future outcomes consequently looks benign. As good times extend, the estimated risk presented by a portfolio declines, allowing firms to hold larger positions without requiring larger risk limits.
The movement in risk management toward more analytical methods altered the desired skill sets of risk managers. More and more, the “art” of using informed intuition to navigate complicated risk landscapes was giving way to the “science” of statistical models.
The inherent conflict between risk controls and profits may have accelerated this transition. Bankers were largely rewarded for the profits they produced and often pushed back against risk limits. The pressure to grow earnings and keep pace with competitors may have led the top management at some firms to embrace the view of risk that was most benign. And, in some cases, the more scientific approaches won support by producing the desired outcome.
The careful balance of risk and reward, which is so important to corporate governance, became skewed. Some of this distortion may have been a natural consequence of behavioral and psychological factors known to affect financial decisions (See related article). The behavioral economics and finance literature suggests that when making decisions, people tend to underestimate risk and ignore signals of danger during boom periods.
The steady increase in asset prices during the beginning of the last decade led many firms to become optimistic at the same time. Many organizations used similar models, which gave similar signals and led to similar positioning. Ratings agencies, using analysis akin to that used by financial firms, saw modest risk in the environment and provided high ratings to complicated securities. The lack of diversity among models meant that large groups of investors entered into and exited from markets at the same time, a factor that would become problematic during the financial crisis.
Reflecting the ethos of the day, Charles Prince, the Chairman of Citigroup, observed in late 2007 that “as long as the music is playing, you’ve got to get up and dance.” But then the music stopped.
II. THE FAILURE
“The past does not repeat itself, but it rhymes.”
Mark Twain
It’s difficult to identify precisely when the tide turned. Progressively, markets reevaluated their opinion of house prices, the mortgages which financed them, and the institutions that had exposure to the housing markets.
House prices fell precipitously, catching many models and economists by surprise. Defaults on mortgage loans skyrocketed. Steep asset price declines started to invade previously benign distributions of results, increasing VaR estimates. Models were pushing firms to sell, and ratings agencies rushed to reevaluate. (During a particularly difficult day, $60 billion in mortgage-backed securities was downgraded from AAA to junk status.)
Problems in the mortgage-backed securities markets spread to other markets, in part because some investors needed to raise liquidity and capital to support their now riskier portfolios. The negative cycle was reinforced, and prices became more difficult to ascertain amid the absence of two-way bidding. The expected diversification within portfolios dissolved as correlations between assets increased significantly. The hurricane in our earlier example had arrived.
Liquidity left markets and institutions. Technical and behavioral factors turned dark and fed off one another. The absence of adequate information flow and concerns about transparency fed a rising risk aversion that created severe market dislocations. Investors fled to Treasury securities and banks began to leave substantial excess reserves at the central bank. Many avoided risk at any price.
Capital flows within the economy became seriously impaired. While the Federal Reserve moved decisively to add liquidity to the financial markets, credit availability in many sectors remains a fraction of its former levels. Some think that this represents a potential damper on economic performance.
III. TIME FOR REPAIR
“We must as second best...take the least of the evils.”
Aristotle
The Federal Reserve, along with other policymakers, took bold steps to limit the damage and initiate recovery. This has provided some space and time for reflection.
When conditions go beyond past norms, we can use the experience as an opportunity to learn, revisit accepted dogma, and contribute to change. To this end, financial institutions and their supervisors are pressing on the following themes in the hope of putting risk management on sounder footing.
• Not enough attention was paid to worst-case scenarios of risk management models. Tail events occur much more frequently than normal distributions would suggest,2 and attempts to make adjustments for these “fat tails” were poorly formulated and often ill-received by bankers anxious to take full advantage of rising markets. Evaluating positions under extreme events can provide additional perspective and a potentially more stable basis for assessing exposure.
The challenge here is how to choose appropriate tail scenarios. How bad does the worst case need to be? Can this be done without igniting conflicts between risk managers and those whose risk they manage?
• The use of an immediate past history to project the future proved to be myopic. Risk analysis needs to be more forward looking; spring 2009’s Supervisory Capital Adequacy Program (SCAP, or stress test) took a step in this direction by asking banks to review their positions against an adverse future scenario. Firms are now performing these exercises more regularly.
• Insufficient attention was paid to risks that are less easily measured. Liquidity and model risk (to name two) played key roles in the crisis, yet these were not covered terribly well by existing risk management systems. Financial companies drove to achieve statistical parity with competitors in measuring credit and market risk, but paid relatively little attention to the residual vulnerabilities that models left behind. And only a few brave firms risked short-run disadvantage by adopting a stricter regime than their competitors.
During the past ten years, international capital rules have incorporated VaR and EC approaches into new standards, adding to the momentum behind them. As the shortcomings of these approaches have become apparent, the Bank for International Settlements (BIS) has advanced new ideas for the measurement of risk and capital that attempt to address perceived weaknesses in past practice. These will garner a good deal of discussion during the coming year.
• Unseen linkages between firms and markets must become more transparent, and models must reflect them. Prices tend to become more correlated during high stress periods. Models must also attempt to tackle the messy business of capturing behavioral accelerants that characterize market cycles.
There were gaps in oversight of key financial players, which made these links across firms and markets more difficult to discern. Hence, the call for macroprudential supervision that would allow a broad line of sight across financial companies.
• Corporate governance must be reinforced. From boards of directors that did not adequately comprehend the activities within their firms, to corporate officers with misaligned incentives, to shareholders who should have been asking tougher questions, many of those who might have been in a position to serve as checks did not do so. As part of this, managers should consider that items that are off the balance sheet should remain within risk management’s field of vision.
Related to this, corporate governance and supervisory approaches must take into account the natural tendencies that lead people to overlook potential problems, especially during good times. This can affect both the decision to take on risk and the management of that risk.
Skeptics will certainly note that remedies implemented today cannot guarantee that we’ll never encounter such challenges again. The next crisis will most assuredly not resemble the one just past, and institutional memories will fade as the markets and the economy recover.
Nonetheless, the exercise of correcting revealed weaknesses is one worth undertaking. Risk managers may not have taken the positions that ultimately harmed financial firms, but their models and approaches failed to reveal excesses before it was too late.
IV. CONCLUSION
1Leading “lessons learned” documents would include work from the Group of Thirty, the Senior Supervisors Group, and the IMF, among others.
2 As an example, if stock returns were normally distributed, the market’s performance during the month of the October 1987 crash would be expected to occur only once in 5,800 years. In fact, it was only the third–worst month since 1929.
3This is discussed more fully in Rosen, Richard J. (2009), “Too Much Right Can Make a Wrong: Setting the Stage for the Financial Crisis,” Federal Reserve Bank of Chicago working paper 2009-18.
About the Authors*
 Carl Tannenbaum (left) is a Vice President and Head of the Risk Specialist Division in Bank Supervision. His group is charged with following markets and industries to identify issues that may be problematic for banks and the financial system. Carl joined the Federal Reserve Bank of Chicago in 2008 after almost 25 years with LaSalle Bank/ABN AMRO, where he had various roles in risk management and served as the organization’s chief economist.
Richard Rosen (right) is an Economic Advisor and Senior Economist in the Economic Research Department. His research focuses on several areas including the role of financial intermediaries. Richard joined the Federal Reserve Bank of Chicago in 2003. Before that he taught at Indiana University and the University of Pennsylvania and worked at the Board of Governors of the Federal Reserve System.
*The authors would like to thank David Marshall and Dan Sullivan of the Federal Reserve Bank of Chicago for their ideas and their editorial comments.
Securitization Reigns
A good deal of attention has been paid to the role of models during the recent crisis. Yet human nature may have played an equally important role in reinforcing the extremes that we have witnessed.
 The behavioral economics and finance literature suggests that investors tend to be overly optimistic and overconfident.3 In the risk management context, this can mean that risk managers believe that their models work better than they really do. In addition, something called confirmation bias leads individuals to put a bigger weight on news that confirms what they believe relative to news that challenges their beliefs. Confirmation bias may have made it less likely that risk managers would react to small problems with their models.
Another factor is that risk managers, like many of us, are typically very busy. They have to make decisions about how to allocate their time. If they believe (perhaps because of overconfidence) that they understand a particular class of securities, they may not carefully examine each new security in that class that is acquired. This “rational inattention” may have led to a problem for banks as the bonds issued as part of securitizations gradually became more complicated. Risk managers, because they were busy, may have been focused on other issues.
Added to this, decision makers at banks are investing other people’s money. This agency problem can lead them to make decisions that increase the risk at a bank. For example, shareholders may want banks to yield a certain return on equity each quarter. One way to increase reported return is to increase risk, and many of the complicated securities offer a higher yield (in exchange for higher risk). If shareholders react more to return than to risk, banks may have an incentive to reach for yield by investing in risky securities.
When a crisis comes, behavioral factors can lead to a quick shift from an appetite for risk to an aversion to risk. With their comfort violated, rationally inattentive investors without time to examine their securities carefully opt to “just say no.” This can lead to a flight to safe havens such as Treasury securities and remove liquidity from markets just when it is most needed.
Finding prescriptions to correct behavioral problems is exceedingly difficult. But it is still important for market participants to be aware of these problems.
Is Value at Risk Adding Value?
Risk is a complicated topic with many dimensions. The market risk of a holding (the possibility that its price might decline) can be broken down into myriad subcomponents.
In the late 1980s, the concept of value at risk (VaR) emerged, promising to simplify things. On the surface, VaR is deceptively straightforward. Taking the example of a common stock, the daily price changes in that stock for some past length of time are assembled into a distribution of outcomes. VaR is the draw from this distribution at a certain confidence interval.
 As an illustration, the value at risk for a 99% confidence interval would represent the loss the position would have endured on the 99th worst day out of the last 100 days. (Or if a 1,000 day history was used, the VaR would be taken from the 990th worst day.)
VaR promised to condense the risk of a position or portfolio into a single number. It had other attractions: it promised to put a wide range of holdings on a similar analytical footing, it showed higher levels of risk when markets became more volatile, and it was rooted in actual data as opposed to hypothetical scenarios.
Unfortunately, VaR was sometimes implemented using simplifying assumptions that proved problematic. Time periods for the analysis were too short to capture severe corrections. Adjustments for the non-normalcy of distributions proved incapable of capturing the magnitude of risk that firms might endure. And many of the products that proved to be most volatile were so new that the history needed to assemble a robust VaR simply did not exist.
When positions go on a losing streak, observations invade the left-hand side of the distribution, raising the VaR. If these are sufficiently significant, holdings can exceed their VaR limit, leading to liquidation. The selling mania adds to the losing streak, reinforcing the negativity.
In the aftermath of the recent crisis, VaR regimes are being augmented to make sure they factor in the possibility of extreme events (so-called “black swans”), and, in addition, old-fashioned notional limit regimes are making a comeback. Value at risk will likely remain an important tool for risk managers, but only as part of a larger tool kit.
Behavioral Explanations for Risk Management Weaknesses
A good deal of attention has been paid to the role of models during the recent crisis. Yet human nature may have played an equally important role in reinforcing the extremes that we have witnessed.
The behavioral economics and finance literature suggests that investors tend to be overly optimistic and overconfident.3 In the risk management context, this can mean that risk managers believe that their models work better than they really do. In addition, something called confirmation bias leads individuals to put a bigger weight on news that confirms what they believe relative to news that challenges their beliefs. Confirmation bias may have made it less likely that risk managers would react to small problems with their models.
Another factor is that risk managers, like many of us, are typically very busy. They have to make decisions about how to allocate their time. If they believe (perhaps because of overconfidence) that they understand a particular class of securities, they may not carefully examine each new security in that class that is acquired. This “rational inattention” may have led to a problem for banks as the bonds issued as part of securitizations gradually became more complicated. Risk managers, because they were busy, may have been focused on other issues.
Added to this, decision makers at banks are investing other people’s money. This agency problem can lead them to make decisions that increase the risk at a bank. For example, shareholders may want banks to yield a certain return on equity each quarter. One way to increase reported return is to increase risk, and many of the complicated securities offer a higher yield (in exchange for higher risk). If shareholders react more to return than to risk, banks may have an incentive to reach for yield by investing in risky securities.
When a crisis comes, behavioral factors can lead to a quick shift from an appetite for risk to an aversion to risk. With their comfort violated, rationally inattentive investors without time to examine their securities carefully opt to “just say no.” This can lead to a flight to safe havens such as Treasury securities and remove liquidity from markets just when it is most needed.
Finding prescriptions to correct behavioral problems is exceedingly difficult. But it is still important for market participants to be aware of these problems.


