Export Growth Propelling Seventh District
Some of the Seventh District’s slow economic growth earlier in this decade originated with softness in U.S. exports abroad. The manufacturing sector continues to account for the lion’s share of U.S. exports, especially capital goods such as high-tech electronics and computing machinery, as well as industrial machinery and equipment. As global economic growth has recovered, so have U.S. exports abroad. In turn, parts of the manufacturing-intensive Seventh District economy are being carried along.
Nominal U.S. exports abroad experienced rates of decline of 6.3% and 5.2% for 2001 and 2002. Since then, as the economic growth of our major trading partners has generally accelerated, U.S. export growth has responded, averaging 7.7% over the past three calendar years.
As a group, the Seventh District states of Illinois, Indiana, Iowa, Michigan, and Wisconsin are on par to slightly above the nation in export intensity. The chart below measures relative export intensity as the value of exports originating in Seventh District states as a share of total product.
Figure 1. The export share of gross state product, 2004
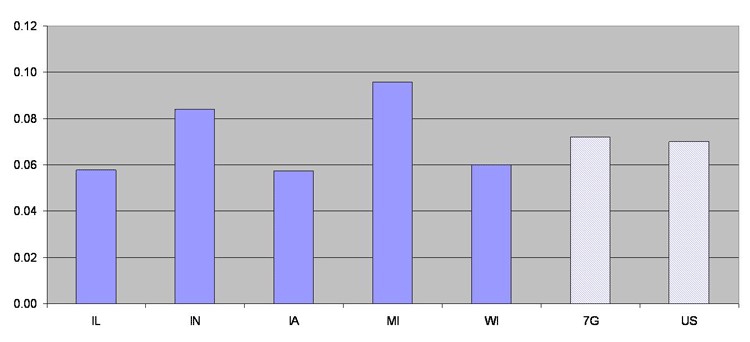
Michigan and Indiana lead the group due to their sharp industry concentration in automotive activity. Automotive production in North America stretches from Ontario through the Midwest into the mid-South and Mexico, with extensive cross-shipment among NAFTA partners Canada, U.S., and Mexico in both auto parts and finished vehicles.
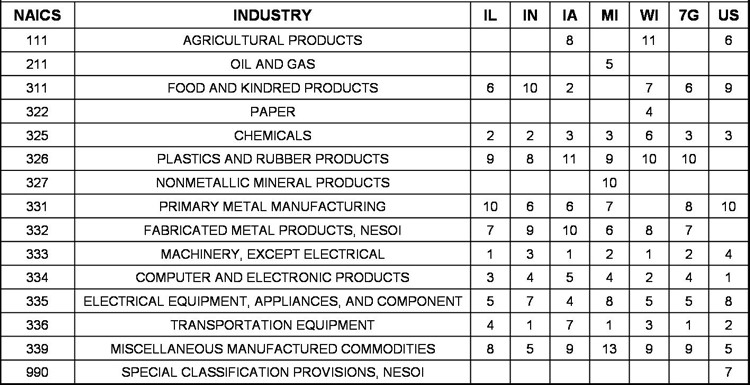
The table below ranks the principal export industries in each state. Transportation equipment ranks number one in Indiana and Michigan. Moving westward, however, Illinois, Iowa, and Wisconsin all have nonelectrical machinery as their number one export category. Here, products such as industrial equipment and machinery for farming, construction, and mining are dominant.
Table 1. Leading export sectors 2004 (rank)
Strong export growth has led overall economic growth in the Seventh District over the past two years. As a whole, nominal exports rose 15.2% from 2003 to 2005, exceeding overall U.S. export growth of 10.5%.
Figure 2. Export growth, percent change 2003-2005
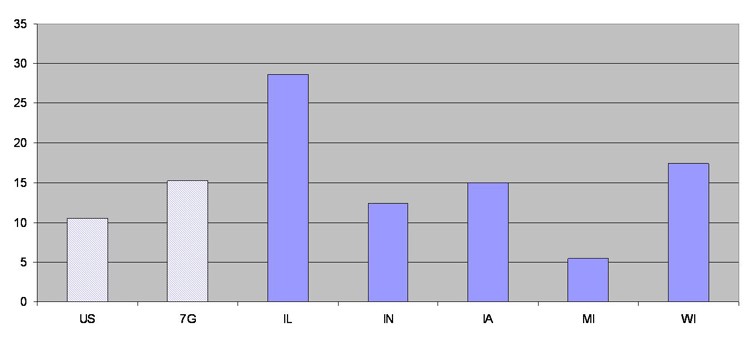
The relative export performance of individual District states from 2003 through 2005 aligns with each state’s particular industry mix. As Thomas Klier indicated in a recent Chicago Fed Letter, weak performance by domestic auto companies is being reflected by flat automotive trade among NAFTA countries. Accordingly, the chart above shows that exports from Michigan have grown at only one-half the pace of the nation and at less than one-third the pace of the remainder of the Seventh District. At the same time, the more capital-goods intensive states of Illinois, Iowa, and Wisconsin are experiencing rapid export growth.


