Midwest housing market update
Following unprecedented home price appreciation nationwide in recent years, homeowners are much concerned about price reversal. In their current Economic Perspectives article, Chicago Fed economists Jonas Fisher and Saad Quayyum find that, on average, much of the recent surge in housing can be attributed to fundamentals such as rising income and favorable demographics, as well as innovations in home lending markets that have allowed renters to become homeowners. (Many of these innovations—such as interest-only loans and adjustable rate mortgages—were discussed in detail at the Chicago Fed’s Bank Structure Conference this spring. The proceedings of the conference were summarized in the September issue of the Chicago Fed Letter.)
While such arguments may provide some comfort to those who worry about the possibility of a bubble in average U.S. home prices, experiences and current conditions differ widely from place to place. Should Midwestern homeowners be more or less concerned about the cooling of residential real estate markets?
Senior Business Economist Mike Munley has been tracking home price developments in the Midwest. Mike reports that, on September 5, the Office of Federal Housing Enterprise Oversight (OFHEO) released its estimates for home price appreciation in the second quarter of 2006. The report included data on the national average of home price changes as well as state averages.
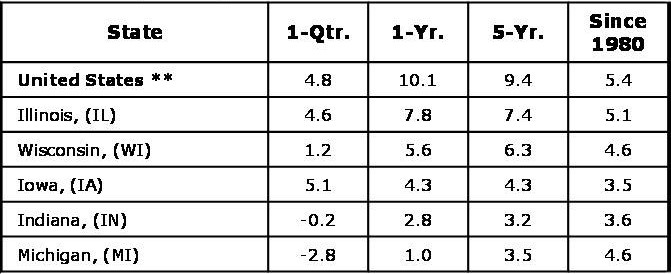
Home prices for the U.S. increased at a 4.8% annual rate between the first and second quarters, the slowest quarterly appreciation since the end of 1999 and just below the average since 1980. As measured year over year, U.S. home prices were up 10% from the second quarter of 2005, which was also slower than the rate of appreciation has been—it topped out at 14% in the middle of 2005.
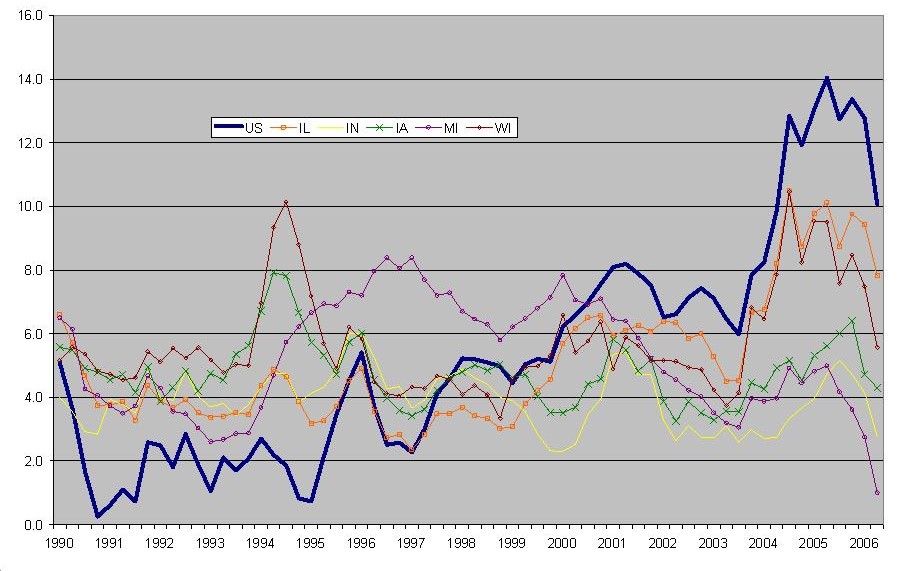
Recent home price appreciation here in the Midwest has also slowed noticeably, and the long term back drop has been much less robust. For the most part, home prices in the Seventh District states have been increasing more slowly than the national average of home prices (see figure 1). On a year-over-year basis, price appreciation in every District state lagged behind the national average in the second quarter of 2006, and Michigan had the lowest appreciation of any state in the nation. In comparison to the first quarter, home values in Indiana and Michigan actually declined. (Maine, Massachusetts, and Ohio were the only other states with declines.) However, home values in Iowa managed to rise slightly faster than the national average.
Table 1. Average annual percent change in OFHEO home price index — 2006-Q2
The city-level data told a similar story. Of the District MSAs (Metropolitan Statistical Areas) covered by OFHEO, only Michigan City-La Porte, IN, showed year-over-year appreciation (10.6%) faster than the national average. Of the bottom 20 MSAs in the U.S., 14 were in the Seventh District, and Ann Arbor, MI, was at the bottom with home prices, down 1.3% from a year ago.
The OFHEO home price data is only one of several sources of information about home prices for the U.S. and some cities. The National Association of Realtors (NAR) releases data on the median sale price of existing single-family homes. In general, the two data series tend to tell the same story—that is, the trends in both data series are similar over time. But, their results are often different in a given month (for regional and national data) or quarter (for city data). The NAR data tends to be more volatile. The NAR data set measures exactly what it sounds like: it is the price of the typical home sold during that quarter. Still, the median price depends on the mix of homes sold during that quarter. If, for example, a large number of inexpensive, starter homes were sold in the second quarter, this would lower the median sale price. By contrast, the OFHEO index is designed to track how the value of an individual home changes over time. OFHEO looks at the appraised value of homes each time a new mortgage is taken out—it is updated when a home gets sold or when the homeowner decides to refinance. OFHEO looks at the value of a large number of homes and is able to estimate the index quarterly. One drawback to the OFHEO index is that it only looks at home mortgages serviced by Fannie Mae and Freddie Mac, and those agencies only service mortgages that are less than $417,000—so the OFHEO index excludes most luxury housing.
The NAR publishes price breakdowns for regions and select metropolitan areas (but not states). In the second quarter of 2006, median home prices nationally were up 3.7% from a year earlier, while median sales prices in the Midwest (which includes the Seventh District, Ohio, and some plains states) were down 2.0%. Of the 24 District MSAs covered by the NAR, five (Chicago, Champaign, Milwaukee, Peoria, and Waterloo, IA) beat the national average, and 14 saw home sale prices down from a year ago. Although the NAR data are more volatile, this data series does confirm that home prices in the Midwest have been increasing more slowly than prices nationally.
There are a couple of reasons why home values have been rising more slowly in the Midwest than the rest of the country. Looking over the long term, the Midwest has generally seen slower home price appreciation since the early 1980s. As shown in figure 1, home values nationally have increased an average of 5.4% per year since then, whereas average appreciation in the District states has ranged from 3.5% in Iowa to 5.1% in Illinois. In part this difference reflects the slower population growth in the Midwest than in the rest of the nation. Since 1980, the U.S. population has increased an average of 1.1% per year, while population growth in Seventh District states has averaged only 0.4%. It follows that demand for housing in the District is not growing as rapidly, which in turn puts relatively less pressure on prices.
Regional differences in home prices also arise from the supply side of the market. In many metropolitan areas, available land for home building is limited by natural barriers such as mountains and waterways. In the face of rising demand for housing, such barriers to expanded supply tend to drive up land and home prices, especially for single-family homes. Further, some areas have chosen to place legal restrictions on home building by imposing growth boundaries or strict zoning requirements and building codes. In some cases where regulations are not well-crafted, evidence suggests that the effect is the same; rising demand for homes is met by rapidly rising prices rather than by expansion of the housing stock. A recent survey report of land use regulations verifies that the Midwest is not especially noted for manmade barriers to housing expansion. Over the long term, the elastic nature of home building in the Midwest region has likely contributed to less pressure on home prices.
More recently, much of the relative weakness in home prices can further be explained by the relatively sluggish economic growth in the region. As I discussed in my recent Mid-Year Jobs Report, job growth here has lagged behind national job growth. That limits income growth in the Midwest, which in turn restricts demand for housing. So while the U.S. has seen a sharp rise in home price appreciation in the past several years, the run-up in the District was less extensive or non-existent. (See figure 1.)
Figure 1. 4-quarter percent change in the OFHEO index
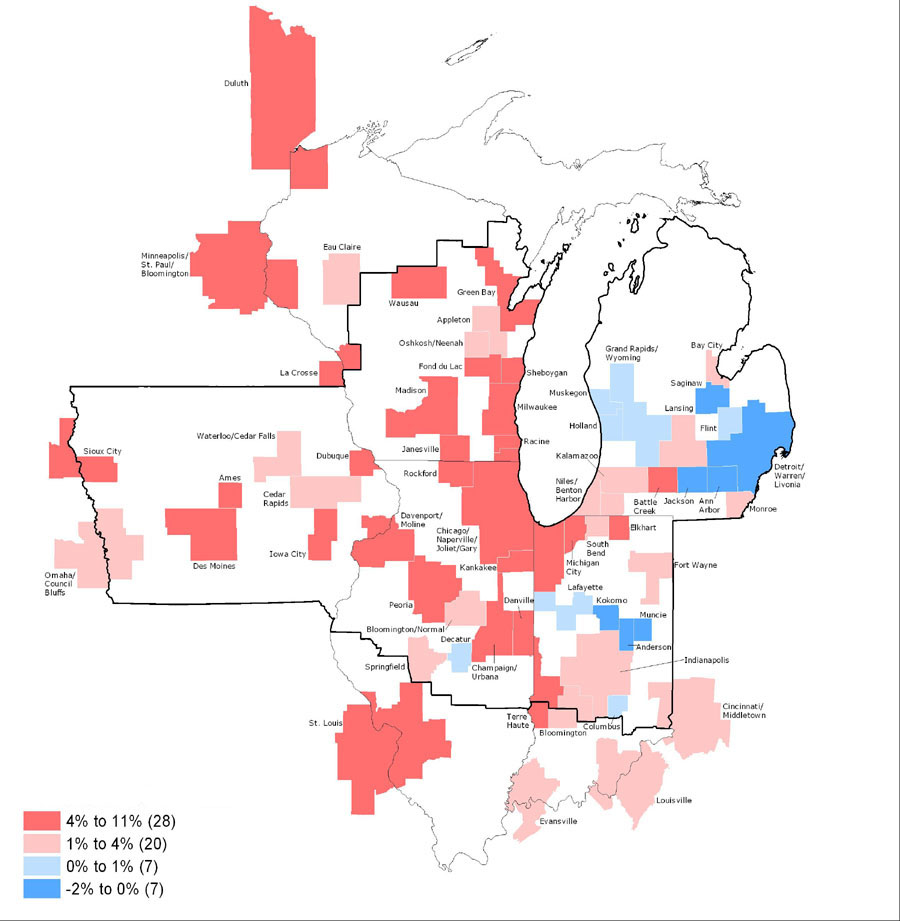
Among states, home price appreciation has recently been running in direct relation to the pace of economic growth. In particular, appreciation has been lowest in Michigan and Indiana, the two states with economies weighed down by structural change in automotive industries.
The figure below illustrates home price appreciation over the past year among metropolitan areas. Those metro areas experiencing depreciation tend to be found in Michigan and in central Indiana. A look back at the metropolitan area map of auto industry job concentration in figure 1 of last week’s blog shows a fairly close correlation between auto-intensity and weak home price appreciation.
Figure 2. House price appreciation
The relative stability of home prices in some Midwest locations is a double-edged sword for the region. Homeowners in other parts of the country were able to cash in on the sharp increases in the value of their homes and use those funds to support their spending. Midwesterners weren’t able to cash in as extensively, limiting growth in retail sales locally.
On the plus side, given all of the popular concerns about a home price bubble, steady appreciation helps abate those worries here. If a sharp run-up in prices is a warning sign of a potential bubble, that sign is largely absent in the Midwest. But this is not to say that the Midwest is immune from the risk of a slowdown in appreciation or price declines going forward. Certainly, overall economic conditions will feed into home prices, as they have in parts of Michigan.
Less appreciation in home prices can also be advantageous in that it keeps homes here more affordable. According to the NAR’s affordability index, homes have historically been affordable in the Midwest in relation to other regions and recently this affordability advantage has improved. Midwestern cities can use this attribute to help attract new businesses and workers.


