Educated (young) workers and regional growth
As the U.S. continues to grow into a knowledge-based economy, human capital and ideas earn a higher premium. Therefore, competition for future economic growth and vitality leaves states and large metropolitan areas vying to attract and retain the young, well-educated population within the U.S., commonly defined as 25- to 39-year-olds with at least a bachelor’s degree. These young and educated adults have certain characteristics that make them particularly appealing to metropolitan areas, such as their especially high mobility and entrepreneurial tendencies.
Among a number of interested parties, policymakers, businesses, and researchers question what attracts these young professionals to certain areas over others. Some of the allure could come from characteristics that are specific to the individual, such as a job offer or personal relationships. However, Yolanda Kodrzycki of the Federal Reserve Bank of Boston, finds that these young professionals also exhibit certain general preferences. They gravitate toward areas that have high job growth, high average pay, and an array of employment opportunities where they feel possibilities and opportunities abound. At this point in their lives, they are the most flexible, and many may still be trying to choose a career path; therefore, a region that will allow them to explore many options is more attractive to these individuals. The payoff to successful “job matching” can be especially high for younger people because payoffs may accrue over a lifetime career supplemented with further learning and development. This implies that certain industry clusters may help attract specialized human capital to a location. A current trend going back two decades has been that cities with a strong technology industry have appealed to a disproportionate number of these young professionals. However, cities that have focused on other knowledge-intensive industries like finance and real estate have done well too. Metropolitan areas that value human capital and maintain a strong regional economy draw in these young and educated individuals.
Besides the direct advantages of high-wage jobs, the clustering of young professionals in an economy provides spillover benefits of knowledge and innovation through networks among firms and workers. Places such as the San Jose area are legendary for frequent job-hopping among workers, who thereby spread innovation more broadly. Such innovations typically involve tacit knowledge and know-how. Looking at patent data, Jerry Carlino has demonstrated how a higher density of skilled workers leads to a higher level of intellectual property.
Aside from economic opportunity, amenities offered by populous urban areas are also thought to attract young professionals. They often prefer to live in lively neighborhood areas within a few miles of the city center and take into account the affordability of this type of housing. Other amenities that appeal to this population include parks or other areas for walking and outdoor recreation, reliable public services including transportation, vibrant neighborhoods, and a dynamic commercial district. However, the extent to which these amenities matter remains the subject of debate and further study.
Warmer climate has been a magnet for the general U.S. population over recent decades. However, cold-weather cities can seemingly compensate with a combination of vibrant economic opportunities and/or big-city recreational and cultural features. The table below, for example, examines working age college-educated migrants from 1995-2000. Although the metropolitan areas that had the five highest net in-migration rates were located in the South and West, both the Minneapolis-St. Paul and Chicago areas posted relatively high net in-migration rates. Indeed, Minneapolis-St. Paul ranked among the top ten highest for that period.
1. Net domestic migration rates for the 20 largest metropolitan areas for the young, single and college-educated: 1995 to 2000
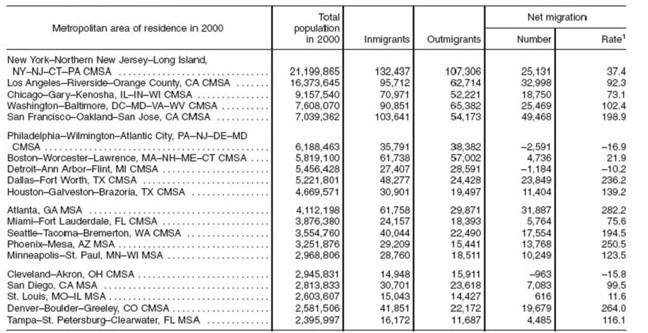
Notes: Data based on a sample. For information on confidentiality protection, sampling error, nonsampling error, and definitions, see the summary file.
A negative value for net migration or the net migration rate is indicative of net outmigration, meaning that more migrants left an area than entered it between 1995 and 2000. Positive values reflect net immigration to an area.
The young are those who were aged 25 to 39 in 2000; the single are those who were never married, or were widowed or divorced in 2000; and the college educated are those who had at least a bachelor's degree in 2000.
Source: U.S. Census Bureau, Census 2000.
A recent discussion paper issued by the New England Public Policy Center further explores the regional concentration of young professionals using data from the 1980, 1990, and 2000 Censuses and the 2005 American Community Survey (ACS).
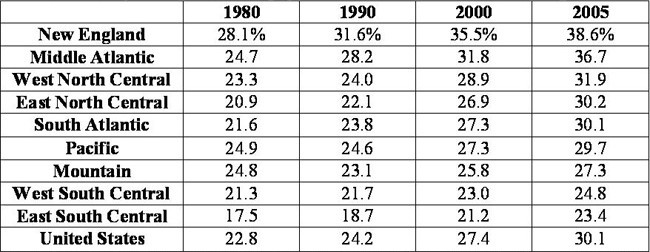
The concentration of young, educated workers in any one region depends on the extent that its young residents achieve college education and the region’s ability to retain them, as well as attracting others from around the U.S. and abroad. As of 2005, New England had the highest concentration of young, educated individuals in the nation, with 38.6% of its 25- to 39-year-olds holding at least a bachelor’s degree compared with 30.1% for the U.S. (see table below). However, overall educational attainment in the U.S. increased between 1980 and 2005, especially between 1990 and 2005 when the number of college educated, 25- to 39-year-olds soared by 22%. The Middle Atlantic, East North Central, and South Atlantic regions outpaced New England’s rise, although they began with lower percentages.
2. Share of 25-39 household population with at least a bachelor's degree
The discussion paper further calculates a net migration rate from 2004 to 2005. The rate takes the difference between the gross inflow and outflow of domestic young professionals in relation to the base population of that age group. Migration rates are calculated as described but multiplied by 1000 to make it a rate per 1,000 residents. Using this measure, only the Mountain, South Atlantic, and Pacific regions have positive net migration rates of 20.4, 10.9, and 1.0, respectively. The two Midwest regions, East North Central and West North Central, had the two most negative net migration rates of -9.5 and
Movements of workers to and from abroad have recently become a more integral part of regional work force composition. Using a similar calculation as above, but only accounting for international inflows due to data limitations, New England comes in second highest with international inflows of 14.4 behind only the Pacific with 17.4. The East South Central region reported the lowest inflow of these individuals with 5.1; West North Central comes in second to last with 7.9. The East North Central barely outpaces West South Central as the fourth and third from the bottom with 11.6 and 11.4, respectively. Again, the Midwest appears near the bottom of the rankings, heightening concerns about not only maintaining or attracting domestic young professionals but gaining international ones. In New England’s case, the net inflow of international young professionals seems to offset the region’s domestic losses, but this does not hold true for some of the other regions, including the Midwest.
Although emphasis has been placed on young professionals, the growth in older workers, those aged 55 and above, will be the largest of any working-age group over the next ten years. The older labor force is projected to grow by 46.7% from 2006 to 2016 — more than five times the projected annual growth rate of the overall labor force of 0.8%. This large projected growth rate results from the aging of the baby boom generation into their “golden years” and still participating in the labor force. Older workers may continue to work due to the removal of the earnings test from Social Security, the increased retirement age for receiving Social Security benefits to 67, decreased employer-provided retiree health benefits, and the improved health status of older individuals.
Another reason for employers and regions to focus on older workers stems from the diminishing education attainment gap between young entering workers and older workers. Dan Aaronson and Dan Sullivan document the dramatic overall rise in educational attainment of the U.S. workforce since the 1970s. Educational attainment has been climbing as younger (more educated) cohorts have been displacing older (less educated) cohorts as they retire. Today, younger workers are only as educated, on average, as those that they displace at the older end of the workforce, and their lesser work force experience may put them at a disadvantage in some respects. All the more reason for employers to turn somewhat to older cohorts for tomorrow’s needed work force skills.
As the number of older workers continues to increase, will firms and policymakers shift some of their attention to retaining or enticing these workers by giving them incentives to extend their careers or possibly return to the work force? Older workers offer benefits to businesses that might not be available from young professionals, such as leadership, experience, and specialized skills gained over their lifetime that can increase productivity and output. On the other hand, these older workers have characteristics quite different from those of young professionals. They tend to prefer more flexible work schedules to balance work and family and to be less mobile geographically. Therefore, they may require a slightly different and possibly more demanding set of economic incentives and living amenities.


