An Uneven Recovery: The Chicago and Milwaukee Labor Markets
The Midwest has benefitted from the recent rebound in manufacturing. Over the past year, total employment in the Seventh District states of Illinois, Indiana, Iowa, Michigan and Wisconsin has increased by just over 145,000 jobs, 40% of which has been due solely to manufacturing.1 The heavy concentration of job gains in manufacturing and related industries has led labor markets in some areas of the Seventh District to benefit more than others.
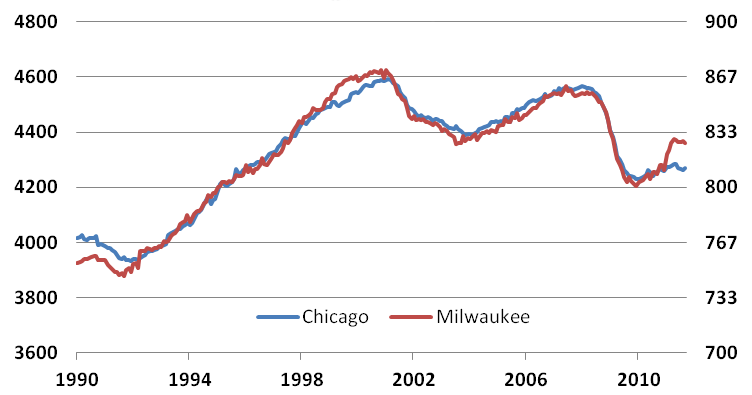
Consider the metropolitan areas of Chicago and Milwaukee.2 Looking at figure 1, one can see that employment levels in the two cities have tended to move in parallel over the past two decades. This is as one might expect for two cities that are so close geographically. However, this correlation has recently faltered. Although the data indicate that the two cities entered the most recent recession in a similar fashion, Milwaukee has seen a much bigger increase in employment during the recovery.
Chart 1. Total employment (thousands)
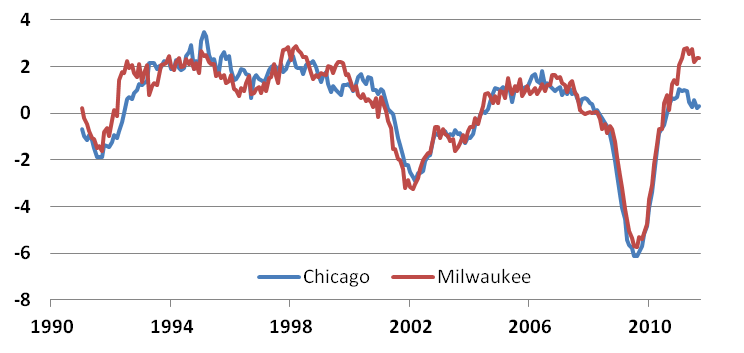
This becomes clearer if one looks at the year-over-year percent changes in payroll employment for each city shown in Figure 2.3 Early in 2010, both Chicago and Milwaukee saw around 1% job growth. Since mid-2010, job growth in Chicago has returned to near zero on a year-over-year basis, while Milwaukee has seen gains of close to 3% percent for a while before also slipping in recent months to a rate of about 2%. In fact, the Milwaukee metropolitan area’s job growth over the past year stands out as one of the highest in the nation.4
Chart 2. Total employment (yr/yr % change)
What could account for this sudden departure from the historical trend? Table 1 shows the percent change in payroll employment in various industries for each city during two time periods: the most recent recession and its recovery. Looking at the first row, one can see that total employment fell by nearly the same amount in both cities in percentage terms during the recession. Furthermore, the remaining rows demonstrate that the concentrations of job losses during the recession were fairly similar across industries with a few exceptions.
Table 1. Percent change in payroll employment by industry
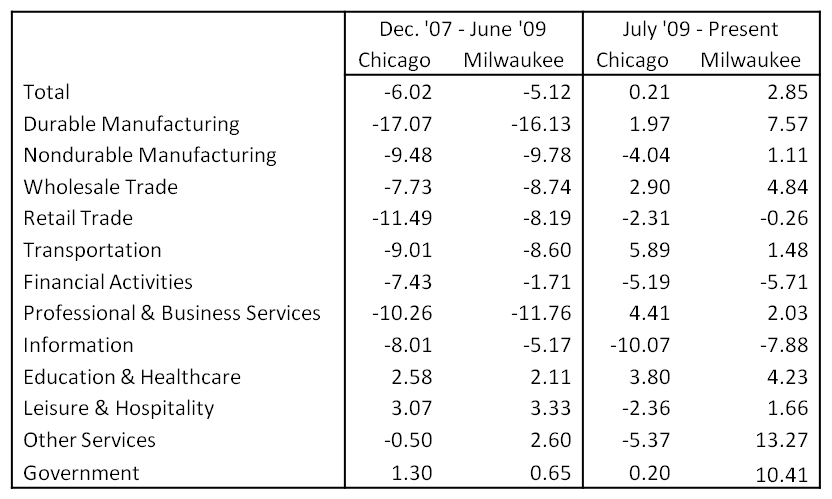
Milwaukee has, however, seen a more pronounced recovery in jobs since the end of the recession. Job growth has been greater for the manufacturing (particularly in durable goods but also for nondurable goods), wholesale trade, education and healthcare, leisure and hospitality, and government sectors in Milwaukee than in Chicago; and only in the professional and business services and transportation sectors does Chicago have the advantage in job growth. Furthermore, decreases in employment in percentage terms in the retail trade and information sectors have been smaller in Milwaukee than in Chicago. Such decreases in the financial sector have been of a similar size in both cities.
To gain more context, one should take note of the relative magnitude of each of these sectors in both cities. Figure 3, which complements table 1, shows the sectoral composition for each city in 2010.5 Overall, the two labor markets were quite similar in industry concentrations heading into 2011. The biggest differences were in durable goods manufacturing and education and healthcare, where Milwaukee had a higher concentration, and professional and business services and government, where Chicago had a higher concentration.
The industries where Milwaukee has seen greater job growth over the past 12 months relative to Chicago account for nearly 76% of total 2010 employment in Milwaukee. These same industries account for roughly 70% of total 2010 employment in Chicago. In this sense, the sectoral composition of the demand for labor has slightly favored Milwaukee’s core industries over the past year. However, this comparison can be a little misleading as it doesn’t take into account the linkages between sectors. For instance, transportation and wholesale trade in Chicago are likely to be influenced by durable goods manufacturing in Milwaukee.
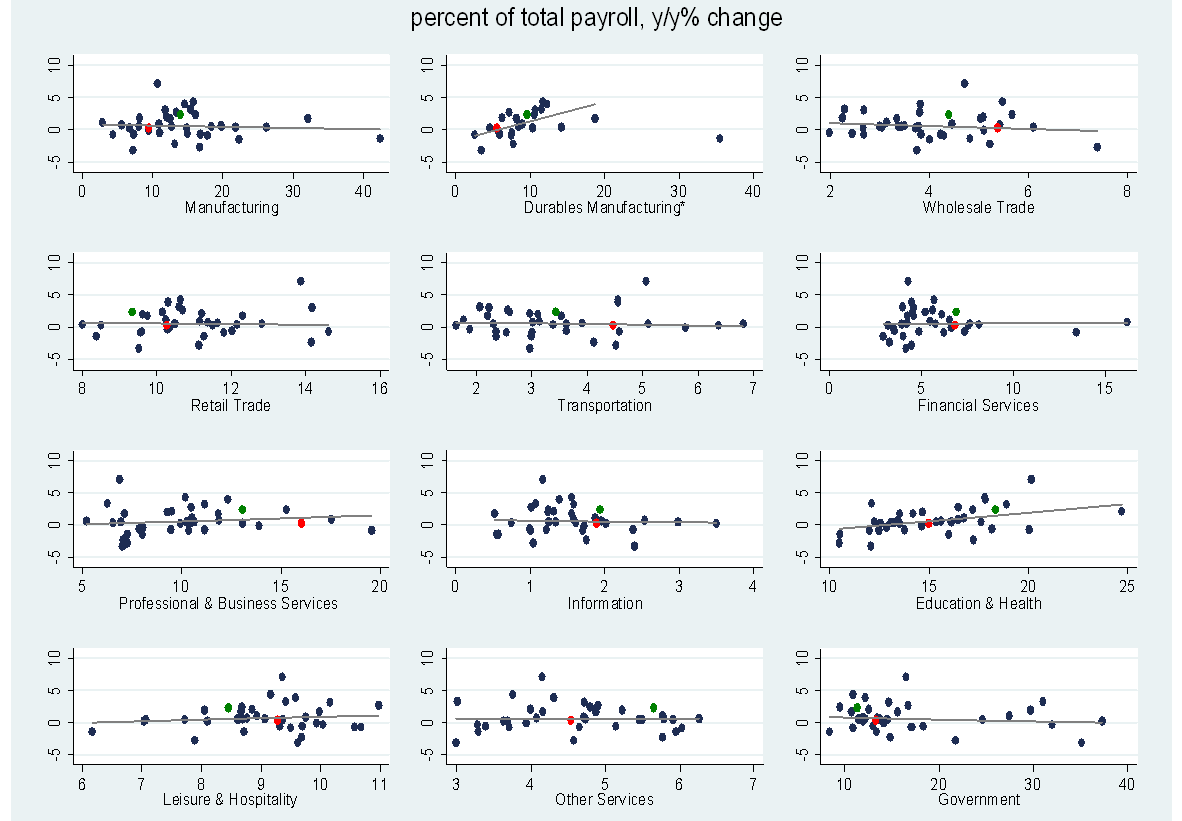
By looking across a large number of metropolitan areas, we can draw finer distinctions that can help us put the year-over-year job growth of Chicago and Milwaukee into perspective. Figure 4 shows a scatter plot and regression line of year-over-year growth in payroll employment6 through September of this year versus each sector’s share of total 2010 employment in 37 different MSAs in the Seventh Federal Reserve District.7
The first thing we notice is that Milwaukee, represented by the green dot, consistently appears above the regression line, meaning that it performs better than the statistical average MSA in the Seventh District in nearly all the sectors we have data on. In contrast, Chicago, represented by the red dot, is essentially on the line in all cases. This result is broadly in line with our direct comparisons discussed before. In most industries, Milwaukee’s employment gains have exceeded the average gains based solely on industry concentration.
A second thing to take notice of is those industries with positive sloping trends, or those in which a higher concentration is correlated with a higher rate of overall job growth in the past 12 months. These industries are durable goods manufacturing and education and healthcare—two sectors in which Milwaukee has both a large concentration and large increases in employment over the past year. In this sense, our statement about the core industries for Milwaukee providing an advantage in labor demand over the past 12 months is more accurate.
Given the two cities’ past history, Milwaukee is not likely to maintain its advantage over Chicago unless the strength in manufacturing continues to outpace that of the service sector. Indeed, in the past three months, the rate of employment growth in the largest employment sector in Chicago, professional and business services, has picked up, while manufacturing’s rate of employment growth has edged lower in Milwaukee. Regardless, the lessons we can learn from this comparison will make it an interesting one to keep track of in the coming months.
Chart 3. Industry as percentage of total employment
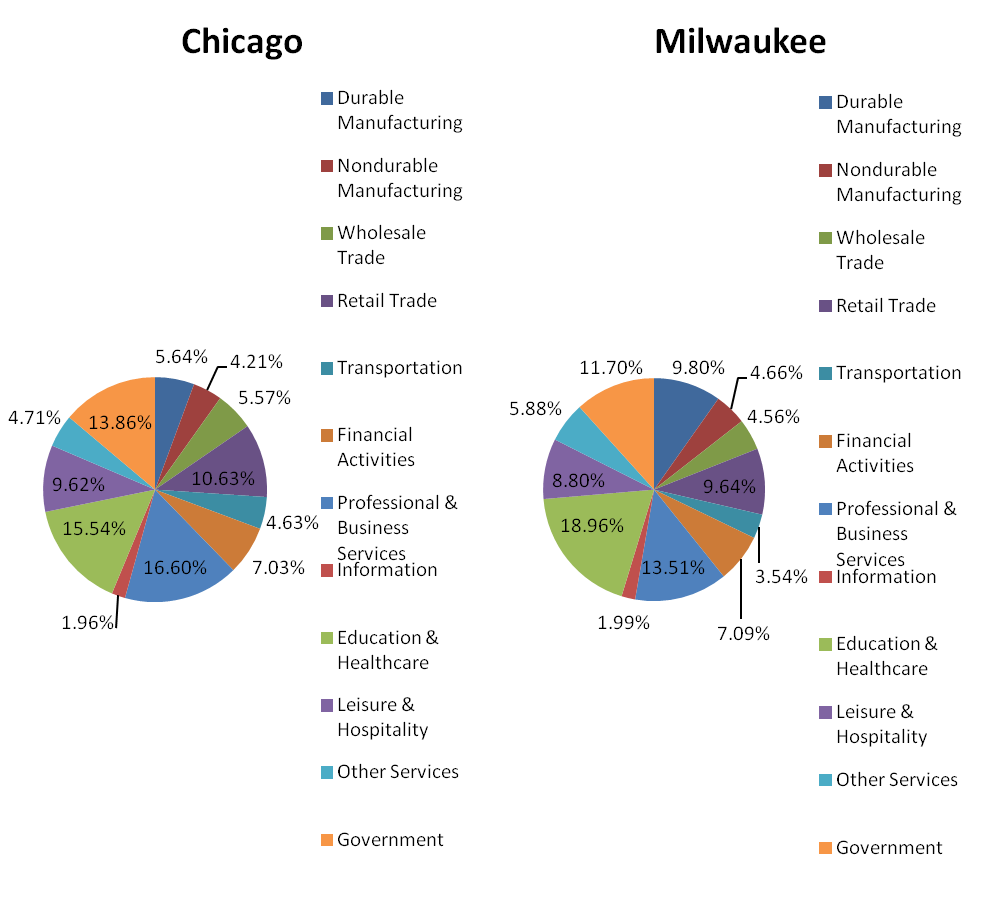
Chart 4. Industry share of employment vs. change in payroll employment
Footnotes
1 These figures reflect State employment data through September 2011.
2 By metropolitan area, we are referring to the U.S. Census Bureau definitions of metropolitan statistical area (MSA) and primary metropolitan statistical area (PMSA), respectively, for Chicago-Naperville-Joliet and Milwaukee-Waukesha-West Allis.
3 Constructing this figure using the broader household survey measure of employment produces a similar result.
4 Joe Taschler, 2011, “Milwaukee area’s job growth leads U.S.,” Milwaukee Journal-Sentinel, October 1, available here; U.S. Bureau of Labor Statistics, 2011, Metropolitan Area Employment and Unemployment Summary, release, November 2, available here.
5 The industry compositions for both Chicago and Milwaukee have changed very little in recent years. The numbers displayed in Figure 3 look essentially identical to the analogous numbers for 2007.
6 A similar exercise was performed with household employment data and achieved nearly identical results across the 37 MSAs and for Chicago and Milwaukee.
7 Because of gaps in reporting, the analysis for durable manufacturing contains only 25 MSAs.


