Updated Estimates of Gross State Product Growth for the Seventh District
This blog serves to expand on our December 2011 Chicago Fed Letter (CFL) by further detailing the estimation process used to produce estimates of annual Gross State Product (GSP) growth on a quarterly basis for the five Seventh Federal Reserve District states. In addition, we preview the estimates of GSP growth for 2011 that will be included as part of tomorrow’s Midwest Economy Index (MEI) release.
Background
Last year, the Chicago Fed began releasing the MEI, a weighted average of 134 state and regional indicators that measures growth in nonfarm business activity. Two separate index values are constructed, the MEI (absolute value), which captures both national and regional factors driving Midwest economic growth, and the relative MEI (relative value), which provides a picture of the Midwest’s economic conditions relative to the nation’s.
MEI values correspond to deviations of growth in Midwest economic activity around its historical trend. Values above zero indicate growth above its historical trend, and values below zero indicate growth below trend. For the relative MEI, a positive value indicates that regional growth is further above its trend than would typically be suggested based on the current deviation of national growth from its trend, while a negative value indicates the opposite.
Together, the MEI and relative MEI provide a picture of the Seventh District’s state economies that is closer to being in real time than does the BEA’s GSP data. By exploiting the historical correlation between GSP growth in each of the five states and the MEI, we are able to produce quarterly estimates of GSP growth ahead of the annual BEA release of GSP data.
Methodology
The statistical model we use to explain the annual growth in GSP for each Seventh District state is as follows:
![]()
The model succinctly summarizes the historical relationships between national (real GDP growth), regional (MEI and Relative MEI), and state-specific (lagged GSP and state real Personal Income growth) factors driving each Seventh District state’s GSP growth since 1979.
State-specific growth factors dominate in explaining Indiana’s, Iowa’s, and Michigan’s GSP growth, while national factors dominate in explaining Illinois’s and Wisconsin’s. Regional growth factors, on the other hand, vary in importance from 11% in Michigan to 39% in Wisconsin and are above 20% of the explained variance for Illinois, Indiana, and Wisconsin.
The regression coefficients estimated for our model are listed in the table below. Each coefficient represents the “effect” of each input on GSP growth. For example, a 1% increase in GDP growth leads to about a 0.5% increase in GSP growth across the Seventh District states, with the effect slightly higher for Illinois and Iowa and slightly lower for Indiana and Michigan (second row).
Table 1
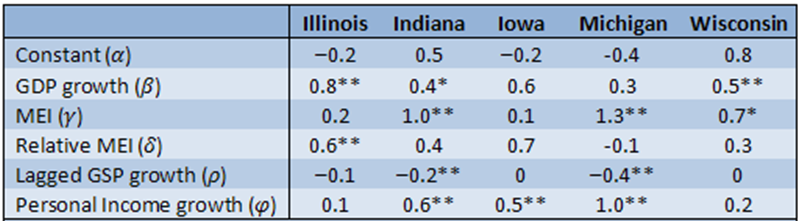
** Significant at the 1% level
By plugging the latest data for GDP, MEI and relative MEI, state Personal Income, and GSP into the above equation, we can use the regression coefficients above to obtain a GSP growth projection for the current year. The remainder of the blog details how this process works in practice.
Data
To make our out-of-sample predictions of GSP growth using the above model, we need current year values for all the inputs in our regression. Lagged GSP growth is available, but in the first three quarters of a year quarterly GDP growth, state Personal Income, and the monthly MEI and relative MEI only cover part of the year.
To obtain the annual growth rate in state Personal Income and national GDP in the first three quarters of the year, we average the quarterly values available in the current year and take the log first difference from the quarterly average of the prior year. In this respect, once every quarter we are able to make a prediction of annual GSP growth for each state based on year-to-date growth in these measures.
The MEI and relative MEI predictions are similarly constructed using the March, June, September, and December MEI values. Since the MEI and relative MEI represent three-month moving averages, the March MEI number captures the first quarter of activity, the average of the March and June MEI numbers captures the first two quarters of activity, and so forth.
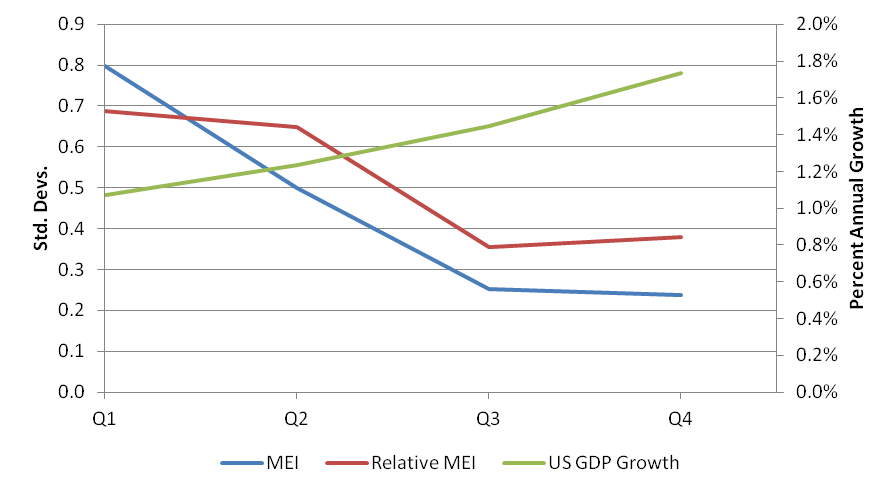
Shown below are the regional (left-hand scale) and national (right-hand scale) growth factors described above. Both the MEI and relative MEI began the year nearly one standard deviation above their historical averages, suggesting that the Midwest Economy experienced rates of growth that were both above-average and higher-than-normal given the level of national growth. During this same period GDP growth was very weak; but over the course of the year, the national economy strengthened while the Midwest economy expanded at a slower rate.
Chart 1. Regional and national data
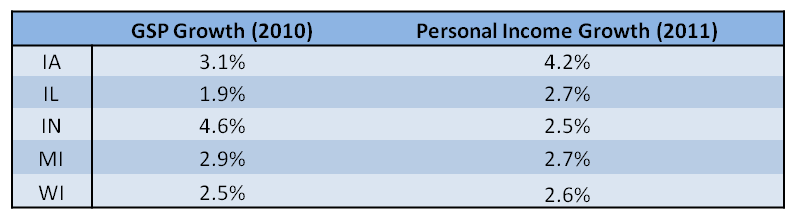
Coming into 2011, there was considerable variation in state-specific growth factors with Indiana standing out as having by far the highest GSP growth rate in 2010 among the five Seventh District states and with Illinois having the lowest. In 2011, however, the state Personal Income data suggest Iowa experienced stronger growth than the other four District states, and Indiana and Illinois were instead clustered closely together with the remaining two District states.
Table 2
Forecasts
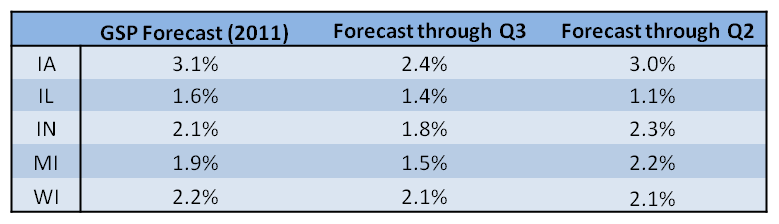
Projections for annual GSP growth made through the second quarter, third quarter, and for all of 2011 in each of the five Seventh District states are displayed below. The growth projections for Iowa, Indiana, Michigan, and Wisconsin exceeded national GDP growth in 2011, while Illinois is projected to be slightly below the national growth rate.
Table 3
The diversity we see across states is a direct consequence of the results for national, regional and state-specific growth factors mentioned earlier. For instance, Illinois’ relative weakness among the five states stems primarily from modest GDP growth in 2011, on which its forecast heavily depends. Weaker national growth is also responsible for the lower rate of GSP growth for Wisconsin in 2011.
On the other hand, the lower rate of GSP growth for Michigan in 2011 can be traced back to expected mean reversion offsetting the positive contributions of the MEI and personal income growth. Strong regional and state-specific growth factors boost GSP growth in Indiana above Illinois and Michigan, whereas state-specific growth factors, particularly high personal income growth in 2011, keep Iowa’s GSP growth rate steady from 2010 and much higher than the other states in the District.
The variation over the course of the year in our forecasts is also informative. Illinois’ GSP growth forecast strengthened throughout the year as national GDP growth increased. Wisconsin’s GSP growth forecast was also strongly influenced by national factors; but being more affected by regional factors than Illinois, increased only slightly over the course of the year. GSP forecasts for Iowa, Indiana, and Michigan all rebounded in the fourth quarter after weakening in the third quarter, closely mirroring the pattern of the Personal Income data for each state.
Conclusion
Our quarterly estimates of GSP growth can be found as part of the press release for the MEI following the third release of national GDP data for each quarter. The 2012 release schedule for the MEI can be found online.


