Wage growth in the Seventh District’s manufacturing occupations
A strong surge in manufacturing output has been one of the hallmarks of the U.S. economic recovery since the 2008–09 recession. Along with this resurgence in production, manufacturers have also expanded their hiring following years of net job declines. Even before the recession, manufacturing employers and their trade associations voiced disappointment and concern about the “poor” availability of higher-skilled workers, who were needed to replace retirees. And as the recent manufacturing recovery has unfolded, employers have once again voiced these same complaints.1 Additionally, as some industry observers have noted, during the recession and recovery, manufacturers have advanced their production technologies more rapidly to survive and to stay profitable. Accordingly, workers of ever-higher skills are needed to operate, monitor, maintain, and program advanced equipment, such as computer numerically controlled machines and robotic tools.
n this blog entry, we examine these trends in terms of wage and job growth within the states of the Seventh Federal Reserve District,2 as well as across the nation. In doing so, we draw on data reported for hourly wages across individual occupations in the manufacturing sector. Further, these occupations have been classified and grouped according to the levels of skills and background preparation needed to carry out the attendant work—i.e., both formal schooling/training and on-the-job experience. Because of the recent claims that the demand for higher-skilled manufacturing labor has heightened, we compare experiences of the recent recession and recovery periods with those that took place earlier in the 2000s.
We find that:
- Within both the period 2000-07 as well as 2007-11, wage growth has been more rapid for jobs in those occupational groups that are classified as requiring higher skills and preparation.
- For the 2007–11 period as compared to the 2000–07 period, wage growth has seemingly slowed for all skill-level groupings in the manufacturing sector.
Data
Data on hourly wages and the number of people employed are gathered annually by the Bureau of Labor Statistics of the U.S. Department of Labor in its Occupational Employment Statistics (OES) program.3 As the database name suggests, these data are classified by the primary occupation of each surveyed employee, and the OES program uses over 800 occupational classifications. In addition, these data are available for the nation as a whole and they are also broken down by geography—i.e., by states, metropolitan areas, and rural divisions.4
In the following analysis, we use OES data for those occupations that can be predominantly found in manufacturing industries. To identify such occupations, we rely on O*NET (Occupational Information Network)—which is the nation’s primary source of occupational information intended to help prospective employees in their search for work.5 We examine data for occupations with a range of 49%–100% representation in the manufacturing sector at the national level, according to O*NET (this range may vary somewhat more by region).6 For example, at the national level, an estimated 96% of tool and die makers are employed by manufacturing companies, and 49% of automotive engineers are employed by manufacturing firms. In many of these occupations, employees outside of manufacturing companies may produce services (i.e., automotive design/engineering), which are ultimately purchased by manufacturing companies and which are embedded in manufactured products.
Since we are interested in skills and wage trends by occupation, we also focus on the “skill zone” groupings of the various occupations as classified by O*NET. Occupations are grouped in O*NET into one of five “Job Zone” categories, which are defined on the basis of “levels of education, experience, and training necessary to perform the occupation” (the higher the Job Zone number, the higher level of education, experience, and training required).7 In the analysis to follow, the manufacturing occupations are grouped into one of the first four job zones. None of the Job Zone Five occupations (with “extensive preparation needed”) meet the criterion of having at least 49% of currently employed workers in the manufacturing sector.
Findings and Discussion
In the table below for the Seventh District and the nation, average hourly wages for manufacturing occupations are reported for two time periods: 2000–07 and 2007–11.8 These periods are chosen for their business cycle similarity. That is, both the year 2000 and the year 2007 precede the onset of a recession, and both the year 2007 and the year 2011 are in the recovery/expansion phases following a recession. Importantly, however, 2007 represents a year that is five years following the business cycle trough (i.e., the 2001 recession), while 2011 represents a year that is only two years out from the trough (i.e., the 2008–09 recession). For this reason, we may expect some (unknown) dissimilarity among wage and hiring trends by skill level to the extent that employers’ demand for workers vary over the business cycle (e.g., by the time elapsed from the end of a recession).
According to O*NET, Job Zone One (which we refer to as skill zone 1) includes occupations such as hand grinding and polishing workers, slaughterers/meat packers, and production helpers. At the other skill extreme, Job Zone Four (skill zone 4) includes such occupations as materials, mechanical, and industrial engineers, as well as aerospace engineering technicians. Additionally, Job Zone Three (skill zone 3) occupations include computer numerically controlled machine programmers, along with machinists and tool and die makers. Finally, Job Zone Two (skill zone 2) encompasses occupations such as welders and many varieties of machine operators and setters.
As seen below, occupations in skill zone 2 make up a large majority of the manufacturing jobs found in the Seventh District. Along with jobs in skill zone 1, these jobs have been declining as a share of total manufacturing jobs in the Seventh District since year 2000. In contrast, higher-skilled occupations in skill zones 3 and 4 have come to comprise a larger share of manufacturing jobs.
Chart 1. Job by skill zone (percent of total)
With these caveats about the proportions of jobs in the different skills zones in mind, we present below a table that reports average hourly wages by occupation, with occupations grouped into the four skill zones. From the table, it is clear that the annual pace of wage growth has slowed from the earlier period to the later one. This is not surprising given the sharp declines in payroll employment that have taken place since 2007 in the manufacturing sector. In the U.S., for example, from the fourth quarter of 2007 through the fourth quarter of 2009, employment declined by 16.4% (2.25 million jobs).9 Since the fourth quarter of 2009 until the second quarter of 2012, manufacturing jobs have grown by 457,000, thereby gaining back 20.3% of the decline.
Table 1. U.S. manufacturing average hourly wages by skill zone
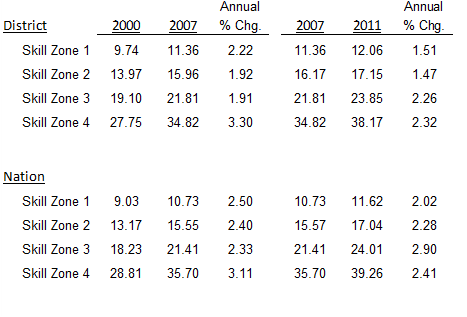
Chart 2. District wages by skill zone (annual percent change)
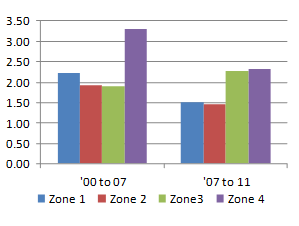
Looking across the skill categories for any given year, one can see that wages generally rise more sharply, the higher the skill zone. Wages in the lowest manufacturing skill zone are less than one-third of those found in the highest manufacturing skill zone. Even more striking is the widening of wages between skill levels that has taken place in both the Seventh District and the nation over the past decade. Much as in the overall economy, those manufacturing occupations requiring greater skills have experienced faster wage gains.
Making a more granular comparison of the later period with the earlier one, we note that occupations in skill zone 3 have seemingly experienced a relative pickup in wage growth. During the 2000–07 period, average wages in these occupations grew at a similar pace to those in skill zones one and two. In contrast, by the latter period, in both the Seventh District and nation, skill zone 3 wages were outpacing those of (lower) skill zones 1 and 2, and were rivaling wage growth in (higher) skill zone 4. To some extent, then, this evidence is consistent with recent claims of manufacturing employers that workers with higher skills are in short supply and high demand. For example, the hourly wage of “electro-mechanical technicians” rose by over 5.0% annually from 2007 to 2011 in the Seventh District, while the hourly wages of “medical equipment operators” rose by 7.6 percent annually.10 Both of these occupations lie in the skill zone 3 category. Over the same period, skill zone 2 “computer controlled machine tool operators” reported a 1.3 percent annual wage growth over the period; “welders, cutters, solderers, and brazers” (in skill zone 2) reported 1.7 percent annual gains.
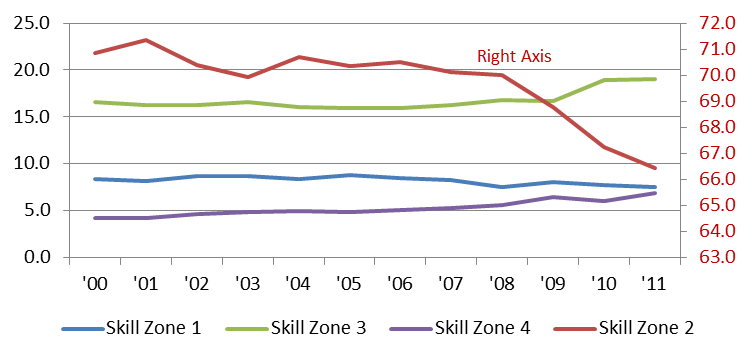
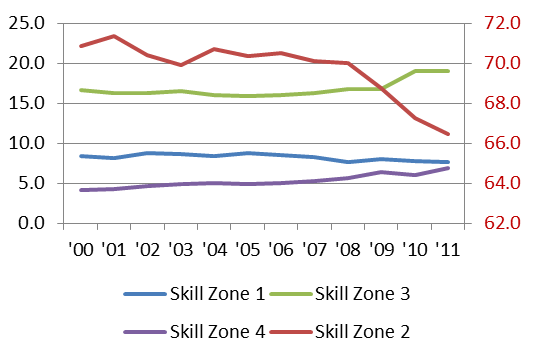
General comparisons of employment growth also speak to a relatively stronger demand for manufacturing workers in higher skill zone categories. The charts below display the shares of workers in each skill zone over time for both the Seventh District and the nation. Trends for skill zones 1, 3 and 4 (blue, green, and purple) are to be read off of the left-hand vertical axis; trends for skill zones 2 (red) is to be read off of the right-hand vertical axis. The trends seen are consistent between the Seventh District and the nation. That is, the share of manufacturing workers in the lower skill zones (1 and 2) have been on the decline, with skill zone 2 jobs falling sharply since 2007. In contrast, jobs in skill zones 3 and 4 have been rising as a share of overall employment in manufacturing. In particular, the share of skill zone 4 occupations—many of which are as engineers and engineering technicians—have been rising continually since 2000. The share of skill zone 3 workers has been rising in both the Seventh District and in the nation, especially over the past three to four years.
Chart 3. U.S. jobs by skill zone (percent of total)
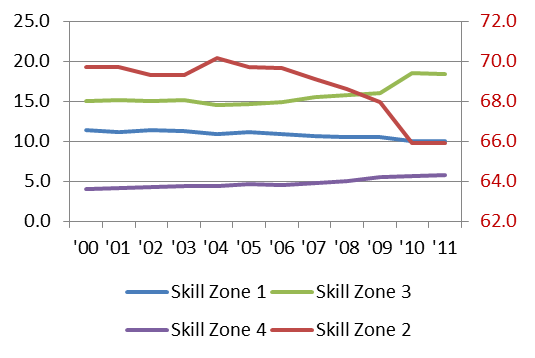
Chart 4. District jobs by skill zone (percent of total)
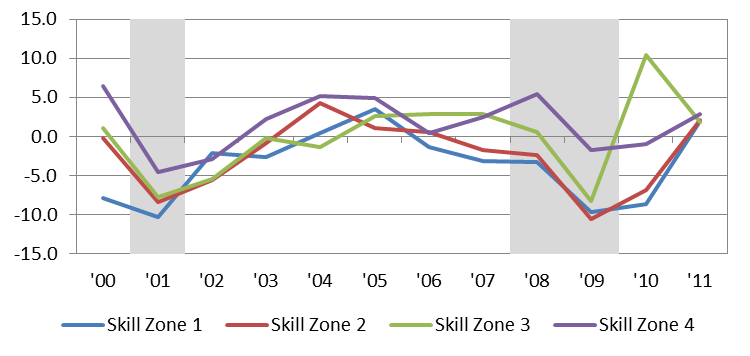
While these trends tend to echo the manufacturing sentiments being heard today, a cautionary note would be that these data reflect an early point in the nascent economic expansion following the Great Recession. We are only two years into the recovery/expansion of the business cycle (using 2011 as the most recent data available). The chart below expresses these same employment data as year-over-year changes for the U.S. Here, data for all four skill zones can be read off of a single vertical axis. During the expansion following the 2001 recession, growth in higher-skilled manufacturing jobs recovered earlier than that in lower-skilled manufacturing jobs, with some catch-up growth taking place by 2004 and 2005 (three to four years following the recession). Similar trends in manufacturing job growth may yet emerge during the post-2011 years of the economic recovery.
Chart 5. U.S. manufacturing jobs (percent of total)
The manufacturing work force has been “upskilling”—i.e., this sector, like so many other industries over the long term, has seen improvements in average skill levels; the manufacturing sector’s composition of jobs has been shifting toward those occupations requiring more skills and preparation. According to the data on wages and employed workers as categorized by their occupational skill zone, this is no less true during the recent recession and recovery so far than during the earlier years of the 2000s.
Footnotes
1 For example, see “U.S. Manufacturing and the Skills Crisis,” Wall Street Journal Online.
2 The entirety of Iowa and the majority of Illinois, Indiana, Michigan, and Wisconsin are in the Seventh District.
3 See the BLS OES, which states: “The Occupational Employment Statistics (OES) program produces employment and wage estimates for over 800 occupations. These are estimates of the number of people employed in certain occupations, and estimates of the wages paid to them. Self-employed persons are not included in the estimates. These estimates are available for the nation as a whole, for individual States, and for metropolitan and nonmetropolitan areas; national occupational estimates for specific industries are also available.”
4 In making wage comparisons by occupation over time, the inherent information must be discounted to some extent, especially over short time period comparisons at the local and regional level of geography. That is because the data collection methodology of the OES uses a rotating three-year panel of establishments (i.e., each establishment drops out after three years of continuous reporting). Any single year’s reported data for a region represents a three-year moving average of sampled observations. For the currently reported period, past observations are brought forward in time by using national level average estimates of change by occupation. In the process, some local information is then lost while gains are made in both data up-to-dateness and larger sample size for the current year’s reported data.
5 See here. O*NET was developed under the sponsorship of the U.S. Department of Labor/Employment and Training Administration (USDOL/ETA) through a grant to the North Carolina Department of Commerce.
8 The latest year for which data are reported is 2011. Wages level comparisons across individual years, as well as comparisons across time periods, may not be wholly comparable because occupational composition is subject to change. Occupational classifications are sometimes dropped or added from year to year.
9 These data are seasonally-adjusted payroll jobs as reported by the BLS/Haver Analytics.
10 There is much variation in wage experience within the same work skill zone. For example, over the same period skill zone 3 “tool and die makers” reported small annual wage declines.


