An Update on 2012 GSP Growth Forecasts
In 2011, the Chicago Fed began providing quarterly estimates of annual GSP growth for each of the five states in the Seventh District in its Midwest Economy Index (MEI) releases. In this blog, we present what we’ve forecasted for each state in 2012 along with an explanation of the factors behind our projections.
Background on the Midwest Economy Index
The MEI is a weighted average of 129 state and regional indicators that measure growth in nonfarm business activity. Two separate index values are constructed, the MEI (absolute value), which captures both national and regional factors driving Midwest economic growth, and the relative MEI (relative value), which provides a picture of the Midwest’s economic conditions relative to the nation’s.
MEI values correspond to deviations of growth in Midwest economic activity around its historical trend. Values above zero indicate growth above its historical trend, and values below zero indicate growth below trend. For the relative MEI, a positive value indicates that regional growth is further above its trend than would typically be suggested based on the current deviation of national growth from its trend, while a negative value indicates the opposite.
Together, the MEI and relative MEI provide a picture of the Seventh District’s state economies that is closer to being in real time than does the BEA’s annual GSP data. By exploiting the historical correlation between annual GSP growth in each of the five states and the MEI, we are able to produce quarterly estimates of annual GSP growth ahead of the annual BEA release of GSP data.
Forecasting GSP Growth
The statistical model we use to explain the annual growth in GSP for each Seventh District state is as follows:
![]()
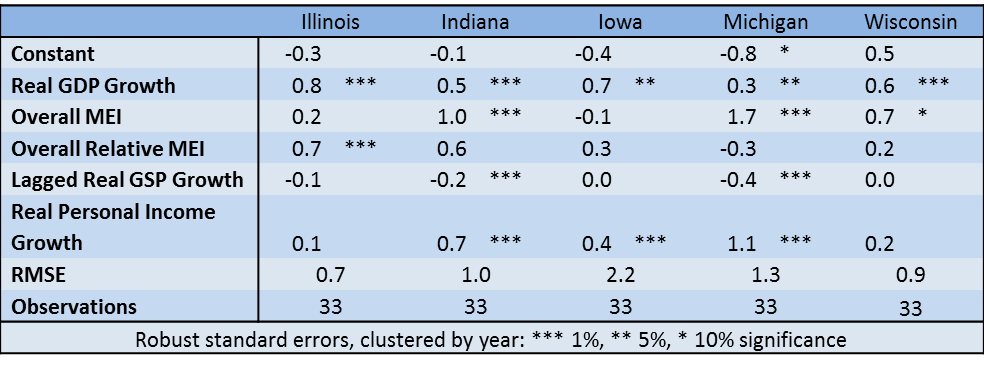
The model succinctly summarizes the historical relationships between national (real GDP growth), regional (MEI and Relative MEI), and state-specific (lagged GSP and state real Personal Income growth) factors driving each Seventh District state’s GSP growth since 1979.
The regression coefficients estimated for our model using data through 2011 are listed in the table below. Each coefficient represents the “effect” of an input on GSP growth. For example, a 1% increase in real GDP growth leads to about a 0.5% increase in GSP growth across the Seventh District states, with the effect slightly higher for Illinois and Iowa and slightly lower for Indiana and Michigan (second row of the table).
Table 1
By plugging the latest data for real GDP growth, the MEI and relative MEI, state real Personal Income growth, and lagged GSP growth into the above equation, we can use the estimated regression coefficients from our model to obtain a GSP growth projection for 2012.
2012 Forecast
Projections for annual GSP growth for each of the five Seventh District states are displayed below. Coming into 2012, Iowa and Michigan stood out as having significantly higher GSP growth rates than the other three District states. In 2012, our growth projections suggest that GSP growth in Indiana outpaced the remaining District states and also exceeded the 2.2% annual growth in national GDP. GSP growth rates for Wisconsin, Illinois, Iowa, and Michigan are projected to be below the national growth rate.
Table 2
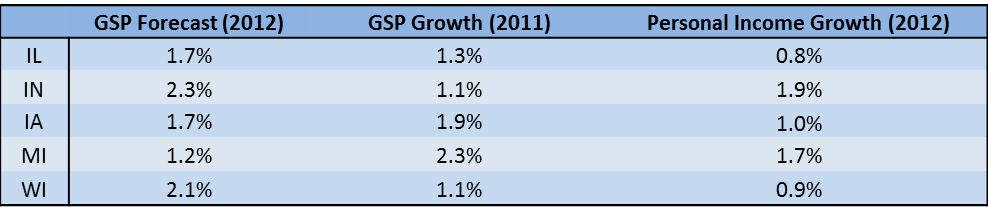
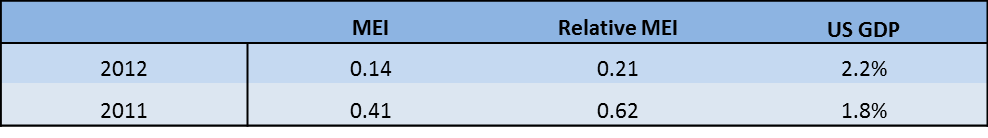
Looking at the inputs into our projection, state real Personal Income growth data similarly suggest that Indiana experienced stronger growth than the other four District states in 2012, with Illinois showing the weakest growth in real personal income. In the region, growth in economic activity weakened last year with the MEI falling to an annual average of 0.14 compared to 0.41 in 2011. Growth relative to the nation also declined, decreasing to 0.21 from 0.62 in 2011; while 2012 US annual GDP growth edged up to 2.2% from 1.8% in the previous year.
Table 3
Factors Behind Our Projections
As we’ve seen from the regression coefficients above, each state’s forecast is affected differently by the five inputs to our model. To further illustrate this point, we’ve broken down in the table below each state’s projected GSP growth into the expected contributions from national, regional, and state factors.
Table 4
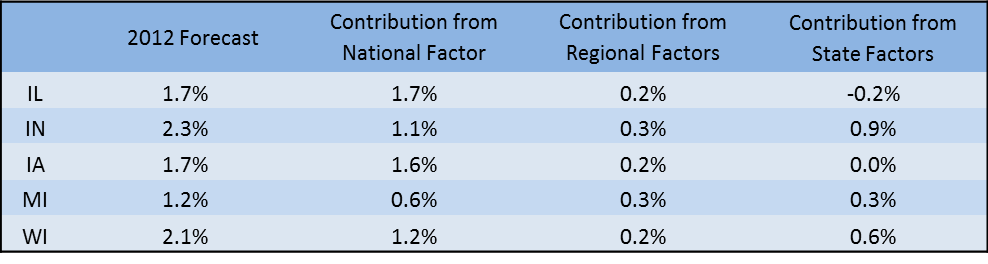
This decomposition of growth makes clear what contributed to the diversity in GSP forecasts across the District states in 2012. For instance, Michigan’s relatively weaker forecast among the five states stems primarily from its much lower expected contribution to growth from national factors. In contrast, national factors benefit Illinois and Iowa’s projections. Indiana and Wisconsin’s relatively robust forecasts, on the other hand, come primarily from state growth factors. Regional growth factors contributed about the same to each state’s 2012 projection.
Conclusion
Our quarterly estimates of GSP growth can be found as part of the press release for the MEI following the third release of national GDP data for each quarter. The 2013 release schedule for the MEI and the GSP growth forecasts can be found here.


