Differences in State Safety Net Spending
The social safety net in the United States consists of dozens of anti-poverty programs on the local, state, and federal level that provide benefits to low-income households. Although anti-poverty programs are generally funded by the federal government, most are administered by states. State governments have broad discretion over the generosity of programs, so the level of benefits for any given household varies widely across regions. For example, the cut off for a single-parent household with three children to be eligible for Medicaid ranges from an annual income of $50,868 in Washington D.C. to $2,652 in Alabama. Similarly, the maximum weekly benefit for unemployment insurance ranges from $674 in Massachusetts to $235 in Mississippi.
One technique for comparing safety nets across states is to use eligibility rules to determine the benefits a hypothetical low-income household is likely to receive. However, as the number of states and programs under consideration grows, this calculation becomes more difficult because eligibility rules can be extremely complicated. For example, a full description of eligibility for the Temporary Assistance for Needy Families (TANF) program, sometimes referred to as welfare, requires a 250 page document that needs to be updated every year. Instead, I compare safety net programs using data on expenditures from the national accounts, and household income data from the Census Bureau’s American Community Survey (ACS). I find that real benefits for low-income households in the most generous area, Vermont, are about two-and-a-half times greater than in the least generous area, Georgia.
Safety-net programs come in many different forms. Some programs (such as TANF) provide cash benefits which allow households to consume anything they choose, while others (such as Medicaid) provide in-kind benefits which only permit households to consume specific goods or services. Short-term programs (such as unemployment insurance) provide temporary aid, while others (such as disability insurance) are designed to provide more long-term support. Safety nets are meant to guarantee a minimum level of consumption and insure households against the risk of a large drop in market income.
My method for measuring the generosity of safety net programs is to add up the total amount spent on benefit transfers targeted at low-income households, and to divide it by the number of persons living in households below a given market income threshold. This approach has several strengths. First, my approach is comprehensive. The national accounts are the only data that include programs that are unique to all states and localities. Also, these data are derived from state outlays so they reflect households that actually collect benefits. Because take-up rates vary widely, some households do not receive benefits even though they are eligible. Second, my approach uses survey data for market income, which are accurate relative to survey data on transfers. Data on labor and capital income come from the ACS, which is the largest survey conducted by the federal government with over 3 million observations per year. Although using survey data on transfers would provide a clearer picture of which households receive benefits, the data are less reliable since the sample is much smaller and more likely to be affected by underreporting.
Since I am interested in the variance across states, I focus only on programs in which states have some discretion over benefits. These programs are as follows:
- Medicaid
- Children’s Health Insurance Program (CHIP)
- Earned income credits
- Unemployment insurance
- Supplemental Security Income (SSI)
- Temporary Assistance for Needy Families (TANF)
- Supplemental Nutrition Assistance Program (SNAP)
- Special Supplemental Nutrition Program for Women, Infants, and Children (WIC)
- Worker’s compensation
- Temporary disability insurance
Social Security and Medicare, the two largest transfer programs, are not included since benefit eligibility is uniform across states and not targeted to low-income households. I define low-income households as any household in the bottom quartile of the national market income distribution. Using the 2012 ACS data, that cutoff is about $14,000. (Modest changes in the low income threshold do not affect the results.)
Following Census’ methodology, I drop persons living in group quarters since the concept of a household is not well-defined in this instance. In this exercise I am primarily interested in nonelderly adults and children, so I omit elderly, childless households from the sample. The real value of a transfer payment depends on the quantity of goods and services a household can purchase within their state. Since the price level varies across regions, the outlay data and the low-income threshold are adjusted using regional price parity multipliers for each state. This correction tends to make the safety net more generous in states dominated by rural communities, such as South Dakota, and less generous in states dominated by urban centers, such as New York.
Table 1. Average real transfer
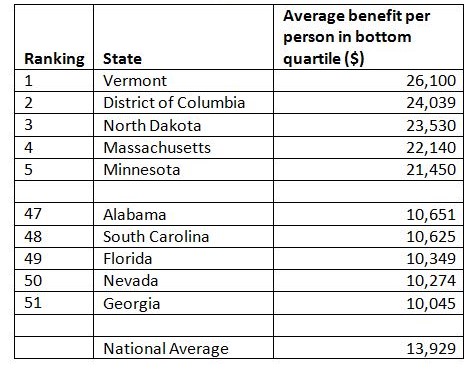
Table 1 shows the average real transfer for a low-income person in the five most generous and least generous states. Vermont ranks as the most generous state with the average low-income person receiving about $26,000 in benefits. This is due largely to the fact that, using my measure, Vermont has the most generous Medicaid program and Medicaid accounts for about half of all of the programs I consider. Vermont also has its own refundable earned income credit and SSI program. Conversely, Georgia is at the bottom of the ranking since it has some of the most restrictive laws for Medicaid and TANF.
Table 2 highlights the results for states in the Seventh District. Iowa ranks as the most generous state and Michigan as the least generous. Overall, though, the differences between states in the region are small. Medicaid accounts for much of the difference, but income support programs also play a role. All states in the region offer a refundable earned income credit ranging from 34% of the federal credit in Wisconsin to 6% in Michigan. In Iowa, unemployment insurance replaces a high percentage of previous earnings, federal SSI recipients receive additional state funding, and SNAP benefits are not subject to household asset limits.
Table 2. Average real transfer, Seventh District
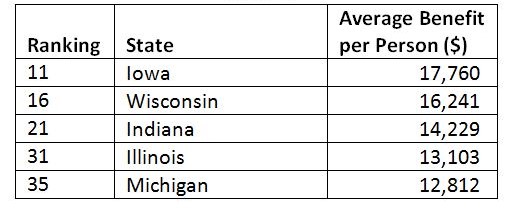
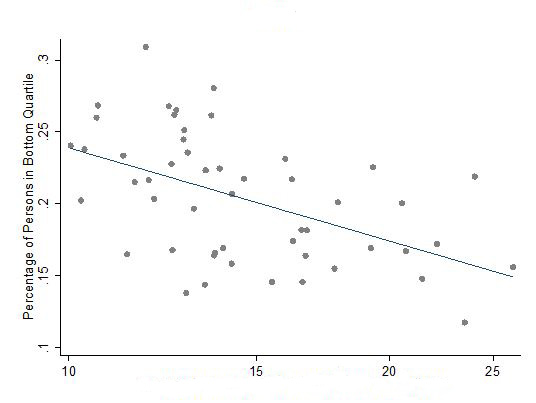
Figure 1 plots the relationship between the percentages of persons in a state defined to be “low-income” with the natural log of the average benefit. Average benefits are shown on a logarithmic scale since the marginal utility of benefits is assumed to decline as benefits increase. The blue line is the fit of an ordinary least squares (OLS) regression. The two variables are negatively correlated and statistically different from zero. That is, states with a large percentage of households earning low market income are also states that give the least generous benefits. Since the average poor person in high poverty states will tend to have less income than the average poor person in lower poverty states, we might expect a positive correlation since most programs tend to increase benefits as market income declines. Another reason we might expect a positive correlation is if more generous benefits strongly disincentivize work. Instead, these factors appear to be outweighed by the treatment of social insurance as a normal good; richer states are more willing to pay for the benefits that safety nets provide.
Figure 1. Average benefits per person (thousands of dollars)
It is important to remember that there are many other types of state and local government policies that influence the welfare of low-income households. Tax policies also vary widely across states and can have powerful redistributive effects, particularly consumption taxes, which are regressive. Additionally, direct government purchases, such as the provision of education or transportation services, are not included in this exercise. Outside of the budget process, regulations influence the prices households pay for goods and services. For example, restrictive zoning laws tend to increase housing costs. Transfer payments are only part of the story. Developing a more complete accounting of the redistributive effects of state and local policies would be a valuable area for further research.


