

The following publication has been lightly reedited for spelling, grammar, and style to provide better searchability and an improved reading experience. No substantive changes impacting the data, analysis, or conclusions have been made. A PDF of the originally published version is available here.
When the labor market is tight, wages go up. Further, higher wages are likely to boost inflation because wages are a significant fraction of production costs. As a result of these straightforward linkages, low unemployment should mean rising inflation. Conversely, high unemployment should drive down wages and dampen inflation.
Why, then, has inflation remained low and more or less steady during the 1980s? Why have wages not accelerated as the unemployment rate was nearly halved—a drop of 5 full percentage points, from 10.7% in 1982 to 5.7% in the first quarter of 1988?
Answers to these questions might also help explain the events of the 1970s, which were even more paradoxical. During that time of “stagflation,” both unemployment and inflation shot up side by side.
In both decades the nice neat inverse relation of unemployment to inflation seemed to fall apart, but apparently in different ways. This Letter argues that to understand what has happened in the past 20 years or so, we must consider not only the actual rate of unemployment, which is the number reported in the newspaper, but the “natural rate of unemployment.”
The natural rate
The natural rate of unemployment is one of those abstract economic numbers that cannot be measured, although they can be estimated, and are often treated like constants, although they can change. Other examples are “the natural rate of interest” and “potential GNP.” In the case at hand, the natural rate of unemployment is best defined in terms of inflation: It is the rate of unemployment that can be sustained with no increase or decrease in the rate of inflation. It is, thus, a kind of balance point.
Changes in the structure of the economy can move that balance point. Movements in the economy’s structural mix may shift the natural rate of unemployment up or down. For example, in the short run an economy may need more computer programmers than it has, and at the same time have more steelworkers than it can employ. In an economy that relies on specialized skills, the slackness or tightness of the labor market is not expressed by the actual rate of unemployment, but by the difference at any time between the actual and the natural rates.
The reliable ’50s and ’60s
It was noticed as far back as the 1950s that reductions in the unemployment rate usually coincided with periods of growing inflation. In figure 1 the civilian unemployment rate is plotted quarterly from the first quarter of 1948 through the second quarter of 1988. The 1950s exhibit the traditional linkage between unemployment rates and economic conditions. There were three recessions over this time period during which unemployment rose sharply, attaining a maximum of 7.4% in 1958. The unemployment rate fell as the economy improved and hovered at about 3%.
1. Stark peaks and prosperous valleys: U.S. unemployment
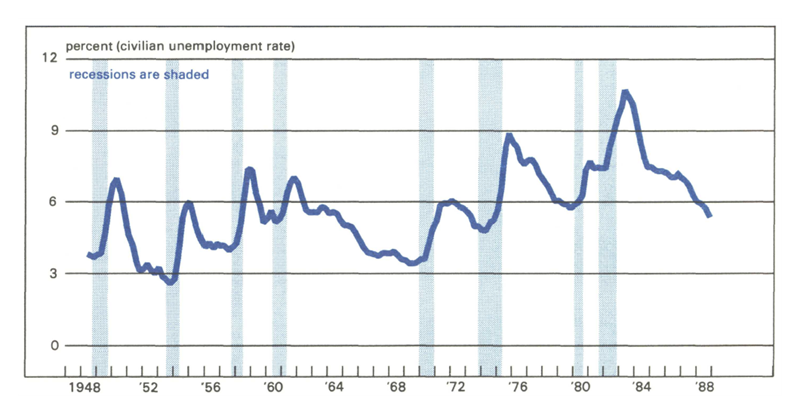
The 1960s are distinct because of the sustained economic growth enjoyed after 1961. As a result, the unemployment rate drifted downwards from a high of 7.0% at the depth of the recession early in the decade to a low in 1969 of only 3.4%. While unemployment fell, inflation rose. In 1961 the Consumer Price Index (CPI) increased by 1.1% annually. However, by 1969 inflation had risen to 5.3%.
Throughout the ’50s and ’60s, the pattern of unemployment is well explained by frictional unemployment and the business cycle. Frictional unemployment occurs as a result of the normal dynamic functioning of the labor market where thousands of individuals enter the labor force, leave their jobs, and lose their jobs in the usual course of events. In addition, cyclical unemployment is the result of lower aggregate demand and unresponsive real wages. In light of the historical experience at that time, it is easy to understand why the natural rate of unemployment—the balance point for inflation—was believed to be around 3%.
Then, in the ’70s and early ’80s this pattern changed. Over this time the unemployment rate rose from a low of 4.2% in 1970 to a high of 10.7% in 1982. As in previous years, the unemployment rate responded to cyclical factors but now failed to return to its normal lower levels during expansions. Simultaneously, the inflation rate began to rise. At the beginning of the decade prices were rising at a rate of about 5.7%. By 1977 inflation was at a staggering 10.7% and rising, despite historically high unemployment rates. This combination of high unemployment and high inflation led to the conclusion that the natural rate of unemployment had risen.1
Since 1982 the economy appears to have entered yet another distinct phase. Both the unemployment and inflation rates have fallen steadily. Unemployment declined to a level of 5.7% in the first quarter of the year while prices, as measured by the CPI, are growing at a low 3.4% annually. The simultaneous decline in inflation and unemployment suggests that the natural rate of unemployment has fallen.
Factors affecting the natural rate
Because of the high unemployment and inflation rates observed in the ’70s and early ’80s, some economists concluded that the short-term trade-off between inflation and unemployment had worsened. This would mean that a given reduction in inflation required a greater increase in unemployment than before. Others argued that the relation between inflation and unemployment that existed in earlier years had shifted adversely because the natural rate of unemployment had risen.
Many reasons have been offered to explain why the natural rate rose. For example, during the 1970s the proportion of the labor force comprised of youths and women rose from 42.8% in 1970 to 47.2% in 1979. These groups have traditionally experienced higher unemployment rates relative to adult males. The influx of these workers into the labor market caused the unemployment rate to rise independently of the total level of labor demand in the economy.
Changes in the institutional environment may also have adversely affected the natural unemployment rate. The greater availability of unemployment insurance combined with more generous benefits made unemployment a more attractive alternative to employment in some instances. In addition, higher minimum wages effectively reduced the demand for labor, thereby increasing the jobless rate.
Union bargaining practices are also thought to have altered the relationship between current inflation and current unemployment rates. During the ’70s as inflation rose, unions more frequently relied upon cost-of-living escalator clauses to index wages to price movements. As a result, wages reacted more quickly to price pressures. Because union labor contracts are typically multiyear agreements, the responsiveness of wages to current unemployment rates is reduced.
In the ’80s many of these factors have been reversed. Women are gaining in labor market experience and the working population is aging. The real minimum wage has been eroded by inflation, and unions have been substantially weakened. As a result of these conditions, the natural rate of unemployment has fallen.
Unemployment and structural change
Although other factors are at work, shifts in the composition of the economy’s output appear to be the most important element in explaining changes in the natural rate of unemployment. In a stable economic environment unemployment arises because of technical and institutional constraints. Although there may be jobs available, it takes time and resources to locate them. In the interim the worker endures a spell of unemployment.
The problem of finding appropriate employment is magnified when the economy is undergoing fundamental structural changes. For most of the post-World War II period, the private economy has been shifting from a base of manufacturing to one of service.
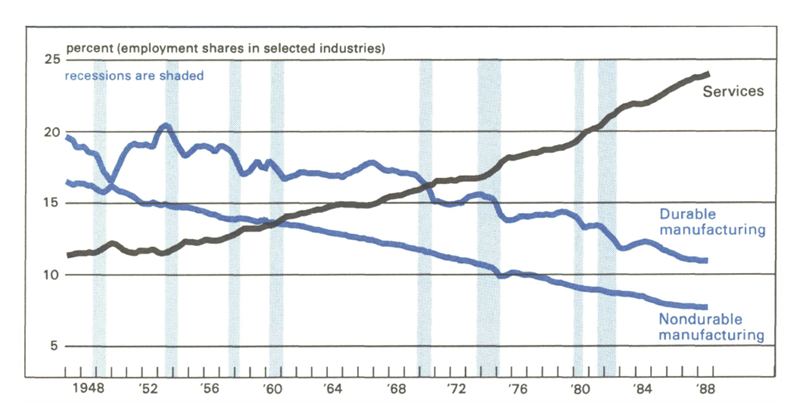
Figure 2 shows employment shares in Durable and Nondurable Manufacturing and Services from 1947 to date. The decline in the proportion of employment in Nondurables has proceeded remarkably smoothly, showing little effect of the business cycle. On the other hand, recessions are clearly and consistently associated with reductions in Durables’ employment share from which the industry never fully recovered. In later years Durables Manufacturing’s sensitivity to recessions appears to have increased and recovery takes a longer time.
2. Smooth and bumpy: manufacturing employment goes downhill
As the composition of labor demand shifts, workers lose their jobs. How quickly they find replacements depends upon the skills that the unemployed possess and those that employers require. Figure 3 shows an “index of dispersion” in employment growth that measures the intensity of compositional changes in employment. If all industries were growing at the same rate, their employment shares would be unchanged and the index would have a value of zero. The greater the change in composition, the larger is the index value.
3. Moving around: sectoral shifts in employment
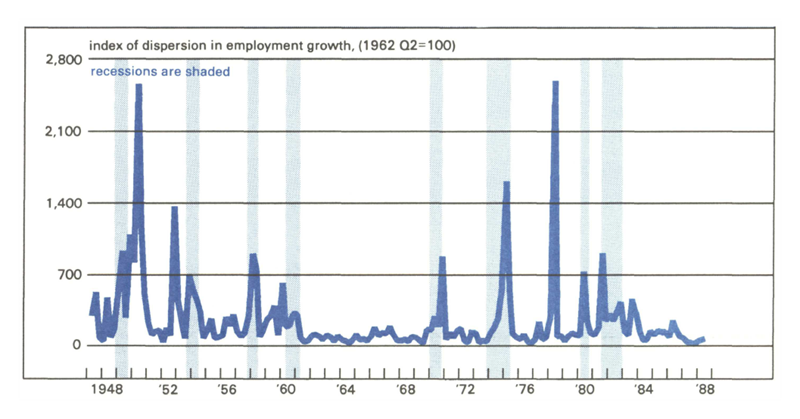
The index shows that a great deal of such interindustry variation in employment occurred in earlier years. Further analysis reveals that much of this was only temporary. However, the 1970s and early ’80s exhibit quite marked and lasting changes in the distribution of employment, while the remainder of the ’80s have been far less volatile. The transition to services is still occurring, but at a slower and more even pace.
Because of the pronounced structural changes that occurred during the 1970s, there was a temporary mismatch in skills. Structural unemployment was the result. The unemployment rate rose during the 1970s and early 1980s independently of movements in the general level of demand for labor.2
In contrast, the remainder of the ’80s experienced a more balanced distribution of employment growth. As a result, structural unemployment was a smaller component of total unemployment than in previous years. The actual unemployment rate more closely reflected the true level of labor market activity as the natural rate of unemployment also declined.
Conclusions
The natural rate of unemployment varies as the underlying structure of our economy changes. When the environment is stable, the actual unemployment rate is a reliable measure of the degree of labor market tightness. However, when the economy is undergoing structural stress, that rate is no longer an accurate gauge of labor market activity. The degree of labor tightness is best measured as the difference between the actual and natural rates of unemployment.
This offers a partial explanation for the rising unemployment and inflation of the ’70s and falling unemployment and low inflation of the ’80s. During the previous decade, unemployment rates reached unprecedented high levels, leading most to believe that labor markets were slack. In fact, the opposite was the case. The structural upheaval of the ’70s caused both the natural and actual rates of unemployment to rise and the gap between them to narrow. High unemployment and inflation were the results.
The reversal of this process has been occurring for much of the ’80s. While the trend to services is still continuing, it is occurring at a more even pace. The actual unemployment rate has fallen markedly, but this does not necessarily imply that labor markets are becoming tighter and inflation is on the horizon. The same factors that have led to a decline in unemployment have also led to a fall in the natural rate.
The natural rate of unemployment cannot be observed directly but must instead be estimated. This estimation is made more difficult because the natural rate changes over time. For these reasons economists, myself included, are hesitant to proclaim any particular level of unemployment the natural rate. Nevertheless, it is an important number to know because it tells us whether the labor market is tight or slack when viewed in relation to the actual unemployment rate.
My best estimate of the current natural rate places it at about 5%. With a civilian unemployment rate of 5.4% in the second quarter of the year, the economy is approaching the point where inflationary pressures could be roused.
MMI—Midwest Manufacturing Index
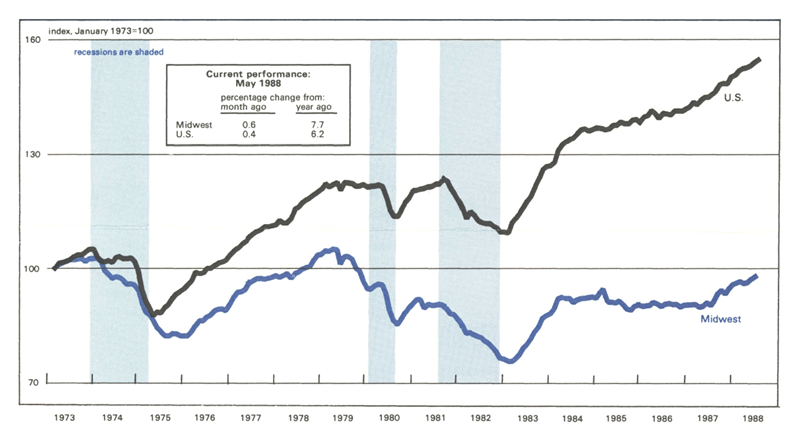
Manufacturing activity in the nation, as measured by the Federal Reserve Board’s Index of Industrial Production for manufacturing industries, continued its strong advance in May, after slowing down earlier in the year. Transportation equipment, particularly autos and light trucks, and machinery-related industries continue to account for much of the gain.
The MMI outpaced the nation in May but followed the national pattern across industries. Transportation equipment and nonelectrical machinery were the strongest performing industries, while food processing and chemicals were among the weakest in May. Nondurable-goods industries have been doing relatively well in the Midwest, but their decline in May reflected sluggishness nationwide.
Notes
1 See Robert J. Gordon’s “Can the Inflation of the 1970s Be Explained?” in Brookings Papers on Economic Activity, vol. 8, no. 1 (1977), pp. 253-278.
2 See David Lilien’s, “Sectoral Shifts and Sectoral Unemployment,” in the Journal of Political Economy, vol. 90, no. 4 (August 1982), pp. 777-793.


