

The following publication has been lightly reedited for spelling, grammar, and style to provide better searchability and an improved reading experience. No substantive changes impacting the data, analysis, or conclusions have been made. A PDF of the originally published version is available here.
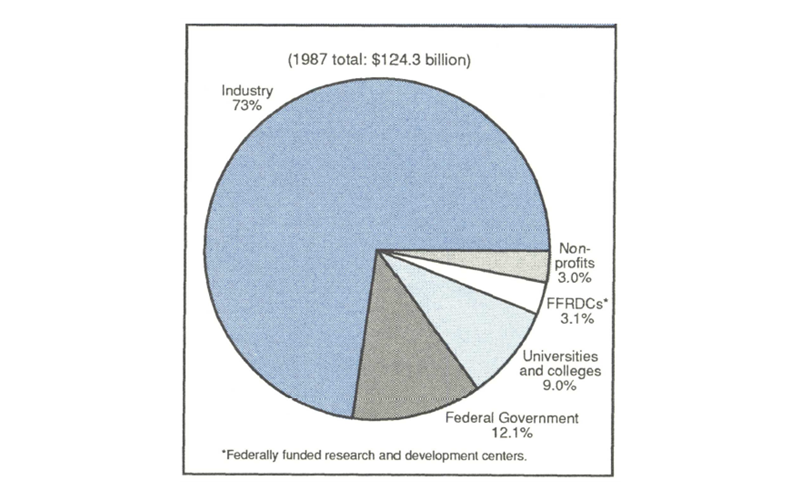
In 1987, industry performed almost three-fourths of the research and development (R&D) in the United States (see figure 1). This share has not changed appreciably over the last 25 years. What has changed is the funding of industrial R&D. In the early 1960s, the federal government paid for more than 50% of industrial R&D. That share fell to 31% by 1980, before rising to 35% during the defense buildup of the 1980s.
Figure 1. Who does R&D
With the remarkable, and seemingly irreversible, political changes taking place in the former communist bloc states of Europe, many expect reductions in U.S. defense outlays—the so-called “peace dividend.” Such reductions will almost certainly adversely affect the federal funding of industrial R&D.
Out of step in the Midwest
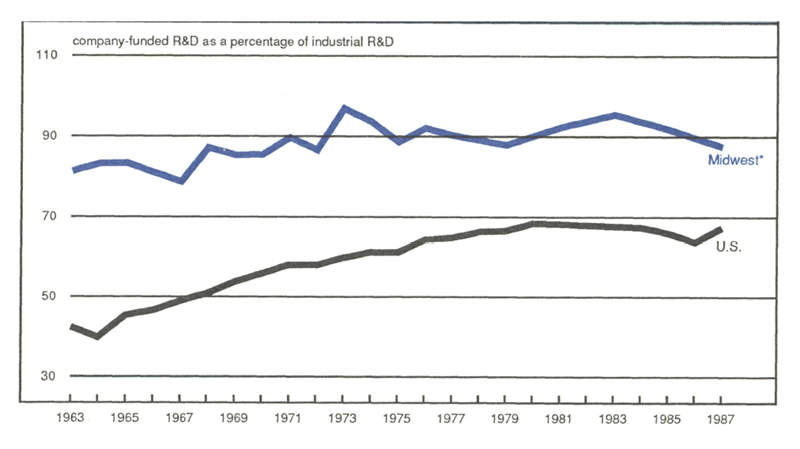
Throughout the last quarter-century, the Midwest has never been quite in synch with the rest of the country in R&D. For example, Midwest industry has paid for much more of its R&D from internal funds. Over the 25-year period, Midwest industry has self-funded from 80% to more than 90% of its R&D (see figure 2). This regional self-funding of industrial research and development may well help it weather downturns in defense spending on R&D.
Figure 2. The Midwest tends to pay its own way
While Midwest R&D spending per dollar of manufacturing output began well behind the nation in 1963, it has steadily crept closer to the national level. In the early 1960s, Midwest industry spent only $6 on R&D for every $100 of output, compared to $10 per $100 of output for the nation as a whole. That gap has been closing—today the figure is $7 per $100 output in the Midwest, against $9 per $100 nationally.
Thus, at the same time that the region has been losing ground to the nation in share of manufacturing production, this sector has become more R&D intensive in expenditures. This is a significant and previously unnoticed trend in the region’s R&D orientation. This Fed Letter asks whether this trend reflects a revitalization effort by Midwest industry. Are the region’s factories attempting to enhance their market competitiveness by investing in R&D?
Technology and regional economies
Growth of R&D in the industrial sector can be an important indicator of a region’s economic vitality. Investment in R&D often leads to the development of new products, jobs, and even entire industries. So, too, R&D improves the productivity of industrial processes, lowers unit costs, improves product quality, and raises the competitive position of a region’s industry in global markets.
The manufacturing sector performs almost all industrial R&D (94%) with only a small remainder performed by the service sector. In turn, five so-called high-technology industrial sectors account for over three-fourths of manufacturing R&D. These sectors include chemicals and allied products, machinery (including computers), electrical equipment, aircraft and missiles, and professional/scientific instruments.
To a lesser extent, the industrial sector encourages R&D performed by other sectors, sponsoring 11% of the R&D performed by nonprofit institutions and 6% of the R&D at colleges and universities.
Industrial R&D in the Midwest
Today, the Midwest is a major center for R&D activity. Its share of the nation’s R&D activity slightly exceeds its overall economic size. Yet, as noted above, industrial R&D expenditures per dollar of manufacturing output remain less than the nation’s. Therefore, the large overall size of R&D activity in the Midwest arises not from an intense R&D orientation of the Midwest manufacturing sector but rather from the large relative size of its manufacturing sector which, as a share of regional output, exceeded the nation’s by 38% in 1986.
In the broadest terms, Midwest manufacturing does not tend to be of the high-technology variety. Led by facilities in Michigan, the automotive industry remains, by far, the leading R&D industry in the region. In the remaining states, high-tech notables are more heavily represented, including chemicals, electrical equipment, and machinery (see table). Even here, Midwest-specific machinery industries such as construction and farm equipment tend to be less R&D intensive than, say, computers.
Table 1. Largest R&D-performing industrial sectors: 1987 (dominant industries)
| R&D rank | Illinois | Indiana | Iowa | Michigan | Ohio | Wisconsin | U.S. |
|---|---|---|---|---|---|---|---|
| 1 | electrical equipment (communications) | motor vehicles | machinery (industrial) | motor vehicles | aircraft & missiles | machinery (industrial) | aircraft & missiles |
| 2 | aircraft & missiles | chemicals (drugs) | aircraft & missiles | chemicals (drugs) | chemicals | motor vehicles | electrical equipment |
| 3 | non-mfg. | non-mfg. | electrical equipment | aircraft & missiles | rubber products | fabricated metals | machinery (computers) |
The region has cultivated several bona fide high-tech industry concentrations, such as the large telecommunications industry in Illinois and the drugs/pharmaceuticals industry in Illinois, Michigan, and Indiana. However, on average, the “basic” industry mix and the relative lack of high-tech, defense-oriented industries such as aircraft and aerospace have resulted in a moderately lower R&D orientation for the Midwest manufacturing sector.
But, while the region’s manufacturing production remains less “high-tech” than the nation, the gap has narrowed substantially. These gains have not occurred because high-tech industries have moved into the Midwest, displacing older, low-tech ones. Rather, on an industry-by-industry basis, R&D spending per unit of output has been on the rise. Midwestern industries, including machinery and autos, have been heavily investing in research and development.
Behind the changes
One explanation for the region’s rising technological intensity can be seen by recognizing that industrial R&D and its consequent production are not necessarily located together. An auto may be designed in Michigan but built at a factory in Georgia. Semiconductor or computer R&D may take place in New York or California, but the product may be manufactured in Singapore or Taiwan. With respect to the Midwest, this means that the higher R&D intensity of Midwest manufacturing in the 1980s may be the vestige of a now-defunct set of factory production activities rather than evidence of an impending blue-collar revival or a new Silicon Valley.
Regional theorists have long recognized and documented the flight of factories from the industrial heartland. During the 1960s and 1970s, many factories fled the Midwest, mainly to the American South, in search of lower production costs and less militant labor. Indeed, factory flight was facilitated by large government investments in roads and bridges, chiefly the interstate highway system, which allowed cheap transportation and distribution from dispersed factory locales. To some extent, midwestern corporate and division headquarters and R&D facilities remained behind rather than following their factories to distant locales.1 While this geographic severing of production activity from production control continued into the 1980s, a second impetus—the high and rising dollar—shifted the migration somewhat toward overseas production facilities.
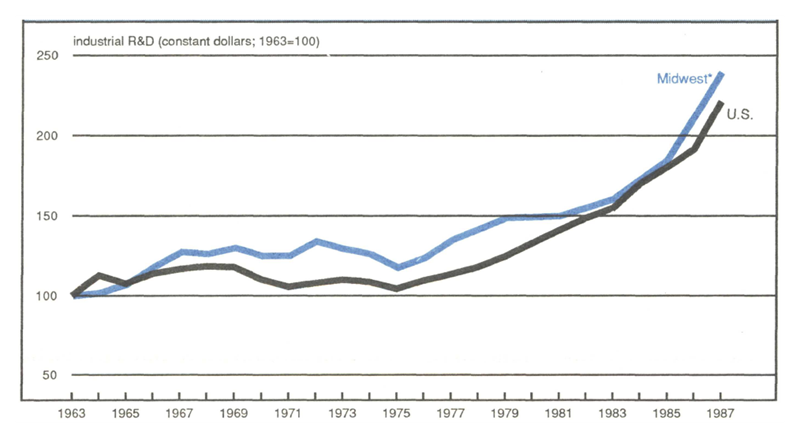
This process of factory decentralization from the industrial heartland is real enough. Overall, the Midwest has deindustrialized, as evidenced by its falling share of U.S. manufacturing output. At the same time, however, real gains in R&D expenditures have been realized. The region’s share of industrial R&D has held steady since 1963 as Midwest R&D spending has grown apace with, or slightly faster than, the nation (see figure 3). The character of the region remains strongly rooted in manufacturing. But within that sector and within many of its traditional industries, spending to develop new products and processes has become a more commonplace activity than the routinized factory production that formerly typified the region.
Figure 3. R&D is growing faster in the Midwest
Federal funds, company funds
In recent years, Midwest leaders have bemoaned the anemic distribution of federal spending in the Midwest in relation to taxes originating here. Yet, the Midwest surge in industrial R&D has occurred in spite of and, indeed, because of the region’s historically low ability to draw on federal funds for R&D. Over the 1963-87 period, Midwest growth lagged behind the nation in both components of industrial R&D—that derived from federal funds and that from companies’ own funds. However, because the region’s industries heavily tend to fund their own R&D, the region’s total R&D kept pace with and slightly exceeded the nation. Over the past 25 years, federal funding of industrial R&D has greatly lagged the growth of company-funded R&D. The Midwest’s concentration in company-funded R&D was large enough for this effect to raise overall R&D spending growth in the Midwest above the national rate.
Toward the future
No one knows whether the robust R&D spending by Midwest industries will continue or, indeed, whether recent investments will even payoff in terms of renewed competitiveness and economic vigor. However, it is encouraging that, in this important category of regional investment, Midwest industry continues to fight against its industrial slippage.
The sizable absolute gains in R&D spending suggest some revival of the region’s fortunes as its character is transformed into a center of industrial research and development activity. A further hope is that the R&D spending of today will eventually lead to a bolstering of factory production and jobs here, and a healthier income growth for semi-skilled workers.
Meanwhile, despite the surge in federal R&D funding for military defense systems during the 1980s, the region’s lesser ability to attract federal government funds has actually contributed, at least indirectly, to strong R&D reinvestment over the past 25 years. Certainly, the emerging potential for demilitarization and the so-called “peace dividend” in the U.S. can only boost R&D reinvestment in basic and new nonmilitary industries.
Greater federal funding of nonmilitary industrial research may now become available. As one possibility, displaced defense-oriented personnel could work toward transferring the existing technology from defense programs to civilian purposes Such a program could both ease worker displacement and lend an immediate boost to basic industry.
In a less direct and longer-term fashion, freeing the nation’s scientists and engineers to be hired by nondefense industries may also help to revive basic industries upon which the Midwest economy is built. As the swords are sheathed, these skilled workers may come to live where plowshares are made.
MMI—Midwest Manufacturing Index
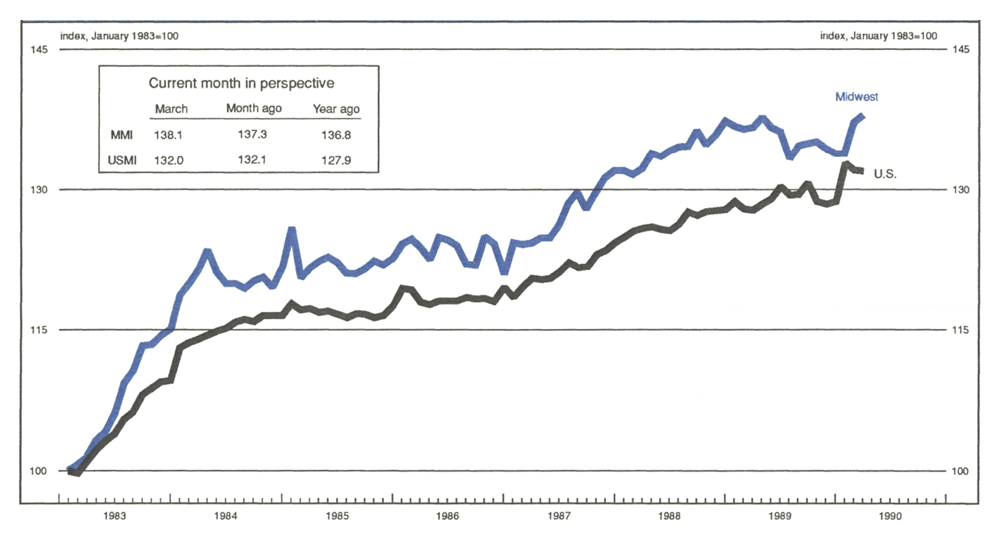
The MMI in March rose 0.6%, following a strong February gain of 2.5%. The transportation sector (i.e., the auto industry) accounted for much of this expected rebound in Midwest manufacturing, rising 11% in February and 5% in March. Plants that had been temporarily closed to reduce car inventories began reopening.
Most other sectors of manufacturing also improved. Metalworking was up 1.3% in March, as steel shipments to the auto industry increased. The chemical sector gained 0.7% and has been gaining steadily over the last several months. Machinery has been the only sector that has failed to improve since the beginning of the year.
Notes
1 For a further discussion of this issue, see Alenka S. Giese and William A. Testa, “Can Industrial R&D Survive the Decline of Production Activity: A Case Study of the Chicago Area,” Economic Development Quarterly, Vol. 2, No. 4, November 1988, pp. 326-338.


