

The following publication has been lightly reedited for spelling, grammar, and style to provide better searchability and an improved reading experience. No substantive changes impacting the data, analysis, or conclusions have been made. A PDF of the originally published version is available here.
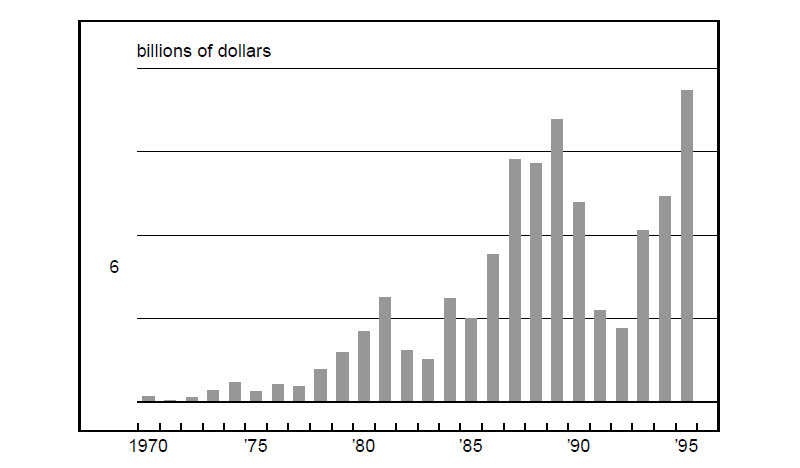
The globalization of the world’s economies over the last two decades has, in many ways, tied the U.S. economy to events and actions that take place throughout the world. One measure of globalization is foreign investment, both at home and abroad. Foreign investment is a two-way flow—persons and entities invest in a foreign country and, in turn, that country’s citizens and corporations invest abroad. Foreign direct investment (FDI) refers to business ownership as opposed to limited portfolio investment. Historical data on FDI in the United States (FDIUS) show that FDI annual capital flows have grown considerably since 1980 (see figure 1).
1. Annual FDI capital inflows
To be classified as FDI, a foreign person or entity must have a 10% or greater share of ownership in a U.S. firm. U.S. firms that have FDI are considered U.S. affiliates. FDI may take the form of newly established businesses or acquisition of existing businesses. Since 1979, nearly 80% of new investment outlays have been acquisitions.
This Fed Letter will examine recent industry and foreign ownership trends in foreign direct investment over the 1977–93 period for both the U.S. and the Midwest.1
How extensive is foreign direct investment in the U.S. and how is it measured?
Several measures examine the size of FDI in the U.S. The accumulated stock of FDI presents an overall measure of the level of FDI in the U.S. economy. Another measure is the annual flow of FDI collected by the U.S. Bureau of Economic Analysis (BEA). Annual flow data provide several useful pieces of information, such as the attractiveness of the U.S. vis-à-vis other countries and the economic state of foreign countries and their ability to invest abroad. In some cases, trends in FDI provide a first look at future trends in a foreign country’s industrial policy. An example of this occurred in the 1980s, when Japanese auto manufacturers set up operations in the U.S. in response to U.S. trade policy that had placed voluntary export restraints (VER) on Japanese auto exports to the U.S.
In 1977, the stock level (or position) of FDI in the U.S. stood at $35 billion (historical cost), with the Netherlands, the United Kingdom, and Canada having the largest shares. By 1994, the stock of FDI in the U.S. stood at $504 billion (historical cost), with the United Kingdom, Japan, and the Netherlands having the largest shares. Most major countries’ share of FDIUS changed substantially over this period. For example, Canada’s share of FDIUS fell from nearly 18% in 1977 to 9% in 1994; the Netherlands’ share fell from 21% to 14%; and Japan’s share grew from 5% to 20%. The United Kingdom remains the largest shareholder with 23% of total FDIUS (up from 21% in 1977).
While the stock level of FDI has grown substantially over the last few decades, several measures of FDI’s impact or presence in the overall U.S. economy show U.S. affiliates do not represent a substantial share of U.S. businesses. Employment at U.S. affiliates in 1993 represented only 5% of total nonbank private employment. However, this share varied considerably by industry. For example, employment by U.S. affiliates represented nearly 33% of total chemicals and allied products employment and nearly 21% of stone, clay, and glass products employment. Conversely, many nonmanufacturing industries had much lower shares—1.3% and 1.6% for construction and agriculture, respectively. In terms of gross product, U.S. affiliates’ shares accounted for only 6.1% of total gross product in 1993. However, their share had risen steadily from just over 2% in 1977.2
Another measure, however, presents a different view of the impact of FDIUS on the U.S. economy. In 1993, 23% of total U.S. merchandise exports and 34% of imports could be attributed to U.S. affiliates. These numbers have held steady over time. While this group has a disproportionate share of U.S. exports and imports, it can be explained by the fact that the group includes wholesalers and, in particular, motor vehicle and equipment wholesalers. In 1993, 53% of exports shipped by U.S. affiliates and 59% of imports shipped to U.S. affiliates were in wholesale trade industries.3 In addition, much of this trade is intrafirm trade, that is, trade with the affiliates’ foreign parent or parent group. In 1993, 45% of U.S. affiliates’ exports were shipped to foreign parent groups, and 75% of imports were shipped from foreign parent groups.4
In late 1993, the BEA published a study on the merchandise trade of U.S. affiliates over the 1977–91 period.5 According to this report, in most years, the affiliates’ trade deficit (caused by more imports than exports) accounted for more than one-half of the total U.S. merchandise trade deficit. As mentioned above, this large trade deficit can be attributed principally to wholesalers acting as distribution channels for their parent companies.
In terms of ultimate beneficial owner (UBO), in 1991 Japanese-owned affiliates accounted for the largest share of both imports and exports of U.S. affiliates, mainly in wholesale trade.6 France, the United Kingdom, and Germany were the next largest affiliate exporters and Germany, the United Kingdom, and Canada were the next largest affiliate importers in 1991.
While the level of FDI continues to grow, the annual flows of FDIUS (as shown in figure 1) vary from year to year. Over the 1970–95 period, annual capital inflows have ranged from a low of $0.4 billion in 1972 to a high of $75 billion in 1995. There are several reasons for this. For one, macroeconomic conditions both here and abroad affect investment decisions. When the U.S. economy is doing well, the U.S. is a more attractive place to invest. Even so, if foreign countries are having internal problems, they may have to slow or contract their overseas investment. Exchange rates also affect the flow of investment. For example, when the dollar is strong (against other countries’ currencies), investment in the U.S. is more costly. The opposite is true when the dollar is weak. Other factors that affect annual FDI flows include regulation/deregulation of capital markets, investment and/or trade policies, and the growth of emerging markets.
FDI in the Midwest
The impact of FDI on regional economies is more difficult to measure because state-level data on FDIUS are limited to number of affiliates, employment at U.S. affiliates, and some data on industry and country of origin. Measures such as stock level and annual flows are not available at the state level.
Over the 1977–93 period, employment at U.S. affiliates in the Midwest grew by nearly 429,000 employees, accounting for 12% of affiliate employment growth in the U.S. Illinois had the largest absolute increase in employment among Midwest states with 162,000 employees, ranking sixth in the nation. (California, Texas, and New Jersey had the largest absolute employment increases in the nation over the period.) Of the Midwest states, only Indiana’s total affiliate employment growth outpaced the nation’s, with a 303% increase (see figure 2).
2. Employment at U.S. affiliates
| 1977 | 1993a | Percent change | |
|---|---|---|---|
| (thousands) | (thousands) | ||
| Illinois | 73.8 | 235.8 | 219.3 |
| Indiana | 30.4 | 122.6 | 303.4 |
| Iowa | 9.3 | 30.9 | 230.6 |
| Michigan | 41.1 | 148.6 | 261.2 |
| Wisconsin | 30.6 | 76.3 | 149.5 |
| Midwest | 185.3 | 614.2 | 231.5 |
| Total U.S. | 1,218.7 | 4,722.3 | 287.5 |
Nearly half of the Midwest’s affiliate employment increase (207,000) occurred over the 1987–93 period. FDI employment in Midwest manufacturing firms accounted for about 72% of this growth and was growing at a rate (76%) that was significantly higher than the rest of the nation (54%).
In 1991 (latest year of manufacturing industry data available), Midwest manufacturing affiliates accounted for nearly 17% of all affiliate manufacturing jobs. In the primary and fabricated metals industries, nearly one out of every four affiliate manufacturing jobs in the U.S. were in the Midwest. Over the 1987–91 period, Midwest employment growth in the metals industries exceeded that of the nation (70% versus 56%). In the food and food products industry and the machinery sector, Midwest affiliates accounted for nearly one out of every five affiliate manufacturing jobs. Employment growth in these two industries also outperformed the nation over the 1987–91 period. Food and food products employment increased 88%, compared to 68% for the nation. In the machinery industries, Midwest employment increased 84%, compared to 51% for the nation.
The composition of affiliate employment by country of origin of the largest investor, or UBO, changed for both the U.S. and Midwest over the 1977–93 period. In 1977, Canada held the largest share of affiliate employment in the Midwest with a 23% share, followed by the United Kingdom and the Netherlands. The same three countries held the largest shares of affiliate employment in the U.S., but the United Kingdom held the largest share. By 1993, Japan and the United Kingdom were tied for top rank in the Midwest, each having a 19% share (see figure 3). Germany held the next largest share with 14%, and Canada’s share had fallen to just under 14%. The United Kingdom remained the largest country of origin for the entire U.S. in 1993, but its share fell from 24% to 21%; Japanese-owned affiliates increased their share of employment from 6% to 15%. The latter group showed the largest growth in employment in the Midwest among countries with U.S. affiliates in both absolute terms (adding 107,000 employees) and percentage terms (more than 11 times its 1977 level).
3. Employment by country of UBO, 1993
| Japan | UK | Germany | Canada | |
|---|---|---|---|---|
| (percent) | (percent) | (percent) | (percent) | |
| Illinois | 19.1 | 20.9 | 11.3 | 11.6 |
| Indiana | 27.7 | 15.7 | 11.9 | 12.2 |
| Iowa | 20.7 | 18.1 | 19.3 | 14.1 |
| Michigan | 5.4 | 18.5 | 19.3 | 18.5 |
| Wisconsin | 10.4 | 22.3 | 11.7 | 20.4 |
| District | 19.0 | 19.0 | 14.4 | 13.6 |
| U.S. | 15.3 | 20.7 | 12.0 | 14.0 |
The number of affiliates in the U.S. rose to 8,179 in 1992, up from 2,999 in 1977. The states with the largest increase in number of affiliates over this period were California, New York, and Texas.7 Illinois ranked fifth, with an increase of 957 affiliates. The five Midwest states combined realized an increase of 2,724 affiliates.
Conclusion
While foreign investors continue to invest in the U.S. via U.S. businesses, their overall presence remains small, with two exceptions—total employment in certain industries and level of merchandise trade. Certain industries, such as chemicals and allied products, have a large share of their total employment in firms with FDI. In addition, U.S. affiliates account for a disproportionate share of both merchandise imports and exports. However, at least with imports, a significant part of this trade is by motor vehicle and equipment wholesalers, which conduct a large share of their business with a foreign parent.
Is there cause for concern? As mentioned above, certain U.S. industries have a more notable foreign presence than others, but they have had for quite some time. Much of this can be accounted for by large multinational firms. On the other hand, industries that have traditionally been U.S.-owned are facing stiff competition from “new” competitors, such as Japan, that have seized opportunities to enter the U.S. market. In the face of this competition, there has been increased public concern over the growing levels of FDI in the U.S., with particular emphasis on the degree of control one country’s, or group of countries’, citizens may gain on the U.S. economy through their investment in U.S. businesses. However, this concern must be weighed against FDI’s potential benefits—the introduction of new technologies, new job creation, or keeping a U.S. business open that may have otherwise closed. To some, FDI indicates a preference by investors for the business climate or natural advantage of a state, region, or nation.
Tracking Midwest manufacturing activity
Manufacturing output indexes (1987=100)
| February | Month ago | Year ago | |
| MMI | 145.9 | 144.3 | 142.5 |
| IP | 126.1 | 124.3 | 123.9 |
Motor vehicle production (millions, seasonally adj. annual rate)
| March | Month ago | Year ago | |
| Cars | 4.7 | 6.1 | 6.9 |
| Light trucks | 5.0 | 5.6 | 5.7 |
Purchasing managers’ surveys: net % reporting production growth
| March | Month ago | Year ago | |
| MW | 49.8 | 55.3 | 57.2 |
| U.S. | 46.2 | 44.3 | 53.7 |
Manufacturing output indexes, 1987=100
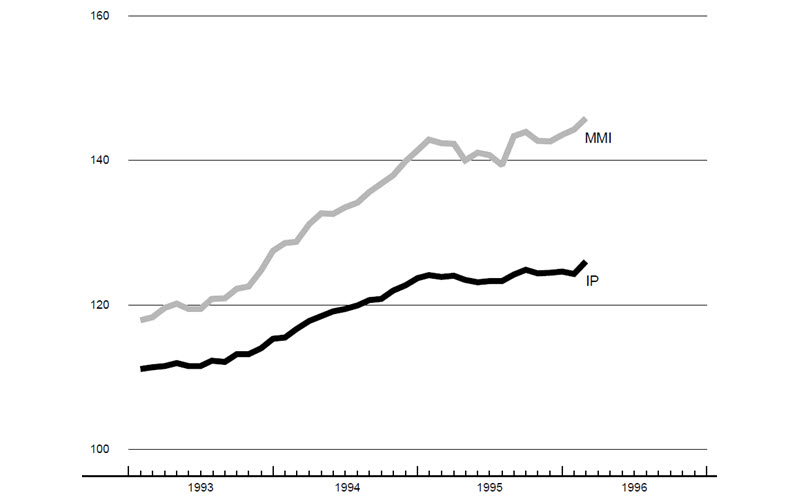
Sources: The Midwest Manufacturing Index (MMI) is a composite index of 15 industries, based on monthly hours worked and kilowatt hours. IP represents the Federal Reserve Board industrial production index for the U.S. manufacturing sector. Autos and light trucks are measured in annualized units, using seasonal adjustments developed by the Board. The purchasing managers’ survey data for the Midwest are weighted averages of the seasonally adjusted production components from the Chicago, Detroit, and Milwaukee Purchasing Managers’ Association surveys, with assistance from Bishop Associates, Comerica, and the University of Wisconsin–Milwaukee.
The Midwest Manufacturing Index rose slightly less than the industrial production index for the nation in February but was revised slightly upward in January to show a modest gain, versus a 0.3% decline nationwide. The region should get a boost over the next few months from GM’s efforts to recapture some of its strike-related production losses.
Midwest manufacturing activity may have plateaued in March, but the underlying trend in the region continues to be positive. The composite index of production from the region’s purchasing managers’ surveys dropped to 49.8%, which corresponds to virtually no change in production. The Detroit survey accounted for the bulk of the decline, which may reflect the GM strike.
Notes
1 For the purposes of this article, the Midwest is defined as the Seventh Federal Reserve District, which encompasses Iowa and major portions of Illinois, Indiana, Michigan, and Wisconsin.
2 Gross product is an economic accounting measure of production.
3 Mahnaz Fahim-Nadir and William J. Zeile, “Foreign direct investment in the United States,” Survey of Current Business, May 1995, pp. 57–81.
4 Ibid.
5 William J. Zeile, “Merchandise trade of U.S. affiliates of foreign companies,” Survey of Current Business, October 1993, pp. 52–65.
6 The BEA defines a UBO as “that person, proceeding up the affiliate’s ownership chain, beginning with and including the foreign parent, that is not owned more than 50% by another person.” Person in this definition can be an individual or group of persons. The foreign parent is the first person outside the U.S. that has a direct investment (more than 10% ownership).
7 State totals do not add to total U.S. State totals include every plant of a U.S. affiliate within that state, whereas total U.S. includes only total number of affiliates.


