

During the summer of 1997 the fabric of the Asian economic miracle began to unravel. The outlook for continued high rates of real gross domestic product (GDP) growth, which had averaged 7% to 10% for many countries in the region during the previous decade, turned abruptly less favorable. National currencies, most of which had been pegged to the U.S. dollar (or a basket of currencies heavily weighted toward the dollar), depreciated sharply. Financial markets and banking systems became severely stressed. Several of the Asian “tigers” of a few years ago were forced to appeal to the international community for financial assistance in order to meet short-term international debt obligations.
The impact of the recent developments in Asia will be felt in the U.S. Midwest. Asia is important to this region’s economy, as a market for locally produced goods and services, as a source for imported goods and services, and as a competitor in foreign and domestic markets. This Chicago Fed Letter reviews several key developments in the recent Asian situation and how these developments might influence Midwest trade.
Asian growth—a model for the world?
By U.S. standards, most east and southeast Asian economies have recorded comparatively high levels of economic growth since the early 1960s, supported by high rates of investment growth, especially in export-oriented industries. Facilitating much of this investment were close ties between Asian lending institutions and the domestic firms to which they lend. Government-led industrial policies were directed toward stimulating economic expansion and promoted investment in “targeted” industries. Governments sanctioned, even encouraged, close relationships between the financial and industrial sectors, which sometimes led to investment and lending decisions that did not meet the rigors of market discipline. This tendency, in part, underlies what has happened in Asian markets during recent months.
While many date the current economic turmoil in Asia to the speculative attacks on Thailand’s currency (the baht) in foreign exchange markets in June and July 1997, a more careful reading of history places the origins of the “Asian problem” much earlier. For example, in Japan the close ties underlying the financial/industrial/government structure predates World War II. This closely integrated structure continued during the postwar reconstruction and served Japan and, later, other developing Asian economies well as they focused on becoming leading industrial powers during the 1950–80 period. However, in 1990 Japan’s financial markets were shocked with a dramatic price decline in the equity and real estate markets. Banks’ capital, heavily dependent on what had been inflated prices in these markets, suffered. Pressure on the banking system continued, as basic structural changes lagged. Economic growth in Japan has plodded along at an average annual rate of 1.7% since 1991 (excluding a short-lived upturn in 1996, the annual average is only 0.9%), less than half the average rate recorded during the period 1971–90.
Concern about the lackluster performance of the Japanese economy has been renewed as similar economic difficulties have surfaced elsewhere in Asia. In recent weeks the question has often been asked: Will the crisis spread to Japan? An equally appropriate question is: Have the economic problems associated with the structure of the Japanese economy spread to other countries in Asia that have embraced similar forms of financial/industrial/government integration, but are less well able to deal with potential economic disturbances? Apparently, the answer is yes.
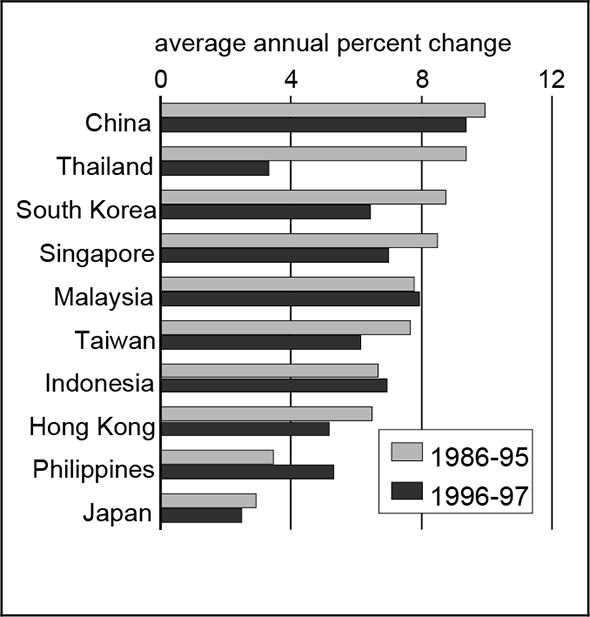
By late 1995 several Asian economies were experiencing signs of distress similar to those in Japan from the late 1980s—in particular, inflated land and equity values. In mid-1995, the U.S. dollar reversed its depreciating trend from the mid-1980s and began to appreciate against the yen (as the prolonged sluggishness of the Japanese economy become more widely acknowledged) and the continental European currencies (which faced increased market uncertainty with the approaching deadline for monetary union). Asian currencies (apart from the yen) were generally “managed” by their respective governments or pegged to a basket of currencies; in either case, they were heavily influenced by movements of the U.S. dollar. As a result, these currencies also appreciated, reducing these countries’ competitiveness in European and Japanese markets. This contributed to a slowing in their export-led economic growth. In much of Asia, GDP had slipped into the 5% to 7% range by 1997 (from the 7% to 10% range during the first half of the 1990s). (See figure 1.) Foreign lenders were becoming uneasy about the size of current account deficits and the increasingly overvalued Asian currencies.
1. GDP growth in Asian countries
In late 1996, the Thai government’s concerns about the stability of its economy led to major changes in the country’s economic leadership. The government’s apparent inability to implement major reforms and continued deterioration in economic conditions led to further changes in the country’s economic leadership in mid-1997. The political changes, a disclosure that the banking system held large quantities of undisclosed nonperforming loans, and reports that the International Monetary Fund was pressing the Thai government to address its financial difficulties quickly translated into speculative attacks on the Thai currency in foreign exchange markets. The market’s view that Asian currencies were overvalued spread to other currencies in the region, including those of Malaysia, Indonesia, and by late October, South Korea. (See figure 2.) The decline in Asian currencies further accentuated the stress on Asian financial markets, in particular on businesses and institutions that faced repaying substantial short-term foreign debt obligations with dramatically less valuable domestic currencies.
2. Asian exchange rates, 1997
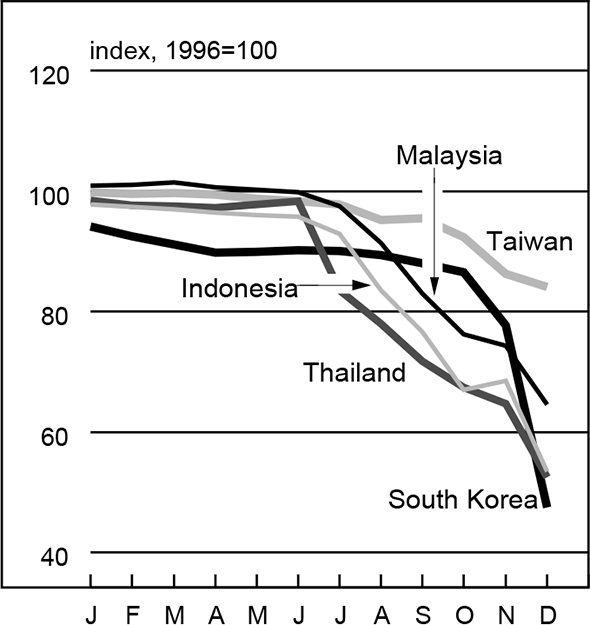
Sources: Board of Governors of the Federal Reserve System and New York Times.
U.S. trade with Asia
The initial real sector impact of the Asian situation on the U.S. economy will be on export industries and import competing industries.
U.S. exporters will find it more difficult to sell in Asian markets. First, the sharp appreciation of the dollar against Asian currencies means that the cost of U.S. goods in Asian domestic currencies is higher—a negative for U.S. exporters. Compounding the direct effect of reduced U.S. exports to Asia is the decline in the ability of U.S. exporters to compete with relatively lower priced Asian goods in third-country markets, whose home currencies have remained relatively stable against the U.S. dollar.
Second, economic policy adjustments to Asian economies, either domestically initiated or externally imposed as a condition for financial assistance from abroad, will sharply curtail economic growth. This will dampen Asian aggregate demand, including that for imported goods—another negative for U.S. exports. These negatives are all the more important given the growing importance of the Asian market to the U.S. Nearly 29% of total U.S. goods exports went to Asian markets in 1997, compared with 22% in 1980.
On the import side, a reduction in the dollar cost of imports from Asia is clearly a positive for U.S. consumers and producers who import components for their domestic production. However, U.S. industries competing with imports in the domestic market will be adversely affected by the Asian currency depreciations, to the degree that lower dollar import prices are passed through and the dollar prices to consumers for imported goods fall. Currently, 39% of U.S. goods imports come from Asian producers, compared with 25% in 1980.
Impact on the Midwest
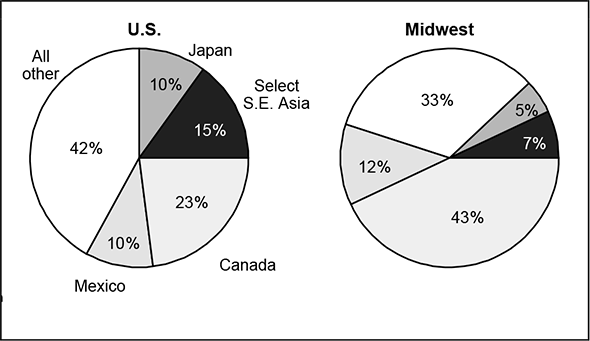
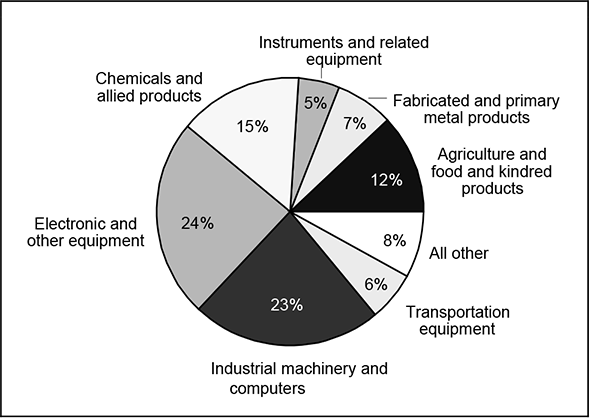
The direct negative effect on Midwest manufacturing exporters, in the aggregate, is expected to be somewhat smaller than for the U.S. overall. Asia is a comparatively small market for Midwest manufacturers, accounting for about 12% of manufactured goods exports from the region (see figure 3). By contrast, about 25% of all U.S. manufactured exports go to Asian markets.
3. Destinations of manufactured goods exports
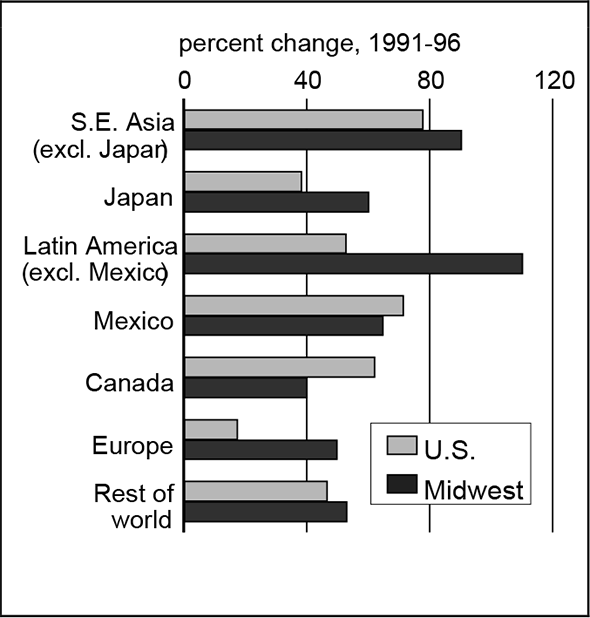
Nonetheless, apart from exports to Latin America, the most rapid growth in Midwest exports during recent years has been in shipments to Asian markets (see figure 4). Thus, a marked slowdown in exports to Asian markets could dampen export growth from the Midwest, relative to the first half of the 1990s. (Figure 5 shows Midwest exports to Asia by industry.)
4. Export growth
5. Top Midwest exports to Asia
Asia is an important market for U.S. farm commodities. Two-fifths of the dollar value of all U.S. agricultural shipments go to Asian markets. This is especially important for the Midwest, the epicenter of the nation’s soybean and corn production. For example, in 1996, the Midwest’s share of U.S. soybean exports was nearly 57%. Of that, 45% went to Asian markets. The Midwest accounted for 53% of U.S. feed grain (mostly corn) exports in 1996 with an equivalent of 57% of the total going to Asian markets.1
Higher prices for U.S. agricultural exports facing Asian consumers and lower (in some cases declining) income growth in those economies are likely to adversely affect Asian demand for U.S. and Midwest farm commodities. On the other hand, in recent years agricultural supply conditions abroad (for example, China periodically switching back and forth from net importer to net exporter of corn) appear to have had a major impact on Asian demand for U.S. farm commodities. Thus, while the current Asian situation can be expected to have a detrimental impact on Midwest agricultural exports to that region, changes in supply conditions abroad may well overshadow the demand effects.
On the import side, a substantial increase in U.S. imports of manufactured goods from Asian markets may result from reduced dollar prices of such goods. This will cause distributional gains or losses across industries and firms. Dominant Midwest industries, such as automotive and steel, will face increased competition from lower priced imports. Relative sensitivity to price changes between exported and imported goods will be a key factor in the distributional effects across firms. The greater the extent to which imports are substitutable for domestic production, the greater the impact will be on domestic industry. The net impact of these distributional effects across sectors is not clear at this point.
Conclusion
Demand for U.S. goods from the, until recently, rapidly growing economies of Asia is likely to be sharply curtailed as a result of their current economic difficulties. This will have a negative impact on Midwest exporters. Midwest manufactured goods exporters are likely to be affected relatively less than U.S. manufactured goods exporters. At the same time, Midwest and U.S. consumers of imported goods will clearly benefit from the Asian shock as it contributes to downward pressure on prices of imported as well as domestically produced import competing goods. The overall effect on the industrial and agricultural sectors of the Midwest economy, as well as on the U.S., will be negative. The magnitude of the net effect on the Midwest or the U.S. economy is not yet clear. What is clear is that the negative and positive effects will be distributed unevenly across the various sectors of the economy.
The longer this uneven distribution persists, and certain industries increasingly find themselves at a competitive disadvantage as a result of the Asian disturbance, the greater the likelihood that trade policy disputes will arise between Asian exporters and the industrial countries. In turn, political pressure within the U.S. and other industrial countries for the imposition of trade restrictions is likely to intensify. The avoidance of such a scenario and its attendant unfavorable economic distortions is potentially a major challenge facing the governments of the industrial countries.
Tracking Midwest manufacturing activity
Manufacturing output indexes (1992=100)
| November | Month ago | Year ago | |
|---|---|---|---|
| CFMMI | 125.5 | 124.6 | 118.8 |
| IP | 130.2 | 129.0 | 122.5 |
Motor vehicle production (millions, seasonally adj. annual rate)
| December | Month ago | Year ago | |
|---|---|---|---|
| Cars | 5.8 | 6.1 | 5.8 |
| Light trucks | 6.4 | 6.6 | 6.0 |
Purchasing managers’ surveys: net % reporting production growth
| December | Month ago | Year ago | |
|---|---|---|---|
| MW | 58.6 | 63.7 | 58.4 |
| U.S. | 55.4 | 58.6 | 58.5 |
Motor vehicle production (millions, seasonally adj. annual rate)
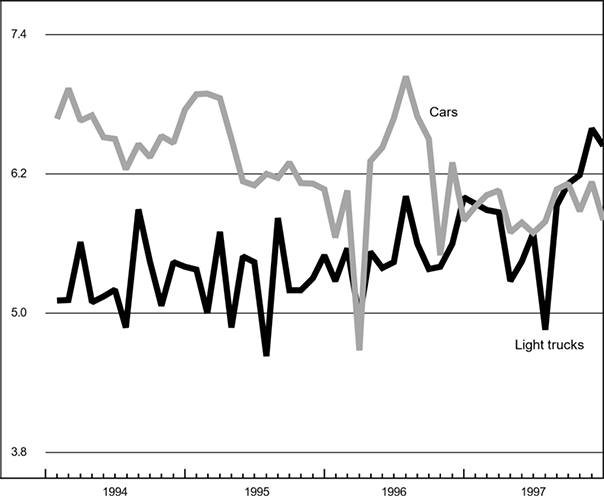
Total light vehicle production (seasonally adjusted annual rate) decreased from 12.7 million units in November to 12.2 million units in December. Light truck production decreased from 6.6 million units to 6.4 million units and car production decreased from 6.1 million units to 5.8 million units. Production for cars remained constant with December 1996 levels; however, light truck production increased from 6 million units in December 1996 to 6.4 million units in December 1997.
The CFMMI reached a record high of 125.5 in November. The Federal Reserve Board’s IP index for manufacturing also set a record high of 130.2 in November. The Midwest purchasing managers’ composite index for production decreased from 63.7% in November to 58.6% in December. The national purchasing managers’ composite index also decreased from 58.62% in November to 55.4% in December.
Notes
1 Agricultural export shares by region are based on an allocation of total U.S. agricultural exports to states (regions) based on the states’ (regions’) share of total U.S. agricultural production for specific commodities.


