

The following publication has been lightly reedited for spelling, grammar, and style to provide better searchability and an improved reading experience. No substantive changes impacting the data, analysis, or conclusions have been made. A PDF of the originally published version is available here.
By changing how it operates the discount window, the Fed aims to provide banks with a less burdensome source of short-term funding and to encourage commercial banks to occasionally use the Fed as a source of short-term funds.
On January 9, 2003, the Federal Reserve made two changes to the operation of the discount window, which allows banks to borrow from the Fed. These changes were aimed at providing banks with a less burdensome source of short-term funding.
First, the Fed relaxed many restrictions, so that banks in good health with adequate collateral no longer need to seek alternative sources of funds before coming to the discount window, nor do they generally need to provide a reason for their desire to borrow. Second, the Fed set the rates it charges on primary and secondary borrowing at 100 basis points and 150 basis points, respectively, over the Fed’s target for the federal funds (interbank) rate.1 Previously, the Fed had offered short-term loans to banks at below-market rates of interest. Taken together, these changes imply that banks willing to pay the higher explicit cost of borrowing from the Fed will be able to do so without being subject to much central bank scrutiny. Although the Fed has always offered a lending service, this recent change to discount window administration reflects, in part, an attempt to encourage commercial banks to use the Fed as a source of short-term funds. In this Chicago Fed Letter, I review the reasons banks may wish to borrow from the central bank, the historical data related to such borrowing, and the actual level of borrowing since these administrative changes.
Why borrow from the Fed?
The discussion here relates to the use of the discount window as a source of last-minute, short-term liquidity for financial institutions that are not financially troubled.2 For these institutions, the discount window may be a useful source of short-term funding in three circumstances. First, discount window loans may be attractive if they are available at a rate below what is available in the market. Second, discount window loans may provide last-minute funding to banks that unexpectedly find themselves deficient in satisfying their reserve requirements. Third, should unexpected payment outflows affect a bank’s reserve account late during a business day, discount window credit can be used to avoid an overnight overdraft.
Historical use and need for change
It is important to realize that the primary motivation for borrowing has changed over time. During the 1970s and 1980s, the discount rate was typically below the rate that banks faced in the federal funds market. As a result, supervisory scrutiny and central bank moral suasion were needed to limit the market’s use of such loans. In other words, the total costs of borrowing from the Fed were greater than the explicit cost of the discount rate, and these nonprice terms served to ration the amount of credit provided by the Fed. Nevertheless, banks did increase their borrowing from the Fed when the spread between the federal funds rate and the discount rate increased.3 Between 1975 and 1990, banks typically borrowed over $1 billion a day from the Fed.
During the early 1990s, however, borrowing from the discount window fell significantly, averaging only $233 million, even though this was a period of banking system stress (see figure 1). Peristiani (1998) argues that this decline may have been due to banks refraining from requesting discount loans because of the perception that it would send a negative signal to the Federal Reserve, bank supervisors, and eventually the market at large.4 Even when banks’ financial conditions improved in the mid-1990s, banks remained reluctant to borrow from the Fed.
1. Borrowing from the Fed
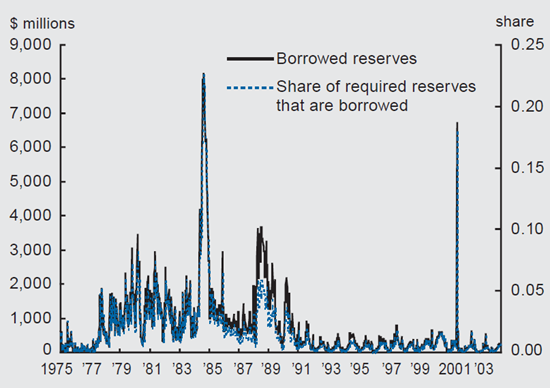
Partly to address this reluctance, the Fed replaced its adjustment and extended credit programs with the new primary and secondary credit facilities. Now, banks in good financial condition5 could borrow from the Federal Reserve at 100 basis points above the target federal funds rate.6 The above-market price of funds serves as a rationing mechanism that dramatically reduces the need for supervisory review of the potential borrower. Because use of the new primary credit facility would not necessarily imply anything negative about a borrower, banks should be more willing to use the facility if market or bank-specific conditions warrant. In fact, since the implementation of this new facility, banking supervisors have specifically announced that “occasional use of primary credit for short-term contingency funding should be viewed as appropriate and unexceptional by both [bank] management and supervisors.”7
As evident in figure 1, however, aggregate borrowing from the Fed seems to have changed little from the 1990s. This is consistent with the evidence presented in Furfine (2003), which suggests that during the first three months of the new facility’s operation, some banks were willing to pay more than 100 basis points above the target funds rate to a counterparty in the federal funds market rather than borrow at better terms from the Fed’s primary credit facility.8 Thus, the early evidence suggests a continued reluctance to borrow.
Discount window borrowing and reserve requirements
When a bank borrows from the Fed, it increases the funds it has in its reserve account held at the Fed, which the bank can apply toward meeting its reserve requirement. Thus, all else being equal, one would expect that when required reserves are higher, discount window borrowing would be higher. Figure 1 also plots discount window borrowing as a fraction of required reserves. There are no obvious differences between the two lines in figure 1 except for scale, suggesting that even relative to required reserves, discount window borrowing has been low since 1990. As reported in figure 2, banks have borrowed roughly 0.3% of required reserves since 2003, compared with 2.7% prior to 1990 and between 0.4% and 0.7% during the 1990s.
2. Summary statistics
| Total borrowed reserves (in $ millions) |
Average share of required reserves borrowed |
Average share of required reserve balances borrowed |
Average absolute funds rate deviation (percentage points) |
Average required reserve balance turnover |
|
|---|---|---|---|---|---|
| 1975-90 | 1,182.438849 | 0.027006668 | 0.045135045 | ||
| 1975-90 without Continental Illinois (5/16-12/19, 1984) |
1,011.750623 | 0.022234971 | 0.035648945 | ||
| 1991-96 | 233.0255591 | 0.004363043 | 0.011324851 | ||
| 1997-2002 | 261.658147 | 0.006498482 | 0.039656679 | 0.095559821 | 321.8599 |
| 1997-2002 without 9/11 and Y2K |
216.6699346 | 0.005299486 | 0.031624504 | 0.089825581 | |
| 2003-present | 113.0454545 | 0.002647286 | 0.010946472 | 0.051428571 | 286.4411 |
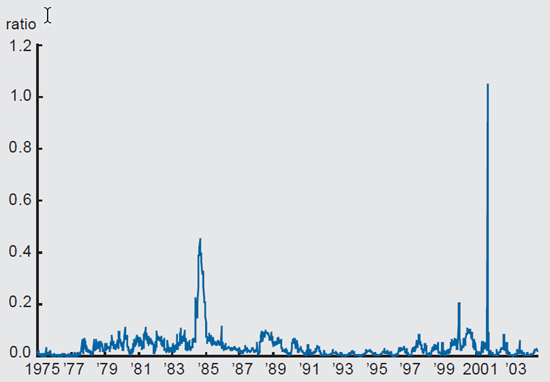
Upon further consideration, it is perhaps not surprising that variation in required reserves has little impact on discount window borrowing. Increased branch and ATM networks have increased the vault cash holdings of commercial banks, making it far more likely that a bank would be able to satisfy its reserve requirement through the holding of vault cash.9 As a result, required reserve balances, defined as the difference between required reserves and applied vault cash, may be a more appropriate scale by which to measure the use of the discount window. Figure 3 plots the ratio of discount window borrowing to required reserve balances. Figure 3 shows that, in particular, increases in discount window borrowing are most obviously related to problems with Continental Illinois in 1984, Y2K, and September 11, 2001. What seems apparent is that discount window borrowing as a fraction of required reserve balances was not all that low during the late 1990s compared with the pre-1990 experience. As reported in figure 2, abstracting from the aforementioned specific events, discount window lending accounted for 3.6% of required reserve balances between 1975 and 1990 and 3.2% of required reserve balances between 1997 and 2002. Since the implementation of the new primary credit facility, discount window borrowing has accounted for about 1.1% of required reserve balances.
3. Borrowing and required reserve balances
Reserve balances and the payment system
The demand for reserve balances is increasingly being driven by growth in interbank payment activity rather than by minimum reserve requirements.10 Figure 4 plots the aggregate value of interbank payments processed over Fedwire, the large-value payment system owned and operated by the Fed. The value of aggregate Fedwire payments increased from roughly $1.3 trillion a day in 1992 to roughly $3 trillion a day in early 2004. These payments are funded from an aggregate reserve balance that, as of the first quarter of 2004, averaged only $11.5 billion. To facilitate an efficient payment system, the Fed allows banks to maintain limited negative reserve balances during the business day at a low cost (currently 27 basis points at an annual rate) but imposes a stiff 400 basis point penalty on negative balances held overnight. Before 2003, banks faced with an unexpected negative balance late in the day might have gone to the discount window, but for reasons mentioned above, they may have remained reluctant. If the new primary credit facility reduced the perceived stigma of borrowing from the Fed, it is more likely that a bank in this situation would borrow from the central bank and pay a penalty of only 100 basis points.
4. Reserve balances and the payment system
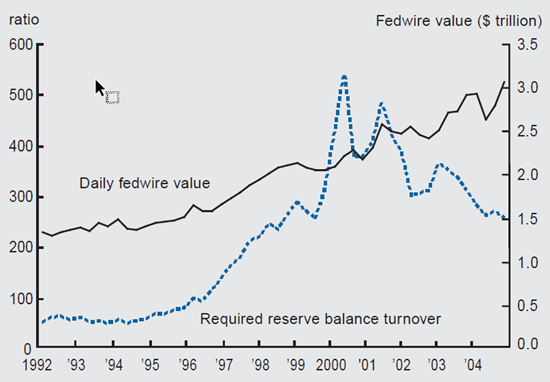
As the ratio of payment flows to reserve balances increases, it seems more likely that a bank might face a last-minute need for liquidity to avoid an overnight overdraft.11 Thus, reserve balance turnover, defined as the ratio of payment value to required reserve balances, might reasonably be related to the possible need for discount window loans. Figure 4 graphs this ratio. Balance turnover increased rapidly beginning in the mid-1990s and reached a peak of over 500 during the first quarter of 2000. Since that time, however, it has been declining, falling by half as of the beginning of 2004, as required reserve balances have increased rapidly since 2000 and deposits at commercial banks subject to reserve requirements have similarly expanded. Overall, figure 2 shows that the average reserve balance turnover was 322 between 1997 and 2002 and 286 since the beginning of 2003, but again, this difference in averages hides the more dramatic increase and subsequent decline in reserve balance turnover apparent in figure 4.
Thus, one interpretation of the higher ratio of discount loans to required reserve balances between 1997 and 2002 is that higher payment flows increased uncertainty in bank reserve accounts, leading to greater use of loans from the Fed. The apparent decline in borrowing since early 2003 would analogously be attributable to the lower turnover witnessed more recently.
Recent discount window borrowing and interest rate volatility
Since the rate on primary credit borrowing is currently set at 100 basis points over the Fed’s target federal funds rate, one might assume that the low-cost motivation for borrowing would no longer be present. This need not necessarily be the case, however, since any given bank may face rates in excess of the market (average) rate.12 One proxy for the expected demand for primary credit would be the volatility of the interbank market rate. As shown in figure 2, overnight interest rates were more stable after 2003. The average absolute funds rate deviation from target was approximately 9 basis points between 1997 and 2002 but only 5 basis points since January 2003. Thus, borrowing from the Fed’s primary credit facility may increase if the volatility of interbank interest rates returns to past levels.
Conclusion
Borrowing from the Federal Reserve’s discount window remains low. However, when put in perspective, discount window borrowing relative to required reserve balances between 1997 and 2002 was at levels similar to those of the years before banks became reluctant to borrow from the Fed in the early 1990s. More recently, discount window borrowing has been lower, but this could have been partially expected given the decline in payment-related balance turnover and reduced interest rate volatility.
Notes
1 These are the initial values and could be changed by the Fed.
2 This is in contrast to discount window use during financial crises. See Christopher J. Neely, 2004, “The Federal Reserve responds to crises: September 11th was not the first,” Review, Federal Reserve Bank of St. Louis, Vol. 86, No. 2.
3 This might happen, for example, when the Fed’s supply of nonborrowed reserves was low relative to the banks’ aggregate reserve requirement. See David L. Mengle, 1993, “The discount window,” Instruments of the Money Market, Timothy Q. Cook and Robert K. Laroche (eds.), Richmond, VA: Federal Reserve Bank, chapter 3, available at www.rich.frb.org/pubs/instruments/.
4 See Stavros Peristiani, 1998, ‘The growing reluctance to borrow at the discount window: An empirical investigation,” Review of Economics and Statistics, Vol. 80, No. 4, pp. 611–620.
5 Good financial condition requires a CAMELS (capital, asset quality, management, earnings, liquidity, and sensitivity) rating of no more than 3 and at least adequate capitalization.
6 See Brian F. Madigan and William R. Nelson, 2002, “Proposed revision to the Federal Reserve’s discount window lending programs,” Federal Reserve Bulletin, July, pp. 313–319.
7 See Federal Reserve, 2003, “Agencies issue guidance on appropriate use of discount window,” press release, July 23.
8 Evidence on bank-specific rates paid on federal funds borrowed is approximated from payment flow data. See Craig H. Furfine, 2003, “Standing facilities and interbank borrowing: Evidence from the Fed’s new discount window,” International Finance, Vol. 6, No. 3, pp. 329–347.
9 See, for example, Paul Bennett and Stavros Peristiani, 2002, “Are U.S. reserve requirements still binding?” Economic Policy Review, Federal Reserve Bank of New York, and Gordon H. Sellon, Jr., and Stuart E. Weiner, 1996, “Monetary policy without reserve requirements: Analytical issues,” Economic Review, Federal Reserve Bank of Kansas City, Fourth Quarter.
10 See Craig H. Furfine, 2000, “Interbank payments and the daily federal funds rate,” Journal of Monetary Economics, Vol. 46, No. 2, pp. 535–553.
11 Two factors work in the other direction. First, higher payment flows have been accompanied by technological improvements in bank cash management practices that allow for a closer monitoring of incoming and outgoing payments, thus reducing the scope for late-afternoon reserve balance surprises. Second, banks have increasingly relied upon “required clearing balances” as a means to acquire remuneration on reserves held at the Fed (see Bennett and Peristiani, 2002). These balances have expanded rapidly and are roughly the same order of magnitude as required reserve balances. Thus, had discount window borrowing been scaled to the sum of required reserve balances and required clearing balances, the apparent 1997–2002 increase in discount window borrowing would appear more muted.
12 An analysis of payment flow data suggests that although the market average rate is typically close to the target federal funds rate, differences occur across banks with respect to the average spread relative to the market. See Craig H. Furfine, 2006, “The costs and benefits of moral suasion: Evidence from the rescue of Long-term Capital Management,” Journal of Business, forthcoming.


