

The following publication has been lightly reedited for spelling, grammar, and style to provide better searchability and an improved reading experience. No substantive changes impacting the data, analysis, or conclusions have been made. A PDF of the originally published version is available here.
Evolving relations between carmakers and their parts suppliers have resulted in local, regional, and international shifts in the location of production. An upcoming Chicago Fed conference in Detroit will examine these ongoing structural changes, which are affecting the prospects for the U.S. auto industry’s continued concentration in the Midwest.
Motor vehicle production involves two types of firms: makers of parts (suppliers) and assemblers of finished vehicles (carmakers). The latter are better known to consumers because they market the vehicles with their brand names. However, suppliers employ three and a half times more people and add about 60% of the value of a finished vehicle.
Over time parts makers have taken on more responsibility in the vehicle production process so that an increasingly important factor influencing the competitiveness of carmakers is the strength and constructiveness of their relationships with their suppliers.
This Chicago Fed Letter sets the stage for a conference on this topic, titled “The Supplier Industry in Transition: The New Geography of Auto Production,” which is to take place on April 18 and 19, 2006, in Detroit (for details, please visit www.chicagofed.org/news_and_conferences/conferences_and_events/2006_auto.cfm). Structural changes in supplier–carmaker relationships have produced geographic shifts in production on three scales. On the local scale, close spatial networks and time-dependent relationships have formed between vehicle producers and key parts suppliers. On the regional scale, production has shifted from the Midwest to the South as new vehicle producers and parts suppliers entered the U.S. market and as sales of longtime domestic players declined. On the international scale, vehicles assembled in the United States contain an increasing percentage of parts produced overseas.
Local scale supplier–carmaker networks
Carmakers traditionally made most parts themselves and purchased the remainder through annual contracts with the lowest bidder. Now they outsource entire integrated modules to suppliers on multi-year contracts.
This shift in responsibility from carmakers to suppliers is reflected in employment changes. In 1990, 239,000 assembly plant employees and 653,000 supplier employees produced 9.5 million vehicles in the U.S. In 2000, after a decade of record high production, 237,000 assembly plant employees and 840,000 supplier employees produced 12.3 million vehicles (see figure 1).
1. U.S. motor vehicle production and employment
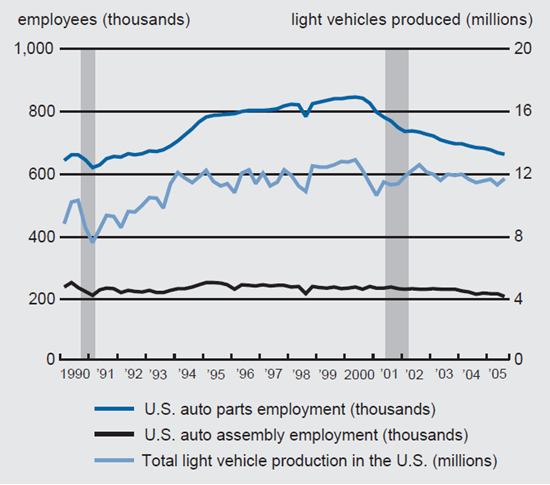
Sources: U.S. Bureau of Economic Analysis and Federal Reserve Board from Haver Analytics.
Suppliers are now required to deliver integrated modules to final assembly lines on a just-in-time basis, that is, with short order-to-delivery lead times. Accordingly, some suppliers have found it necessary to locate production within minutes of the final assembly plant, while others have located within a one-day driving radius of several hundred miles. Still, others have remained beyond the one-day radius, though they often depend on logistics specialists to facilitate timely pick-up and delivery of their products.
In general, engines, transmissions, seats, and large body stampings tend to be produced relatively close to final assembly plants. Honda’s two central Ohio final assembly plants, for example, receive engines, transmissions, and seats from suppliers within a 25-mile radius. Other key supplier plants, producing parts such as instrument panels, wheels, lighting, glass, and exhaust systems, are found within 200 miles of an assembly plant. Finally, electrical components, as well as subassembly parts delivered to seat and powertrain plants, are more likely to be located farther away.
Our research indicates that this geographic pattern is typical of the supply structure of an assembly plant located in the auto region. Accordingly, assembly plant openings or closings exert a concentrated geographic impact that radiates outward. Recent trends show no abatement in this regard. The assembly plants that opened in the deep South during the last few years seem to rely to a larger extent on dedicated supplier facilities, often located in supplier parks adjacent to the assembly plants themselves. Some of these dedicated supplier operations in turn are geared toward primarily performing logistics functions, such as kitting and sequencing the delivery of parts produced elsewhere to the assembly line.
Regional scale shifts in plant location
Historically, most parts were made in the Midwest and shipped to final assembly plants spread across the country near population centers, such as Boston, New York, San Francisco, and Los Angeles. Since 1980, nearly all final assembly plants in coastal states have been closed, and new ones have been constructed in the interior of the country, primarily in a north–south corridor formed by Interstate Routes 65 and 75, between the Great Lakes and the Gulf of Mexico. Locating assembly operations in the interior has minimized the cost of shipping finished vehicles to consumers, as well the cost of shipping parts from suppliers in the Midwest.1
During the 1980s, most of the new assembly plants were located in a relatively small area, encompassing central Illinois, Indiana, and Ohio in the north and central Tennessee in the south. While the drift was southward, connections to the traditional Midwest center were largely maintained. Since 1990, many of the new assembly plants have been sited in the deep South, centering on Alabama and Mississippi.
The continued drift southward reflects not only the siting decisions for new plants, but also the changing fortunes of various carmakers. Since 1980, the share of the U.S. market held by the traditional Big Three of Chrysler Group, Ford, and GM has declined from 75% to 54%. Most of the decline has occurred since 1999 (see figure 2). Foreign carmakers have been responsible for opening 14 of 18 new assembly plants since 1980, excluding those designed to replace older ones in the same metropolitan area, and they have strongly favored southern locations. As the Big Three have closed most of their coastal and southern plants, they have pulled back to their traditional Midwest home. Their U.S. production facilities are now more concentrated in the Midwest than they were 20 years ago.
2. Big Three and foreign nameplate auto sales
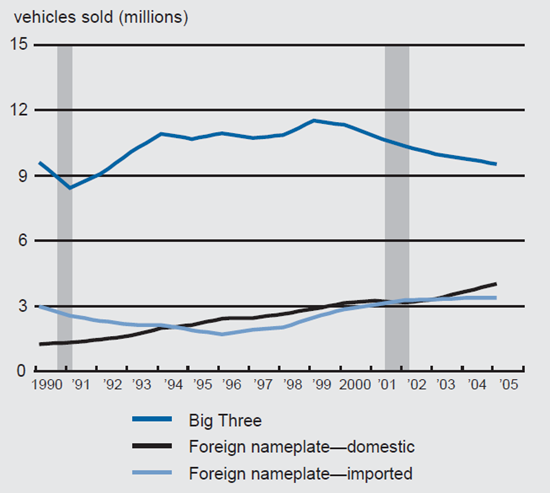
Source: Ward’s.
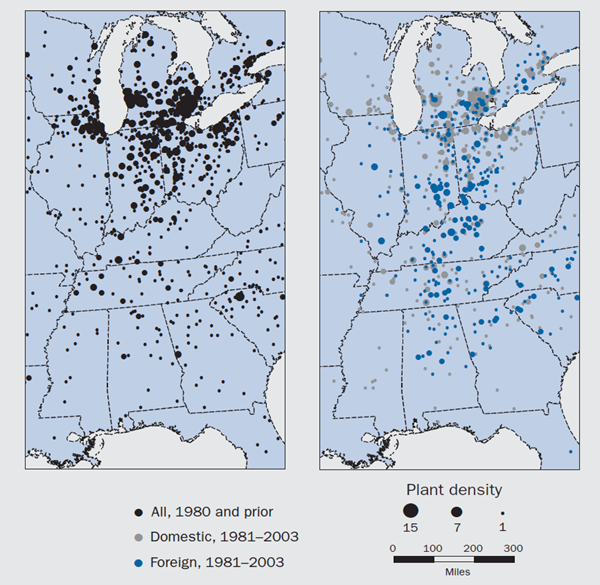
Suppliers have followed the foreign carmakers to the South. Today, the Midwest has 61% of all supplier plants, compared to 28% in the South. Prior to 1980, 69% of all supplier plant openings were sited in the Midwest, compared to only 19% in the South; however, since 1980, only 59% of supplier plant openings have been sited in the Midwest, compared to 34% in the South. Again, foreign companies have been responsible for a disproportionate share of the movement southward. The Midwest is home to 66% of domestic supplier plants compared to only 47% of foreign-owned ones; whereas, the South contains only 23% of domestic supplier plants compared to 42% of foreign-owned ones. As a result, the auto corridor is increasingly divided into a northern portion dominated by domestic suppliers and Big Three assembly plants and a southern portion dominated by foreign-owned suppliers and assembly plants.
The principal reason for the southward movement of final assembly and supplier plants concerns organized labor. Foreign-owned companies have been especially eager to avoid traditional concentrations of auto workers, especially unionized ones; 14% of foreign-owned supplier plants are unionized compared to 34% of domestically owned ones. The contrast is more extreme with final assembly plants: The Big Three plants are all unionized compared to only three of the 18 foreign-owned ones.
On the regional scale, this movement of the auto industry to the South represents a partial unraveling of the agglomeration that has dominated this industry for many years (see figure 3).
3. Changing geography of auto parts suppliers, by plant density
International scale change in production
The U.S. imported $77 billion of motor vehicle parts in 2004, accounting for 27% of the total market. The nominal value of net imports rose from $7 billion in 1997 to $30 billion in 2004.2
The rise in level of net imports of motor vehicle parts, which has accelerated since 2001, helps explain the break in the traditional relationship between auto production and auto industry employment, shown in figure 1. Production of light vehicles changed little between 2001 and 2005; whereas, employment declined by 10% from 236,000 to 212,000 among final assemblers and by 13% from 775,000 to 678,000 among suppliers of motor vehicle parts.
Productivity improvement has been an ongoing contributor to declining employment. The McKinsey Global Institute estimated that productivity in the U.S. motor vehicle industry increased by 3.3% per year between 1987 and 2002, compared to the national average of 2.1%.3 The larger drop in motor vehicle parts employment is related to a number of additional forces. The market share of vehicles imported from overseas has grown by 10 percentage points in the last decade. These vehicles embody parts that have primarily been produced outside the U.S. In addition, direct imports to the U.S. of motor vehicle parts continue to grow solidly. Finally, in conjunction with the market share losses experienced by the Big Three, concomitant exports of U.S. made vehicle parts to assembly facilities located in Canada and Mexico have leveled off since 2001.
Challenges for the Midwest
Figure 4 illustrates the extent of the structural changes currently shaping the U.S. auto industry. As the influence of the traditional domestic carmakers over the domestic market wanes, it is important to note that the carmakers whose market share is growing and their related supplier base have a different geographic footprint. While the domestic auto industry is doing well overall, with production of light vehicles averaging 11.7 million units over the last five years, the changing fortunes of individual carmakers have strong geographic implications. That presents a challenge to the Midwest region and many of its communities. Motor vehicle assembly and parts employment in the U.S. fell by just under 12% since 2001. However, that aggregate number masks rather dramatic regional differences: Michigan, the state by far most concentrated in this industry, has lost 23% of its auto industry jobs in that time period. The traditional auto industry states of Michigan, Indiana, and Ohio as a group lost 17.4%. The rest of the country, in this case primarily the southern end of the auto region, has lost only 6.8%—a decline that is two and a half times smaller than what the three core states experienced and just over half the overall U.S. decline in auto industry jobs. As these developments play out, this industry and its traditional core region are facing a painful adjustment to a new geography.
4. Regional change in auto industry employment
| 2001 | 2005 | Change | |
| (thousands) | (percent) | ||
| Michigan | 291.2 | 224.1 | -23.0 |
| Indiana | 96.8 | 88.5 | -8.6 |
| Ohio | 141.3 | 124.6 | -11.8 |
| Rest of the U.S. | 524.1 | 488.2 | -6.8 |
| U.S. total | 1,053.4 | 927.7 | -11.9 |
Notes
1 The reconcentration of assembly plants in the heart of the country was driven by an increase in the choice of models available to the consumer that far outpaced the growth of the market, resulting in much reduced production runs per model. As a result, individual models tend to support only a single assembly plant. That plant is then best located in the heart of the country, as the final product has to be shipped all over the country from that one production location. See Thomas Klier, 2005, “Determinants of supplier plant location: Evidence from the auto industry,” Economic Perspectives, Federal Reserve Bank of Chicago, Vol. 29, No. 3, Third Quarter, pp. 2–15.
2 For details, see Thomas H. Klier and James M. Rubenstein, 2006, “Competition and trade in the U.S. auto parts sector,” Chicago Fed Letter, Federal Reserve Bank of Chicago, No. 222, January.
3 McKinsey & Company, McKinsey Global Institute, 2005, Increasing Global Competition and Labor Productivity: Lessons from the U.S. Automotive Industry, report, New York, November, p. 9.


