

The following publication has been lightly reedited for spelling, grammar, and style to provide better searchability and an improved reading experience. No substantive changes impacting the data, analysis, or conclusions have been made. A PDF of the originally published version is available here.
Millions of low-income individuals in the United States are aided through community development programs, which are funded by federal, state, and local governments. The authors consider whether federal transfers and expenditures from moneys generated by states and localities respond to state-level trends in unemployment and poverty.
Community development spending is an important component of the U.S. public welfare system, directly affecting the lives of many who live in the U.S. Nearly 9 million low-income individuals live in housing subsidized by the U.S. Department of Housing and Urban Development (HUD).1 Total federal spending on community development exceeded $45 billion in 2004— approximately $155 for each person living in the U.S.2
In this Chicago Fed Letter, we analyze two components of each state’s community development spending for the period 1981–2004. First, we look at transfers from the federal government that are subsequently spent by states and localities, and second, we examine expenditures from moneys generated by states and localities (hereafter referred to as “state-generated expenditures”). We analyze the determinants of both the federal and the state/local components of total state spending on community development. For example, we consider whether federal transfers and state-generated expenditures respond to state-level trends in unemployment and poverty. These exercises help us to understand how we should think about public community development spending: that is, whether it should be regarded as part of the social safety net that responds to short-term economic fluctuations—such as periods of high unemployment—or as part of the social safety net that focuses more on alleviating long-term and persistent conditions—such as high rates of poverty.
What do we mean by community development?
We define community development as “construction, operation, and support of housing and redevelopment projects and other activities to promote or aid public and private housing and community development.”3 We ignore nongovernmental expenditures on community development. Also, when we talk about “total state spending,” we mean total state and local government spending on community development.
Our data on state spending on community development, as well as supplemental population data, are from the U.S. Census Bureau’s Annual Survey of State and Local Government Finances and Census of Governments (1981–2004).4 The data cover all 50 states and include information on federal transfers to each state (and its localities), as well as total state spending on community development.5
The data specifically exclude the following: HUD-administered direct loans from the Federal Housing Administration to individuals, builders, and landlords; building inspection and enforcement of housing codes or standards; temporary shelters or housing for the homeless; and military housing. Additionally, this survey of state and local governments does not include large tax-incentive programs, such as low-income housing tax credits and new markets tax credits.
To supplement the state and local government expenditure data, we use information on unemployment, poverty, and personal income per capita for each state from the U.S. Bureau of Labor Statistics, Local Area Unemployment Statistics; the U.S. Census Bureau’s Historical Poverty Tables; and the U.S. Bureau of Economic Analysis’s Regional Economic Accounts.
Spending trends
Figure 1 describes overall trends in community development spending in real 2000 dollars per capita. There was a gradual upward trend in real expenditure per capita on community development for the contiguous U.S. as a whole, from $51 in 1981 to $115 in 2004, which corresponds to an average annual real growth rate of roughly 4%. This increase is over and above increases in spending that simply keep pace with inflation.
1. Community development spending in the U.S., 1981–2004
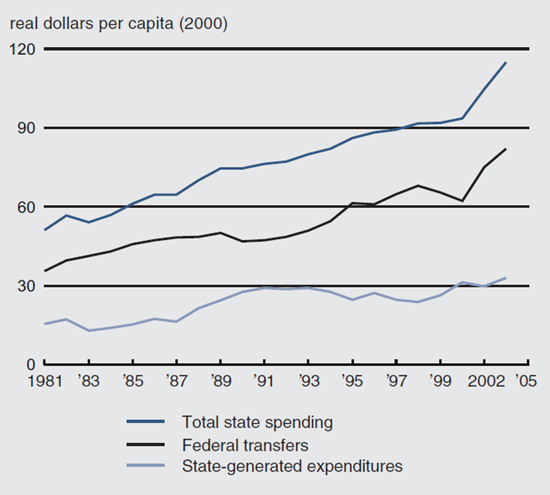
Source: Authors’ calculations based on data from the U.S. Census Bureau, Annual Survey of State and Local Government Finances and Census of Governments, 1981–2004.
Federal transfers consistently made up approximately 70% of overall state/local spending on community development, and these transfers have been the driving force behind the gradual increase in overall spending, rising from $36 in 1981 to $82 in 2004. State-generated expenditures account for about 30% of overall state/local spending. Analogous to the rise in federal transfers, state-generated expenditures more than doubled from $16 in 1981 to $33 in 2004.
Variation across states
Examining figure 2, we see significant variation in spending across states. For example, if we rank them in order of their total state spending on community development in 2004, spending ranges from a high of $227 per person in Massachusetts to a low of $27 per person in Wyoming. For the contiguous U.S., the average is $115 per person.
2. 2004 total spending on community development, by state
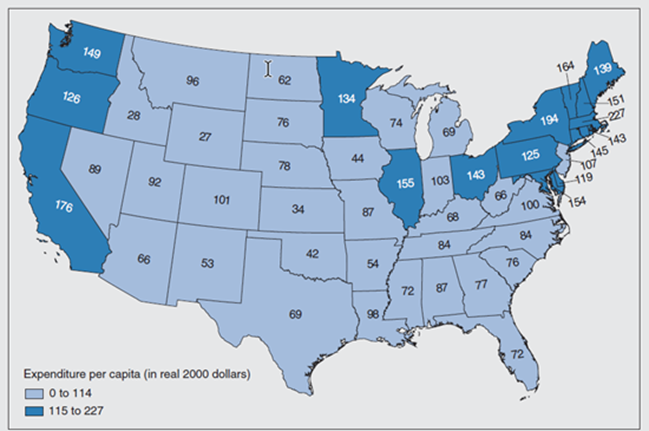
Source: Authors’ calculations based on data from U.S. Census Bureau, Annual Survey of State and Local Government Finances and Census of Governments, 1981–2004.
States along the West Coast and in New England, as well as New York, Pennsylvania, Delaware, Maryland, Minnesota, Illinois, and Ohio, have above-average levels of total state spending on community development.6 To better understand these variations, we analyze several potential determinants of community development spending.
Analysis
Recall that total state spending on community development has two components: transfers from the federal government to state and local governments and expenditures from moneys generated by states and localities. Using regression analysis, we analyze the determinants of these two components separately. We estimate two regressions with federal transfers as the dependent variable and two regressions with state-generated expenditures as the dependent variable.7 Independent variables include the following: population, population per square mile, one-year lagged unemployment rate, one-year lagged poverty rate, and annual personal income per capita.
First, we estimate the impact of state-generated expenditures on federal transfers; then we estimate the impact of federal transfers on state-generated expenditures. We do this to explore the possibility of an automatic relationship between federal transfers and state-generated expenditures. This would be the case if, for example, there were a federal matching program for state spending on community development, as is the case with Medicaid. Next, we add state-specific controls, including population, population per square mile, one-year lagged unemployment rates, one-year lagged poverty rates, and annual personal income per capita. In addition, we include a full set of year fixed effects in all the regressions to account for trends in the national economic and political environment that may affect community development spending in all states.
Federal transfers
Regarding the effect that state-generated expenditures alone have on federal transfers, we find that all else being equal, states that generate $1 more for community development than the average state receive an additional $0.19 of federal funding per capita.
When controlling for state-specific characteristics, we find no evidence of an automatic relationship between federal transfers and state-generated expenditures. In fact, states that generate $1 more for community development than the average state receive $0.08 less federal funding per capita. All else being equal, population does not appear to be a significant determinant of federal transfers. Population density, on the other hand, plays an important role. For example, New York, which has a population per square mile one standard deviation more than an average state like Michigan, will receive an additional $9.59 per person from the federal government for community development, according to our estimates.
State poverty and unemployment rates also significantly influence federal transfers for community development. For instance, our results indicate that Kentucky, which has a poverty rate one standard deviation higher than an average state like Michigan, will receive an additional $3.83 per person from the federal government for community development. Conversely, Louisiana, which has an unemployment rate one standard deviation higher than an average state like Arizona, receives $2.22 less per person from the federal government for community development. Federal transfers for community development appear to respond countercyclically to less persistent economic challenges, such as unemployment, which tend to fluctuate; however, federal transfers are increasing in persistent measures of economic stress, including the poverty rate.
Annual personal income per capita is another factor that plays a significant role in the level of federal transfers. For example, Maryland, where the annual personal income per capita is one standard deviation higher than that of an average state like Kansas, receives $10.85 more per person from the federal government for community development.
We also observe that while poverty rates do positively influence federal transfers, income per capita and population per square mile have a larger impact on the allocation of federal dollars. To be exact, states with poverty rates one standard deviation above the mean receive 8% more in federal transfers per person than states with an average poverty rate. On the other hand, states with population densities one standard deviation above the mean receive 19% more in federal transfers than states with an average population density, and states with annual personal income per capita one standard deviation above the mean receive 22% more in federal transfers than states with an average annual personal income per capita. So, for example, Arkansas, despite its high poverty rate of 15.1%, had below-average total state spending on community development ($54.34 per person) in 2004 because it had a low annual personal income per capita ($23,662) and was sparsely populated (53 people per square mile).
State-generated expenditures
Federal transfers have a significant negative impact on state-generated expenditures when we include other controls. States that receive $1 more of federal funding per capita than the average state generate $0.07 less per capita for community development.
Annual personal income per capita is positively associated with state and local spending as it is with federal transfers for community development. For instance, Maryland, where annual personal income per capita is one standard deviation higher than that of an average state like Kansas, generates $13.94 more per person for community development. This suggests that states with a lower annual personal income per capita may find it challenging to generate resources for community development programs.
In contrast to its insignificant effect on federal transfers, population is a significant determinant of state-generated expenditures. To illustrate, our results imply that Ohio, where the population is one standard deviation higher than that of an average state like Missouri, generates $3.73 more per person for community development. Population per square mile, lagged unemployment, and lagged poverty do not appear to be significant determinants of state-generated expenditures for community development.
Conclusion
Community development programs directly benefit at least 9 million low-income individuals living in publicly subsidized housing in the U.S. Real state spending per capita for these programs has increased nearly 4% in each year of our sample period, rising from $51 in 1981 to $115 in 2004. Approximately 70% of these funds come from federal transfers to states and localities, and about 30% come from state-generated expenditures.
To determine what factors influence community development spending, we performed a series of regression analysis. As these exercises were intended to examine the factors that are correlated with community development spending rather than to model the process by which those expenditures are determined, we can only draw some very tentative conclusions as to why the relationships we have highlighted exist. First, states with higher population densities tend to receive more federal transfer funds per person than states with lower population densities, all else being equal. This relationship seems appropriate considering that most community development programs are targeted at urban areas—and states with large urban areas are more densely populated than states without large urban areas.
Our analysis also shows that states with higher annual personal income per capita generate more community development spending and receive more federal transfer funds than states with lower average incomes. While it makes sense that states with higher average incomes are able to afford more community development spending, at first glance it seems puzzling that these states are also receiving more in federal transfers than states with lower average incomes. Recall, however, that community development programs are generally geared toward low- and moderate-income individuals and neighborhoods. Low- and moderate-income are defined in terms of relative, not absolute, levels of income. This helps to explain why states with higher average incomes receive larger transfers of federal funds for community development.
Finally, we find that states with higher poverty rates tend to receive more in federal transfers than states with lower poverty rates, and we find that states with higher unemployment rates tend to receive less than states with lower unemployment rates. This finding suggests that community development spending responds to persistent economic challenges, such as poverty, rather than to shorter-term economic fluctuations, such as unemployment.
Notes
1 Public housing data are available from HUD at www.hud.gov/renting/phprog.cfm. Voucher data are available from the Center on Budget and Policy Priorities at www.centeronbudget.org/5-15-03hous.htm.
2 This value is in nominal 2004 dollars. The rest of the analysis uses values in real 2000 dollars.
3 U.S. Census Bureau, Governments Division, 2000, Federal, State, and Local Governments: Government Finance and Employment Classification Manual, November 16, available at www.census.gov/govs/www/classfunc50.html.
4 Complete data are not available for 2001 and 2003 for this survey, so we exclude these years from the analysis.
5 Alaska and Hawaii are excluded in our analysis because they are outliers in terms of total state spending.
6 New England, as defined by the U.S. Census Bureau, comprises Maine, Vermont, New Hampshire, Connecticut, Massachusetts, and Rhode Island.
7 Further details and regression results are available from the authors upon request.


