

We estimate a simple model in which variations in Illinois daily municipal bond yields are explained by high-frequency indicators summarizing economic and public health conditions in Illinois, as well as key changes in the Federal Reserve’s Municipal Liquidity Facility (or MLF). We find that the MLF appears to have reduced Illinois muni yields by more than 200 basis points.
The Covid-19 pandemic put finances of states and municipalities across the country under severe stress. This stress derived both from reductions in revenues associated with lower economic activity and increased demands on public health and social safety measures. State and local governments have received substantial federal support through the CARES Act. They have arguably also benefited from the establishment of the Federal Reserve’s Municipal Liquidity Facility (MLF)—announced on April 9 to address the liquidity needs of municipal authorities and support market functioning. At the time of writing, Covid-19 cases, hospitalizations, and deaths are reaching record levels across the country, particularly in the Upper Midwest. Yet, additional federal assistance remains uncertain, and the MLF is scheduled to expire on December 31, 2020. This Chicago Fed Letter asks the question whether the facility helped alleviate funding pressures for state and local governments.
To address this question, we focus on the market for municipal securities (munis) of the state of Illinois.1 On June 2, 2020, Illinois became the first MLF subscriber by issuing $1.2 billion of 12-month general obligation (GO) notes to the facility at a rate of 3.82%, which was more than 100 basis points (bps) lower than yields on comparable notes issued by the state in the private market in mid-May. As of October 30, Illinois muni yields are about 300 bps lower than they were in mid-March. The mere ability to issue new debt and the potential savings from debt refinancing are important options for authorities that are trying to overcome 2020 shortfalls and alleviate the burden of projected 2021 budget deficits without reducing essential services.
Background
For context on the severity of the economic situation in Illinois, consider the City of Chicago. Between January and September 2020, the total employment rate in Chicago had decreased by 6%, while that of workers in the bottom wage quartile (i.e., those earning less than $27,000 per year) had decreased by about 35%.2 As record numbers of new unemployment claims persisted for months, an estimated $10 billion in supplemental unemployment benefits (from the CARES Act) went to Illinois, providing relief in the early months of the pandemic.3 But those benefits have expired, and the pandemic is raging.
Businesses, especially those in hospitality, retail, and transportation, have been hit hard. The number of small businesses open as of October 31 was 31.5% lower than at the start of the year. Government assistance programs, such as the federal Paycheck Protection Program and the Chicago Resiliency Fund, provided emergency support to a number of businesses, partially mitigating the impact of the sudden decline in consumer spending (down about 15% since January 2020). However, because of new restrictions on activity and the winter weather, small businesses face grimmer prospects in the months ahead.
City officials projected that Chicago would end 2020 with an $800 million budget shortfall and a 2021 deficit of $1.2 billion. About 78% of this deficit is driven by local revenue losses due to Covid-19, which equates to an almost 18% reduction from budgeted 2020 revenues—a figure similar to that in many cities and states across the country.4 To battle these financial challenges, the city has been exploring a variety of options, including savings from debt refinancing. On October 21, officials announced a plan to borrow an additional $1.7 billion to refinance existing debt to save $450 million in 2020 and $501 million in 2021.5 A week later, Fitch and Moody’s joined Standard & Poor’s (S&P) in revising Chicago’s credit rating outlook from stable to negative.6 This could hurt the city’s ability to take advantage of low interest rates in the future.
Since March 2020, S&P has downgraded the credit ratings of three states (Alaska, New Jersey, and Wyoming) and given negative outlooks to another 11 states.7 If municipalities continue to experience large revenue losses due to business closures, elevated unemployment, and reduced economic activity, while spending continues to rise to counteract the effects of the pandemic, larger deficits may become unsustainable. This could result in widespread credit rating downgrades and defaults, as well as cuts in municipal employment and capital investment (e.g., infrastructure projects), which can negatively affect the U.S. economic outlook—as state and local governments contribute 11% to gross domestic product and 13% to total employment. Downgrades and defaults could also trigger sizable redemptions from municipal bond mutual funds like those observed in March. The resulting fire sales in muni bonds would amplify price declines, impair primary and secondary markets, and transmit losses to other bondholders.
Fed interventions in the muni market
In response to strains in the U.S. muni market in March, the Fed took a number of actions.8 On March 23, certain short-term municipal securities became eligible for the Fed’s Money Market Mutual Fund Liquidity Facility and its Commercial Paper Funding Facility.
On April 9, the Fed established the MLF to support municipalities through the purchase of up to $500 billion of short-term notes (up to 24-month maturity) until September 30, 2020. Eligible issuers initially included only states and Washington, DC, counties with more than 2 million residents, and cities with more than 1 million residents. This was perceived by some market participants as a relatively narrow scope.
On April 27, the Fed announced an expansion of the scope and duration of the MLF by making eligible counties with more than 500,000 residents, cities with more than 250,000 residents, and multistate entities.9 It also increased the maturity of eligible short-term notes from 24 to 36 months and extended the duration of the MLF from September 30 to December 31, 2020. Further, the Fed indicated that loans could be used to pay principal and interest on existing obligations and, if two rating agencies had assigned an investment grade rating before April 8, then issuers could still access the MLF even if later downgraded up to three notches below BBB–.
On May 11, the Fed published the MLF’s pricing methodology: a fixed spread over comparable maturity overnight index swap rates based on the rating of the eligible notes.10 For higher-rated issuers, the prevailing muni market rates were below those determined by the MLF; for borrowers rated BBB and below, the MLF rates were favorable (e.g., BBB– spread was 380 bps), most likely prompting usage of the facility. Market participants have been viewing the MLF as a backstop because of these terms.
On June 3, the Fed announced another expansion to the number and type of entities eligible to directly use its MLF. This expansion targeted states with few or no cities or counties meeting the population thresholds required for eligibility.
Finally, on August 11, the Fed reduced the interest rate spread on tax-exempt notes for each credit rating category by 50 bps.
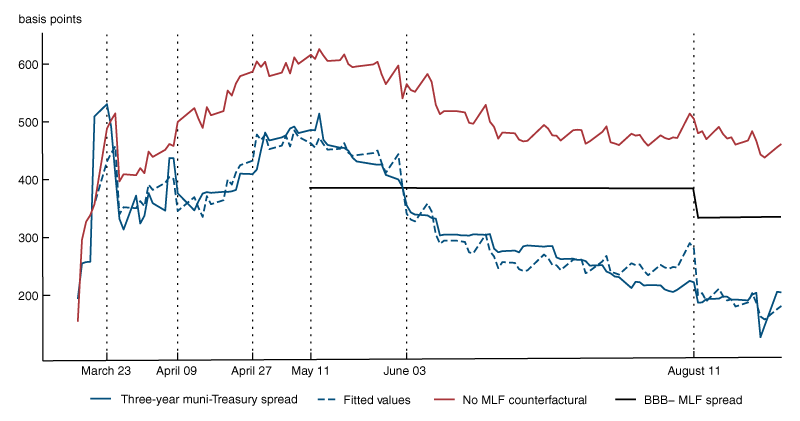
As shown in figure 1, which plots the Illinois three-year spread between GO muni and Treasury yields (solid blue line) together with vertical bars marking the Fed announcements, on April 9, June 3, and August 11, the spread dropped between 30 and 60 bps on each of these announcement dates.11 Interestingly, the June 3 announcement brought muni yields at eligible maturities below the MLF rate (solid black line).
1. Actual and model-implied fitted values for the three-year muni spread
It should be noted that, in its current form, the MLF can likely smooth the impact of credit risks posed by temporary revenue shortfalls. But, without additional federal assistance to municipalities, the MLF alone probably cannot prevent credit risks posed by a prolonged pandemic from becoming structural in the longer term. This is because the MLF’s structure poses certain limitations. First, the MLF is set to expire at the end of the year. Second, it is limited to 400 authorities (out of more than 40,000), the primary market, and notes with no more than 36 months until expiration. And third, the MLF pricing is at a “penalty rate” above the typical market rate, which suggests that it is an emergency rather than a preemptive tool.
A daily model of Illinois muni yields
To quantify the economic impact of the pandemic and of the Fed’s MLF on the Illinois muni market, we estimate a simple model in which daily variations in spreads between GO muni and Treasury yields of various maturities are explained by a number of high-frequency indicators summarizing economic and public health conditions in Illinois as well as key changes to the MLF. The sample period starts on March 16 and ends on September 1, 2020.
Our economic indicators include the following variables. 1) Initial and continued unemployment claims, which capture the spending increase related to unemployment as well as its persistence. These are available at weekly frequency and are assigned to the date of their release, when they become known to investors. 2) Google workplace mobility data, available daily, measure how the number of visitors to workplaces change relative to baseline days (January 3–February 6) preceding the pandemic’s outbreak. This variable captures future reductions in economic activity as more people stay or work from home. We also considered Google residential mobility data, but the information content is very similar. 3) From Opportunity Insight’s Economic Tracker, we include the percentage change in the number of small businesses open compared with January 2020, which has bottomed out at around –30%. This variable is also available at daily frequency and should capture how the pandemic affected Illinois businesses. We also experimented with the percentage change in small business revenues, which has a very similar information content. 4) Finally, we include the percentage change in year-over-year seated diners at a sample of restaurants on OpenTable, which includes online reservations, phone reservations, and walk-ins. This variable is meant to capture conditions specific to the leisure/hospitality sector.
We include three public health indicators: 1) daily changes in new Covid-19 cases, 2) daily deaths from the New York Times, and 3) the positivity rate from Economic Tracker. The first variable measures the acceleration and deceleration of the pandemic. The daily number of Covid-related deaths helps capture pressure on hospitals and related health costs. The positivity rate is constructed as the ratio of seven-day moving average of new cases to new tests.
Importantly, we also include monetary policy variables that capture the introduction of and key changes to the MLF. For each announcement described in the previous section, we include a dummy set to one starting on the day of the announcement. We also include the amount in millions issued to the MLF on the day of issuance.
Finally, to control for the credit risk associated with Illinois debt, we include the credit default swap spread of corresponding maturity from Bloomberg (lagged by one trading day to avoid simultaneity issues).
Results
Figure 2 summarizes the results of our baseline specifications for the three- and four-year GO muni–Treasury spreads. Although short-term muni yields behave quite similarly, the three-year notes are eligible for issuance at the MLF while the four-year notes are not. Thus, to the extent that the MLF eligibility creates some discontinuity, these spreads could be of interest. Our baseline specifications, estimated at various maturities, explain about 90% of variations in muni spreads—even at the 30-year maturity, which is often considered the muni benchmark. The model-implied fitted values for the three-year maturity are reported in figure 1 (dashed blue line).
2. Results of our baseline specifications
| Variables | Muni–Treasury spread Three-year |
Muni–Treasury spread Four-year |
|---|---|---|
| Ln(Initial claims/100,000) | –51.07 *** | –45.60 *** |
| Ln(Continued claims/100,000) | 84.09 ** | 91.65 *** |
| Workplace mobility | –7.164 *** | –6.763 *** |
| Δ Number of small businesses open | –353.5 | –424.5 * |
| Δ Diners year over year | –0.837 | –0.722 |
| Δ Daily cases/100,000 | –0.210 | –0.212 |
| Test positivity rate | –2.189 | –3.382 |
| Daily deaths/100,000 | 20.72 * | 21.80 * |
| March 23 announcement | –57.04 | –84.31 |
| April 9 announcement | –96.94 *** | –92.52 *** |
| April 27 announcement | 27.69 | 18.33 |
| May 11 announcement | –27.03 | –33.03 |
| June 3 announcement | –70.76 *** | –73.82 *** |
| August 11 announcement | –56.04 *** | –47.82 *** |
| MLF issuance ($ millions) | –0.0325 | –0.0425 |
| Lag CDS spread | 0.202 ** | 0.180 ** |
| Constant | –426.2 ** | –462.4 ** |
| Observations | 119 | 119 |
| R-squared | 0.899 | 0.905 |
** p < 0.05
* p < 0.1
As shown in the first column, apart from initial unemployment claims (whose sharpest increase coincided with the largest drop in muni yields following the March 23 announcement), most of the high-frequency economic indicators are statistically significant and have the expected sign. A 10% change in the level of continued claims is estimated to increase the three-year muni spread by 8.4 bps, all else being equal. If there is a 1 percentage point drop in the workplace mobility data, the same muni spread is estimated to increase by about 7 bps. Since in our sample, the average decline in workplace mobility is 42%, the associated decline in economic activity could have increased muni spreads by about 295 bps, all else being equal. If all small businesses were to close, we estimate that the three-year muni spread would increase by about 350 bps because of the catastrophic reduction in revenues. However, this variable becomes significant beyond the three-year maturity and its impact grows larger. Finally, the change in the number of seated diners relative to the previous year is not statistically significant, as this was probably crowded out by our control for small business conditions.
Of the public health indicators, only the coefficient for new Covid-19 deaths is positive and marginally significant. This is not surprising since Covid-19-related variables likely should not affect muni spreads above and beyond their impact on the economy. The marginal explanatory power of newly reported deaths could be a result of our economic indicators not capturing higher spending associated with high hospitalization rates and ICU occupancy. The estimated coefficient indicates that one additional Covid-19 death per day per 100,000 residents would increase the muni spread by about 20 bps. In our sample, the average daily deaths are about 0.55 per 100,000.
Turning to the impact of the MLF, the April 9, June 3, and August 11 announcements had a statistically significant negative impact on Illinois muni yields, reducing the three- and four-year muni–Treasury spreads by about 220 bps. To illustrate the overall effect of the Fed actions, figure 1 displays in red the projected evolution of the three-year spread in the absence of the Fed announcements.12 It is evident that in April and May without the safety net of the MLF, the spread would have continued to deteriorate, reaching a peak of 600 bps, and would still be almost 300 bps higher than its pre-Covid levels. Further, Illinois issuance to the MLF did not affect its muni yields in the secondary market.
Interestingly, all the results are quite similar for the four-year muni–Treasury spread, as shown in the second column of figure 2. Importantly, when the same specification is estimated in a panel of 20 U.S. states while controlling for state fixed effects, the total average impact of the Fed announcements is about 110 bps. This effect is quite large, but it is only half of the impact estimated for Illinois, which suggests that the MLF might be more helpful to states with lower credit ratings.
Conclusion
The acceleration of the pandemic in mid-March had the potential to generate severe upward pressure on municipal bond yields for many state and local governments. Our estimates for Illinois corroborate the view that revenue shortfalls due to small business closures and significant declines in workplace mobility have large and positive effects on muni yields. Similarly, continued unemployment claims and newly reported Covid-19 deaths have pushed muni yields significantly higher, likely through increases in public health and social safety spending. According to our estimates, the MLF appears to have reduced Illinois muni yields by more than 200 bps, thus helping to alleviate some of the budgetary pressures. In all, our results suggest that the MLF has been a helpful addition to the Fed policy toolkit.
Notes
1 In a more detailed research paper that will become available soon, we analyze a much larger panel of states.
2 Data cited in this paragraph and subsequent paragraphs are available online.
3 All Chicago budget numbers cited in this article are from the Chicago Budget Portal, available online.
4 For example, as of June 30, 2020, the Center on Budget and Policy Priorities projected that 2021 revenue declines for 40 out of 50 states are about 12%, on average, from pre-Covid 2021 revenue projections.
5 City of Chicago, Office of the Mayor, 2020, “Mayor Lightfoot releases 2021 budget proposal,” press release, Chicago, IL, October 21, available online.
6 As of October 30, Chicago has a BBB– rating (one notch above junk) with a negative outlook from both Fitch and Standard & Poor’s and a junk rating with a negative outlook from Moody’s Investors. See Fran Spielman, 2020, “Moody’s Investors reaffirms Chicago’s junk bond rating but lowers outlook to ‘negative,’” Chicago Sun-Times, October 29, available online.
8 For more details on the muni market strains, see Marco Cipriani, Andrew Haughwout, Ben Hyman, Anna Kovner, Gabriele La Spada, Matthew Lieber, and Shawn Nee, 2020, “Municipal debt markets and the COVID-19 pandemic,” Liberty Street Economics, Federal Reserve Bank of New York, blog, June 29, available online. Press releases announcing details of Fed actions can be viewed by date online.
9 These entities include the New York Metropolitan Transit Authority (MTA), which became the second MLF subscriber when it issued $450.7 million to the facility in August. More details available online.
11 The constant maturity GO muni yields are obtained from Bloomberg’s BVAL model, and the Treasury yields are obtained from the Gürkaynak, Sack, and Wright data set. See Refet S. Gürkaynak, Brian Sack, and Jonathan H. Wright, 2006, “The U.S. Treasury yield curve: 1961 to the present,” Finance Economics and Discussion Series, Board of Governors of the Federal Reserve System, No. 2006-28, June. Crossref
12 This is done by setting to zero all the coefficients that pertain to the Fed announcements in our baseline regression and plotting the resulting fitted values.


