

As the U.S. economy remains weakened by the Covid-19 pandemic, concern persists for the health and resilience of the municipal bond market. Municipal bonds (muni bonds) are debt securities issued by state and local governments to raise money and are generally considered to be safe investments. However, the recent slowdown in economic activity due to Covid-19 created significant stress on state and local government budgets, leading to a heightened risk for municipal bond downgrades and possibly even defaults.1 In this Chicago Fed Letter, we examine to what extent property and casualty (P&C) and life insurance companies, which are among the largest direct institutional investors in the municipal bond market, are vulnerable to a significant downturn in the muni bond market.
P&C and life insurers owned $453 billion in munis or roughly 11% of the municipal bond market as of year-end 2019.2 Besides the typical portfolio losses associated with bond downgrades and defaults, insurers also face an added risk to their capital reserves. In particular, because of the uncertain nature of insurance liabilities, insurers are statutorily required to maintain a sufficient amount of capital in case their assets are insufficient to pay claims in a timely manner. As the assets they hold become riskier, the minimum amount of capital these firms are required to hold increases. On average, P&C and life insurers hold muni bonds equivalent to 30% and 45% of their respective capital stock. In the unlikely event that the municipal bond market experiences stress that translates into substantial downgrades or defaults, insurers’ statutorily required capital could increase at the same time that their actual capital decreases.
In this article, we assess the role of insurers in the municipal bond market and their potential exposure to Covid-19-related municipal bond losses. While widespread downgrades and defaults are not expected for municipal bonds, for the purpose of this exercise we consider a hypothetical tenfold increase in the historic municipal default rate. We find that even in the event of an unprecedented level of municipal defaults, insurers should have sufficient capital to easily absorb their losses.
The potential impact of Covid-19 on the municipal bond market
The coronavirus pandemic and the related economic slowdown are expected to cause a persistent drag on state and municipal tax revenues, which may apply pressure to the municipal bond market. Current estimates from the Brookings Institution suggest that, relative to 2019 tax receipts, state and local general revenues will decrease by $155 billion in 2020, $167 billion in 2021, and $145 billion in 2022—or by about 5.5%, 5.7%, and 4.7%, respectively.3 These estimated declines are in line with those experienced during the Great Recession of 2008–09, which averaged 5.8%.4 States face additional budgetary pressures from increased expenditures related to the pandemic, particularly from increased payouts of unemployment insurance (UI) benefits. Between March and October 2020, states paid a record $125.1 billion in UI benefits. The UI benefits paid thus far in 2020 are 30% more than the $96.3 billion in benefits states paid in all of 2009.5 However, states are better positioned to weather these budget stresses than they were prior to the Great Recession due to the increase in state revenue stabilization funds, commonly referred to as “rainy day funds.” At the start of 2020, the median state rainy day fund was equal to 7.8% of state general revenues, compared with 4.6% at the start of 2008.6 This should provide some cushion for the expected decline in revenues due to Covid-19.7 And the second Covid-19 stimulus package signed into law at the close of 2020 is expected to help stabilize state and local budgets and ease stress on municipal bond markets, although direct aid to states and municipalities was removed from the final bill. The bill does provide direct payments to individuals of up to $600, paycheck protection loans for businesses, extended federal UI benefits, $30 billion for vaccine distribution and testing, $54.3 billion for K–12 schools, $22.7 billion for higher education, and $45 billion for transportation-related relief spending. President Joe Biden is proposing $1.9 trillion in additional stimulus spending focused on vaccine distribution, aid to states, and direct benefits to individuals. However, this plan has yet to be enacted and is therefore subject to change. In summary, states and localities are likely to experience significant variation in Covid-19-related revenue declines, and their budgetary strength also varies. As such, certain muni bonds may face downgrades and default.
While muni bond defaults have been historically rare, they have become more frequent over the last two decades and peaked—still at a relatively low level—following the 2008 financial crisis. Muni bond default rates are historically lower than those for comparable corporate bonds, in part because under Chapter 9 of the U.S. bankruptcy code state governments are not allowed to declare bankruptcy. This means that general obligation bonds, which are backed by the general tax revenue of the issuing entity, cannot default if issued by states. However, general obligation bonds, when issued by municipalities such as cities and counties, can default as the issuing entities are not constrained under Chapter 9. Muni bonds can also take the form of revenue bonds, which are backed by such specific revenue streams as highway tolls, utility fees, or higher education tuition payments. Under the revenue bond structure, income from the municipal or state enterprise is put toward a revenue fund. Operations and expenses are paid for first and then bondholders receive their payments. If the enterprise does not generate enough revenue to cover operational expenses, then the revenue bond, whether issued by a state or municipal enterprise, may default.
The high-profile general obligation bond defaults by Detroit, Michigan, in 2013 and Puerto Rico in 2016 were the largest municipal defaults in history with $8.4 billion and $73 billion in debt, respectively. These defaults were more of an exception, as most municipal bond defaults occur among revenue bonds issued by competitive enterprises. Between 1970 and 2016, general obligation defaults have been rare but large, accounting for only 20.4% of defaults but 76.8% of the default dollar amount. Revenue defaults, including municipal utilities and competitive enterprises, are more frequent but smaller in volume, accounting for 79.6% of defaults but only 23.2% of default dollar amount.8 Even with this recent increase in defaults, municipal bonds still default at lower rates than comparable corporate bonds. In total, municipal bonds have a five-year cumulative default (CDR) rate of less than 0.08%, compared with 6.72% for global corporate bonds. Among municipal bonds, general obligation and municipal utility bonds have significantly lower five-year CDRs of .02% and .04%, respectively, compared with 0.38% for competitive enterprises.9
Not only are revenue declines caused by the pandemic expected to vary across states, they are also expected to vary across sectors. This means that certain revenue bonds that rely on dedicated revenue streams affected by the pandemic, such as hospital, higher education, and tourism bonds, may face greater risks than city and county bonds backed by general tax revenues or municipal utility revenues. To assess the potential impact of pandemic-related economic declines on insurers, we consider their exposure to municipal bonds generally and their exposure to bonds in states and municipalities with relatively large anticipated tax revenue declines in fiscal year 2021, as well as their exposure to muni bond sectors that may face pandemic-related losses.
1. Insurer and municipal bond market comparison 2019 year-end
| Market | P&C insurers | Life insurers | |
|---|---|---|---|
| Percent of muni market | 100 | 6 | 5 |
| Total (billions of dollars) | 4,140 | 263 | 190 |
| General obligation bonds (%) | 33 | 53 | 42 |
| Revenue (%) | 67 | 47 | 58 |
| Ratings (%) | |||
| AAA | 17 | 25 | 17 |
| AA | 56 | 61 | 62 |
| A | 19 | 11 | 16 |
| BBB | 6 | 3 | 4 |
| < BBB | 2 | 1 | 1 |
| Municipal bond sectors (%) | |||
| School district | 21 | 32 | 25 |
| Public transit | 11 | 8 | 14 |
| Public utilities and sewers | 31 | 18 | 18 |
| Hospitals | 8 | 4 | 5 |
| State government | 8 | 14 | 13 |
| Local government | 18 | 15 | 15 |
| Other | 2 | 9 | 11 |
Sources: Thomson Reuters Eikon, Standard & Poor’s, Securities Industry and Financial Markets Association (SIFMA), and authors’ calculations.
Insurance exposure to municipal bonds
In general, insurers’ muni bond portfolios appear marginally safer than the overall municipal bond market. In terms of ratings, 86% of P&C insurers’ and 79% of life insurers’ muni bond holdings have an AA or AAA rating, compared with 73% for the market as a whole (see figure 1). Additionally, since March 2020 increases in risk spreads against comparable corporates have been largest for A- and BBB-rated bonds, where insurers also have less exposure than the market.
To assess insurers’ exposure to potential Covid-19-related losses, we examine muni bond holdings of issuers in states with anticipated 2021 revenue declines of at least 15%. Municipal bonds in states with larger revenue declines are more likely to face downgrades or defaults than those with less-affected revenues. Since we do not have estimates of the impact of Covid-19-related revenue declines for cities and counties, we use estimated state government revenue declines as a proxy for all municipal revenue declines in the state.
In total, 15 states expect revenue declines of 15% or more for fiscal year 2021.10 For our analysis, we assume municipalities and state revenue bonds in these states are most likely to run into trouble, but our results are robust to alternative assumptions.11 We find that 69% ($121.2 billion) of P&C and 70% ($107.5 billion) of life insurers’ muni bond investments come from states with estimated revenue declines of 15% or more. Within these 15 states, insurers’ investments are primarily at the municipal rather than state level, with city/county/municipality bonds accounting for 71% of life insurers’ and P&C insurers’ investments. Municipal governments and municipal or state enterprises, unlike state governments, can legally default. Therefore, such securities may be at risk for nonpayment, which could potentially lead to rating downgrades or defaults, similar to those that occurred after the 2008 financial crisis. On the other hand, as we mentioned earlier, states and municipalities currently have relatively large rainy day funds and are in a better position to weather declines in tax revenue than they were prior to the 2008 financial crisis.
2. Municipal bond index spreads by sector and type
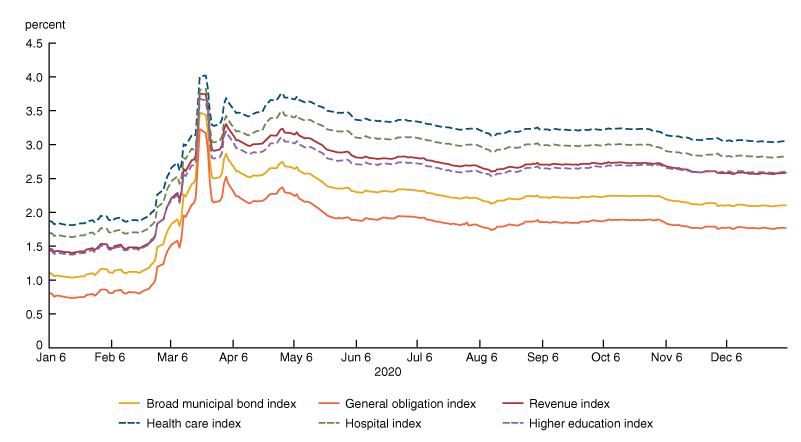
Next, we consider the effects of insurers’ exposure to the following municipal bond sectors that may experience significant declines in revenues because of the Covid-19 pandemic: higher education, hospitals and health care, and recreation and tourism. In figure 2, we see that municipal bond spreads spiked on March 23, 2020, during a period of market turmoil following the announcements of lockdowns and other measures to limit the impact of the emerging health and economic crisis. Since late March, municipal bond spreads have remained elevated and the municipal revenue bond index has remained well above the general obligation bond index, evidencing greater risk in the revenue bond sector.
Higher education (life insurers’ exposure, $29.2 billion; P&C insurers’ exposure, $30.6 billion)
Most higher education institutions will face declines in tuition, housing, and other revenues due to campus closures and decreased enrollment. Additionally, public education institutions may be at risk for declines in appropriations, especially in financially distressed states anticipating large revenue declines. Highly rated institutions with strong demand will face less pressure than smaller and less well-known institutions that may struggle to attract students. Insurers appear well-positioned in this regard as 83% of P&C insurers’ and 88% of life insurers’ higher education municipal bonds are with state colleges or universities, of which 97% of P&C holdings and 95% of life insurers’ holdings are rated A or better. However, the majority of these are revenue bonds (65% of P&C insurers’ and 71% of life insurers’) and so some defaults are possible. The remainder of insurers’ higher education municipal bonds are from community colleges and smaller institutions, but 75% of these investments are general obligation bonds that are not dependent on revenue from tuition or other sources, which makes defaults of these muni bond holdings less likely.
3. Insurers’ “at-risk” municipal bonds
| State revenue decline >15% | Local revenue decline >15% |
Higher education |
Hospitals and health care | Tourism and recreation | |
|---|---|---|---|---|---|
| P&C insurers (%, except total) | |||||
| AAA to A | 87.0 | 97.6 | 97.0 | 90.0 | 95.0 |
| BBB | 10.9 | 1.9 | 3.0 | 8.0 | 4.0 |
| High yield | 2.1 | 0.5 | 0.0 | 2.0 | 1.0 |
| Total (billions of dollars) | 37.3 | 83.9 | 25.5 | 11.1 | 3.0 |
| Percent revenue | 40.0 | 37.0 | 65.0 | 89.0 | 45.0 |
| Percent of total | 4.2 | 31.9 | 9.7 | 4.2 | 1.1 |
| Life insurers (%, except total) | |||||
| AAA to A | 85.1 | 97.8 | 99.0 | 87.0 | 97.0 |
| BBB | 13.3 | 1.9 | 1.0 | 8.0 | 2.0 |
| High yield | 1.6 | 0.3 | 0.0 | 4.0 | 1.0 |
| Total (billions of dollars) | 32.2 | 75.2 | 25.7 | 8.9 | 5.0 |
| Percent revenue | 42.0 | 51.0 | 71.0 | 78.0 | 68.0 |
| Percent of total | 17.0 | 39.7 | 13.5 | 4.7 | 2.6 |
Hospitals and health care (life insurers’ exposure, $8.9 billion; P&C insurers’ exposure, $11.2 billion)
Hospital and health care facilities, which account for 4.7% of life insurers’ and 4.2% of P&C insurers’ municipal bond holdings, suffered revenue losses after non-emergency and elective procedures were canceled at the onset of the pandemic and Covid-19-related revenues did not rise enough to fill the gap. While hospital restrictions on elective procedures were eased during the late summer and early fall, which allowed hospitals to recoup some lost revenues, the second wave of the pandemic is once again forcing hospitals to cancel elective procedures, which may cause further strain on their budgets. The CARES Act stimulus provided states and health care facilities with much-needed support; however, the second Covid-19 stimulus bill only provides funding for coronavirus response, including vaccine distribution, but not direct fiscal support to hospitals and health care facilities. While widespread ratings’ downgrades are not expected, some could occur. As such, insurers may face some downgrades or losses as their hospital and health care municipal bonds primarily depend on health care revenue and are lower rated than their overall portfolio (see figure 3).
Recreation, tourism, and convention centers (life insurers’ exposure, $5.0 billion; P&C insurers’ exposure, $3.0 billion)
Sectors that rely on tourism and gatherings of large crowds, such as convention centers, have witnessed strong declines in their revenue. As travel restrictions continue and large gatherings remain unsafe, it is likely that revenues related to such bonds will continue to drag in the coming months until significant portions of the population are vaccinated.12 Overall, tourism-related bonds only represented 1.1% of P&C insurers’ and 2.6% of life insurers’ muni portfolios in 2020. So even though the majority of these tourism bonds are revenue bonds and therefore subject to default risk, their overall contribution to insurers’ asset risk remains relatively small.
The potential impact of Covid-19 on insurer capital
Next we consider how insurer capital would be affected if stresses related to the Covid-19 pandemic led to a tenfold increase in historical municipal downgrade and default rates for bonds from “at-risk” sectors and in states with anticipated revenue declines of 15% or more. A tenfold increase in muni defaults from their historical average is much larger than what was seen in any recent recession, including the Great Recession, so it serves as a sort of upper bound on potential losses for insurers. Our worst-case scenario estimate is closer in line to actual municipal bond losses during the Great Depression, in which 1.7% of outstanding municipal bonds defaulted without recovery.13 P&C insurers have an estimated $143.4 billion in bonds from at-risk sectors and states, while life insurers have $124.8 billion. When bonds are downgraded, insurers may be required to hold additional capital and to increase capital significantly when bonds fall below a BBB rating. A tenfold increase in one-year downgrade rates would lead to $4.7 billion of P&C insurers’ and $4.5 billion of life insurers’ at-risk bonds being downgraded. These downgrades would require P&C and life insurers to hold an additional $42 million and $110 million in capital, respectively.
In terms of default, a tenfold increase in credit-adjusted default rates applied to at-risk bonds would lead to $770 million in losses for P&C insurers and $710 million in losses for life insurers, equivalent to 0.1% of P&C and 0.2% of life insurers’ capital. If applied to the entirety of insurers’ municipal bond portfolios, this shock would still only produce $1.1 billion in losses for both P&C and life insurers. Additionally, a large portion of these losses would eventually be recovered by insurers after the bonds default, as historical recovery rates for municipal bonds are near 66%. In summary, even an unprecedented tenfold increase in municipal downgrades and defaults would be unlikely to have a significant impact on insurer capital and solvency.
Conclusion
Insurers are among the largest institutional investors in the municipal bond market and are likely to remain important investors in the near future. The Covid-19 pandemic has led to declines in current and anticipated future municipal and state tax revenues, which has stressed municipal bond markets. While widespread downgrades and defaults are not expected, the impact of Covid-19 revenue-related stresses are likely to vary across jurisdictions and sectors, depending on the size of the revenue declines and the financial strength of the issuing entities. However, insurers’ municipal bond holdings are primarily rated AA or above, with an overall credit quality stronger than average. And even in the event of a (very unlikely) tenfold increase in the historical municipal default rate, P&C and life insurers’ capital would decline by just 0.1% and 0.2%, respectively, leaving both insurance sectors with sufficient capital to easily absorb losses in the event of further market disruptions.
Notes
1 For example, in May the City of Chicago announced an expected $838.2 million budget deficit driven by Covid-19-related revenue losses, while the State of Illinois is anticipating federal aid and borrowing from the Federal Reserve’s Municipal Lending Facility to close its $7.4 billion spending gap in a recently proposed budget. See Shruti Singh, 2020, “Illinois passes $40 billion budget counting on federal help,” Bloomberg, May 24, available online.
2 All calculations and analysis of insurance company municipal bond holdings in this article are based on year-end 2019 data.
3 Louise Sheiner and Sophia Campbell, 2020, “How much is COVID-19 hurting state and local revenues?,” Up Front, Brookings Institution, Hutchins Center on Fiscal and Monetary Policy, blog, September 24, available online.
4 Shelby Kerns, 2020, “State revenues decline for first time since the Great Recession, with the worst still to come,” Budget Blog, National Association of State Budget Officers, September 8, available online.
5 Data from the U.S. Department of Labor Unemployment Insurance database.
6 National Association of State Budget Officers, 2020, “Summary: Spring 2020 Fiscal Survey of States,” issue brief, Washington, DC, June 25, available online.
7 Jared Walczak and Janelle Cummings, 2020, “State rainy day funds and the COVID-19 crisis,” Fiscal Fact, Tax Foundation, No. 703, April, available online.
8 Moody’s Investors Service, 2017, US Municipal Bond Defaults and Recoveries, 1970–2016, data report, New York, June 27, available online.
9 Moody’s Investors Service (2017); and Adam Stern, 2020, “COVID-19 and muni credit: Essential service municipals are more resilient than appreciated,” Insights, Breckinridge Capital Advisors, May 6, available online.
10 Center on Budget and Policy Priorities, 2020, “States grappling with hit to tax collections,” report, Washington, DC, updated November 6, available online; states with expected 2021 revenues of 15% or greater include Alaska, California, Colorado, Hawaii, Kentucky, Massachusetts, Nevada, New Hampshire, New Jersey, New Mexico, New York, Oklahoma, Texas, Washington, and Wyoming.
11 It would be better to use municipal- or revenue stream-based estimates of declines, but these are not generally available.
12 Moody’s Investors Service, 2020, “Revenue mix and economic diversity will determine coronavirus’ impact on US local governments’ credit,” press release, New York, June 10, available online.
13 Cadmus Hicks, 2020, “Municipal bond defaults: depression, recession and pandemic,” Nuveen, opinion piece, May, available online. Hicks (2020) states: “From 1929 to 1937, the principal amount of bonds that went into default was equal to about 7% of the average amount of debt outstanding in the early 1930s.”


