

The Covid-19 pandemic and associated recession have had dramatically different effects across industries, with some, including large parts of the leisure and hospitality sector, truly devastated and others, like much of the manufacturing sector, able to recover quite quickly. This has led some analysts to describe the pandemic as a reallocation shock, requiring substantial movement of labor across industries.1 Such a process likely requires substantial time, during which the natural rate of unemployment may be elevated. In this Chicago Fed Letter, we consider two questions: First, has the need for labor reallocation risen, and second, has there been an increase in the amount of reallocation that is actually occurring?
On the first question, we find that one indicator of needed reallocation, the correlation across industries between unemployment and job vacancies, has fallen in a manner consistent with the need for greater reallocation. However, that result is due nearly entirely to what happened to leisure and hospitality. Outside of that sector, there has been little change in the correlation of unemployment and vacancies. Thus, whether one should expect a long-run need for extensive reallocation depends heavily on one’s views of whether leisure and hospitality will recover quickly as pandemic concerns lessen and the industry resumes its steady 70-year increase in its share of U.S. employment.
On the second question, we find that actual worker reallocation has not increased to any meaningful extent. Unemployed workers have not been any more likely to move to new industries than they were before the pandemic. Nor have unusual numbers of those employed in heavily impacted sectors been leaving jobs for healthier industries.
The possible need for worker reallocation
One sign that Covid might have increased the need for labor reallocation is the fact that even while unemployment rose substantially, firms reported an increase in job openings, the opposite of what normally happens in a recession. As figure 1 shows, the unemployment rate increased to almost 15% in April of last year and even a year later remains 2.5 percentage points above pre-pandemic levels.2 However, the figure also shows that after an initial drop in the early months of the pandemic, the job openings rate from the Job Openings and Labor Turnover Survey (JOLTS), rose above pre-pandemic levels by July 2020 and most recently was at an all-time high. That is, even though unemployment is still quite elevated, employers said that they have an unusually high number of job openings (vacancies).3
1. Unemployment and vacancies
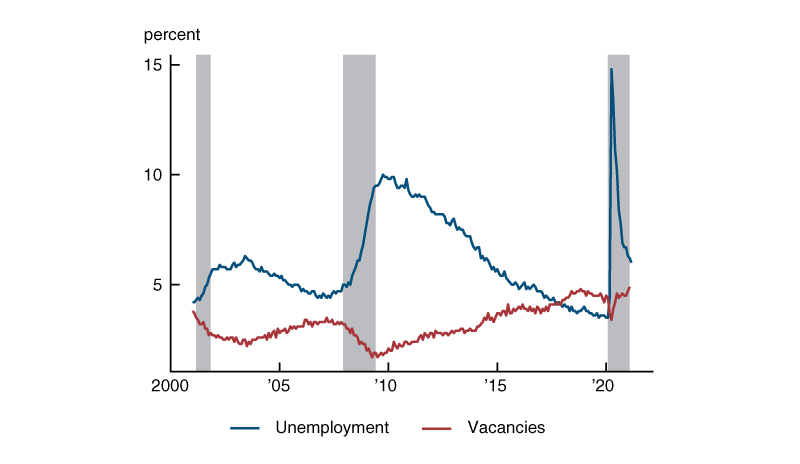
Sources: U.S. Bureau of Labor Statistics, Job Openings and Labor Turnover Survey, and Current Population Survey, from Haver Analytics.
The last time vacancies increased at the same time unemployment was very high was in 2010, and it led a number of analysts and policymakers to raise concerns over a possible increase in structural unemployment. The worry was that it wasn’t simply an overall lack of labor demand that had pushed unemployment higher, but also that the workers who were unemployed were in some way unsuitable for the jobs that were available. The steady decline in unemployment after 2010 to very low levels just before the pandemic strongly suggests that the feared long-run increase in the natural rate of unemployment did not occur. However, the Congressional Budget Office (CBO) did raise its estimate of the short-run natural rate by as much as a percentage point during the 2007–09 recession and immediately afterward.
In a sense, unemployment and vacancies have recently been sending conflicting signals about the state of the labor market. The increase in unemployment in 2020 reflects, of course, a dramatic deterioration in job-finding conditions for workers. Normally when that happens, firms find hiring to be easier. However, the increase in vacancies suggests that hiring has actually gotten harder for firms, at least on average.4 Economists often summarize overall conditions in the labor market with a measure known as labor market tightness, which is the ratio of job openings to unemployed workers. This measure, which is shown in figure 2, essentially gives equal weight to workers’ ability to find jobs and firms’ ability to find workers. As can be seen in the figure, labor market tightness dropped very sharply with the onset of Covid and has recovered somewhat less than half of the way back to its previous high. It is worth noting, however, that the level of tightness did not drop as low in 2020 as it did in 2009. This is in contrast to what happened with the unemployment rate, whose peak in 2020 was considerably higher than in 2009 (see figure 1).
2. Overall labor market tightness
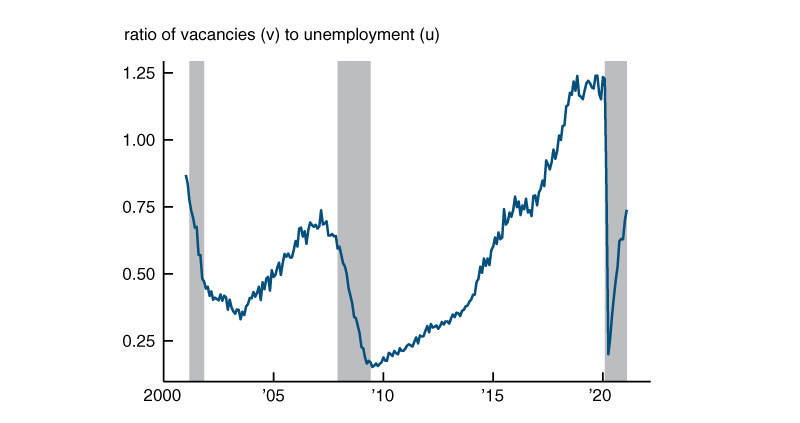
Sources: U.S. Bureau of Labor Statistics, Job Openings and Labor Turnover Survey, and Current Population Survey, from Haver Analytics.
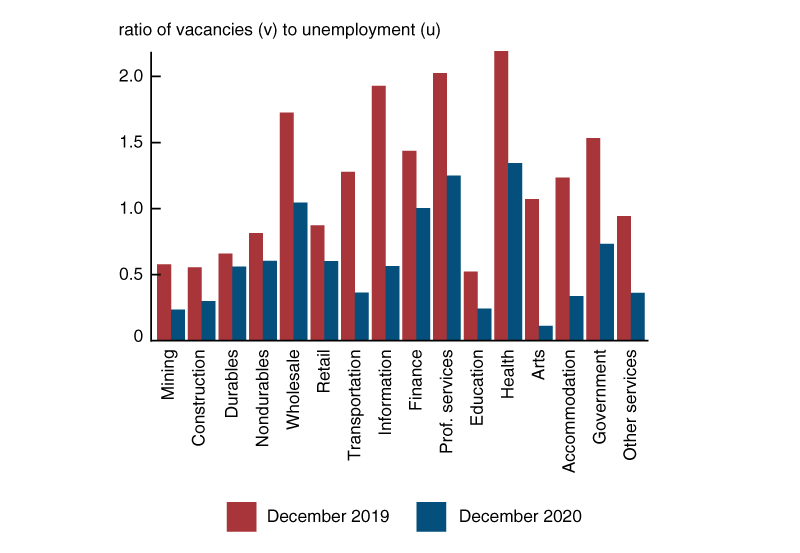
As we noted previously, conditions have varied greatly by industry. This divergence is reflected in figure 3, which shows the ratio of vacancies to unemployment separately for 16 industries. As the figure illustrates, industries differ significantly in their current levels of labor market tightness and by how much deterioration has occurred since before the pandemic. In particular, labor markets in the two leisure and hospitality industries (arts and entertainment and accommodations, food services, and lodging) have seen very large declines, while the two manufacturing industries (durables and nondurables) are only modestly less tight than at the end of 2019. The relatively small drops in tightness for manufacturing labor markets are consistent with anecdotal reports from manufacturers that they find it difficult to hire qualified workers.5
3. Labor market tightness by industry
A simultaneous increase of unemployment and vacancies, such as the one that occurred in 2020, is sometimes taken as evidence of a decrease in the efficiency with which workers are matched with job openings. That is, it is consistent with fewer matches being formed for a given number of unemployed workers and job openings. There are at least two reasons why search efficiency might have declined. One is that it may simply be more difficult to search during a pandemic. The other is a mismatch between the characteristics of unemployed workers and those of the job openings.
One simple indicator of mismatch is the correlation across industries at a point in time in the shares of the unemployed and job openings. When the unemployed are well matched to job openings, those industries contributing a greater share of unemployed workers also have a greater share of job openings. Thus, this correlation should be close to one. Lower values of the correlation represent greater mismatch.6
As the red line in figure 4 shows, the correlation of unemployment and vacancies dropped markedly after the onset of the Covid-19 pandemic and remains below the levels of 2019. The drop in the correlation, though not as dramatic as in 2008–09, suggests an increase in mismatch, that, if persistent, could be associated with an increased need for long-run work reallocation and an increase in the natural rate of unemployment.
4. Cross-industry correlation of unemployment and job openings shares
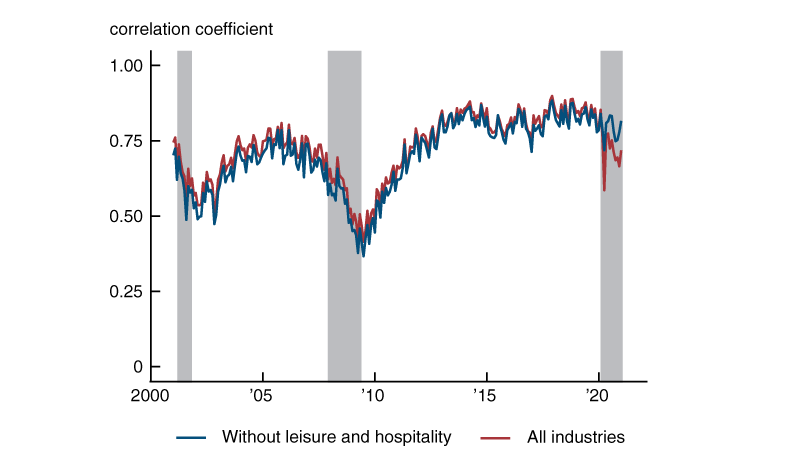
Sources: U.S. Bureau of Labor Statistics, Job Openings and Labor Turnover Survey, and Current Population Survey, from Haver Analytics.
However, most of the increase in mismatch is due to the particularly bad outcomes in leisure and hospitality. Taking the two leisure and hospitality industries out of the correlation, as in the blue line in figure 4, there is relatively little decline in the correlation.7 Thus, the interpretation of these results depends a great deal on what one expects to happen to leisure and hospitality after concerns about Covid dissipate. If the industry quickly returns to its old levels of employment, many workers displaced from it may be able to find new jobs without switching industries. Given leisure and hospitality’s steady increase in the share of U.S. employment over the last 70 years,8 this seems quite likely to us. Still, it is, of course, possible that the pandemic will bring about fundamental changes in the economy that break the long-running trend toward a greater share of employment in the sector, in which case difficult and long-running reallocation may be necessary.
Actual worker reallocation
Next, we look at workers’ labor market transition rates using the panel structure of the Current Population Survey (CPS). This exercise provides evidence on the extent to which worker reallocation across industries is actually occurring. More specifically, we compute transition rates over the three-month period between surveyed workers’ first (month one) and last (month four) interviews in a given CPS rotation. We look at transitions between major employment statuses (employed, unemployed, and out of the labor force) by initial industry. Given the current importance of the leisure and hospitality sector as discussed above and ongoing attention to manufacturers’ reports of difficulty finding workers, we adopt a simple three-sector breakdown of industries—leisure and hospitality, manufacturing, and all others. In order to reduce noise in the data, we show seasonally adjusted, seven-month centered moving averages of transition rates.9
Figure 5 shows transition rates from employment in each of the three industry groups to nonemployment, either unemployment or being out of the labor force. The three panels are organized by the sector of employment in month one. Red lines represent the share of workers in an industry that move into unemployment in month four, and blue lines represent the share of workers that move out of the labor force in month four. Regardless of initial sector, transitions from employment to unemployment peaked early in the pandemic, have declined substantially since, but remain higher than before the pandemic. Not surprisingly, the effect on the leisure and hospitality sector is especially sharp, particularly compared with the industry’s benign experience during the 2007–09 recession. Workers initially employed in leisure and hospitality were also significantly more likely to drop out of the labor force when Covid-19 hit the economy.
5. Employment to nonemployment transitions, by initial industry
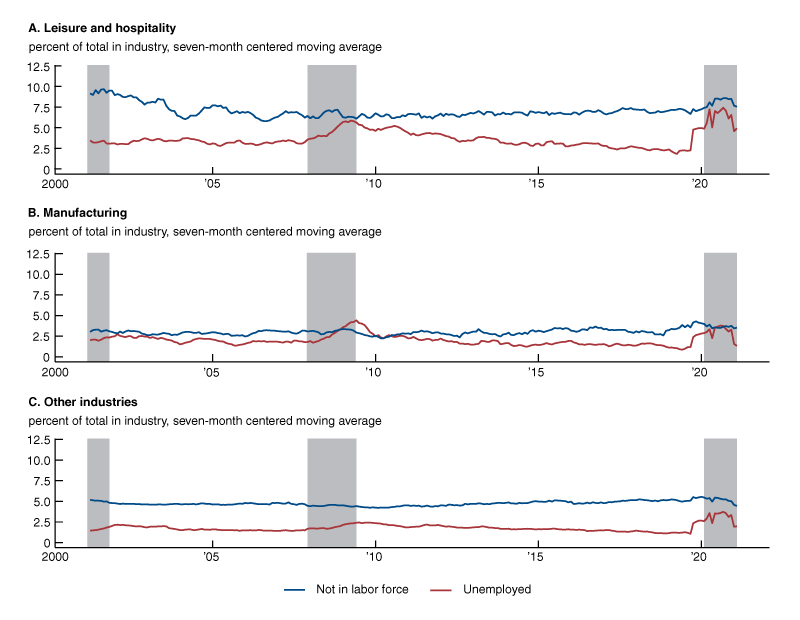
Source: Authors’ calculations based on data from the U.S. Bureau of Labor Statistics, Current Population Survey.
Figure 6 shows the rate at which unemployed workers who lost jobs in the three sectors were able to transition to employment in their old sector. Perhaps the most notable result is that during the pandemic period, unemployed manufacturing workers have been transitioning back to employment in manufacturing jobs at a higher than normal rate. This likely reflects historically high usage of temporary layoffs in the early Covid period.10 By contrast, the share of formerly leisure and hospitality and other industry unemployed workers who return to their same industry is reasonably steady relative to pre-pandemic (2017–19) levels.
6. Unemployment to employment within the same industry, by industry
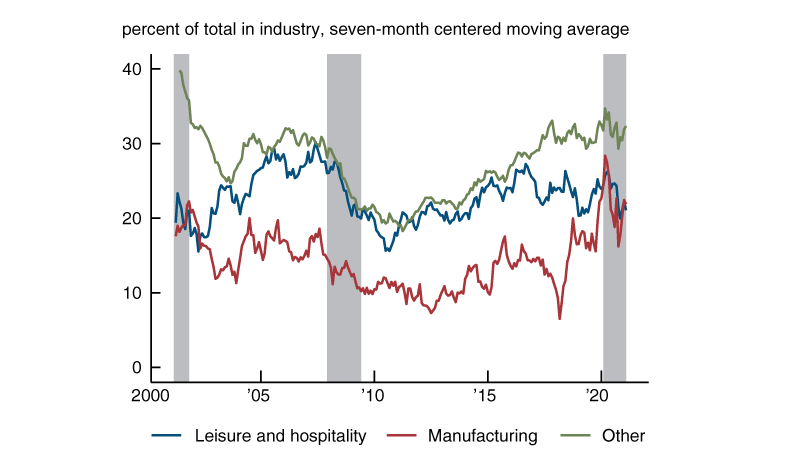
Source: Authors’ calculations based on data from the U.S. Bureau of Labor Statistics, Current Population Survey.
Figure 7 shows the rates at which unemployed workers in the three industry groups transition to employment in the other sectors. The panels are organized by month one industry (i.e., when they are unemployed) and the colors represent the month four industry (when they are employed). Despite high unemployment in the leisure and hospitality sector, there has been no pickup in the rate at which the sector’s unemployed workers transition to jobs in manufacturing or other industries. Despite the relative strength of manufacturing, transitions into manufacturing (red lines) remain rare; almost no one moves from leisure and hospitality into manufacturing. One can, however, note a small decline in the rate at which those unemployed from other sectors transition to jobs in leisure and hospitality (blue lines).
7. Unemployment to employment in a different industry, by initial industry
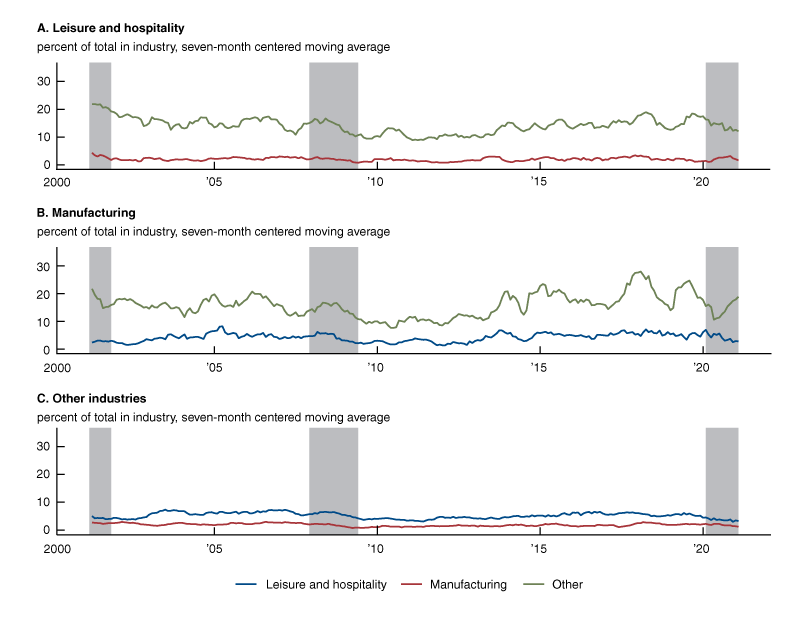
Source: Authors’ calculations based on data from the U.S. Bureau of Labor Statistics, Current Population Survey.
In an accompanying online appendix (see note 3), we also show that the rate of industry switching among employed workers—in particular, employed leisure and hospitality workers moving to manufacturing or other industries—has not been unusual during the last year. Unsurprisingly, switching into leisure and hospitality is low, however.
But overall, there has not been a notable change in the rate at which workers are moving to other industrial sectors. This is despite the fact that labor market conditions in leisure and hospitality are noticeably worse than in other industries, in particular manufacturing. One can imagine several possible reasons for the lack of an increase in labor reallocation from leisure and hospitality to manufacturing. One is that the requirements of jobs in manufacturing may be significantly different than those in leisure and hospitality. Another is that manufacturing jobs may offer less flexible schedules than workers in leisure and hospitality may desire. If reasons such as these are why so few transitions are taking place and worker reallocation will actually be required in the long run, then the process is likely to be an extended one. However, another possibility, consistent with the very long-running and consistent growth of the sector, is that the current difficult conditions in leisure and hospitality are perceived by workers and firms to be temporary. As the pandemic comes to an end, workers expect to return to their jobs or find similar jobs. Thus, a transition to other industries like manufacturing may not be necessary, especially given relatively generous support from unemployment insurance. In addition, firms in manufacturing and other industries may not want to train workers for jobs that they might not want to remain in long term.
Conclusion
The Covid-19 pandemic has had dramatically different effects across industries, and this has led to a potential need for some workers to leave heavily impacted sectors for healthier industries with plenty of job openings. However, the need for this reallocation is due nearly entirely to what happened in the leisure and hospitality sector. Therefore, whether there is a long-run need for extensive job reallocation depends heavily on one’s views of whether leisure and hospitality will recover quickly as pandemic concerns lessen. Moreover, unemployed workers have not been any more likely to move to new industries than they were before the pandemic. Nor have unusual numbers of those employed in heavily impacted sectors been leaving jobs for better-performing industries. This behavior is consistent with workers and firms expecting a relatively quick bounce back of employment in leisure and hospitality, in which case reallocation should not be a significant concern holding back labor markets going forward.
Notes
1 For example, see Jose Maria Barrero, Nick Bloom, and Steven J. Davis, 2020, “COVID-19 is also a reallocation shock,” University of Chicago, Becker Friedman Institute for Economics, working paper, No. 2020-59, June, available online.
2 Moreover, this is the traditional U-3 unemployment rate, which understates the extent of unemployment by not including those who have left the labor force because of the pandemic or have been misclassified as employed but are really unemployed. See Jerome H. Powell, 2021, “Getting back to a strong labor market,” Federal Reserve Board Chair’s speech for the Economic Club of New York, via webcast, February 10, available online.
3 For more on this survey, see U.S. Bureau of Labor Statistics’ JOLTS webpage, available online, https://www.bls.gov/jlt/. The relationship between the unemployment and vacancy rates is sometimes referred to as the Beveridge curve. See the accompanying online appendix.
4 Of course, it is also possible that the vacancy measure was affected in other ways. See Steven J. Davis, R. Jason Faberman, and John C. Haltiwanger, 2013, “The establishment-level behavior of vacancies and hiring,” Quarterly Journal of Economics, Vol. 128, No. 2, May, pp. 581–622. Crossref
5 For example, see Board of Governors of the Federal Reserve System, 2021, Beige Book, report, Washington, DC, February, p. A-1, available online.
6 The ability of the correlation to capture mismatch can be shown in some search models of the labor market in which industry matches are a Cobb-Douglas function of industry unemployment and vacancies. See Ayşegül Şahin, Joseph Song, Giorgio Topa, and Giovanni L. Violante, 2014, “Mismatch unemployment,” American Economic Review, Vol. 104, No. 11, November, pp. 3529–3564. Crossref
7 For similar results using a different reallocation measure, see Joel M. David, 2021, “Has Covid-19 been a ‘reallocation recession’?,” Chicago Fed Letter, Federal Reserve Bank of Chicago, No. 452, March. Crossref
8 In 1953, leisure and hospitality accounted for 7% of private payroll employment; by 2019, that share had risen to 12.9%. Between 1953 and 2019, the only two-year period during which this share fell was in the late 1990s.
9 The figures report transitions as a share of the initial population—e.g., the share of workers employed in leisure and hospitality in June 2020 who are in manufacturing in September 2020. All measures are seven-month centered moving averages, weighted using CPS weights. In some cases, the reported transition rates begin to move prior to the pandemic; however, this is an artifact of the seven-month centered moving average.
10 Over 10% of the labor force was on temporary layoff in April and May 2020. That share has fallen to around 1.5% to 2% between October 2020 and February 2021, not too far from historic highs in the 1970s and early 1980s. Since 1990, the average share of the labor force on temporary layoff is about 0.7%.


