

Many observers, including most Federal Open Market Committee (FOMC) participants in the June 16, 2021, Summary of Economic Projections,1 anticipate that the recent run-up in inflation in the United States will prove to be temporary, and annual inflation will be near the Fed’s target of 2% in 2022 and 2023. An important consideration for policymakers, however, is whether the private sector will similarly read the rise in inflation as temporary. That is, are long-run inflation expectations likely to remain anchored, or might the sharp rise in inflation cause long-run expectations to increase substantially as well?
In this Chicago Fed Letter, we consider a way of gauging how well anchored long-run inflation expectations might be based on how sensitive these expectations are to incoming news about short-term trends in consumer prices. The sensitivity measure we study varies more over time than the level of long-run inflation expectations, which has remained relatively stable since the mid-1990s.
The level of long-run inflation expectations
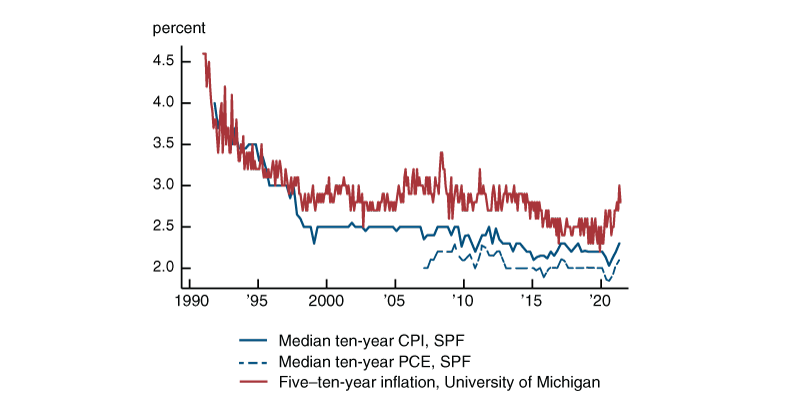
The usual evidence for anchoring comes from data on the level of long-run inflation expectations in surveys, both of professional forecasters and randomly sampled households. Figure 1 reports median long-run inflation forecasts from the quarterly Survey of Professional Forecasters (SPF) conducted by the Federal Reserve Bank of Philadelphia and the monthly Surveys of Consumers conducted by the University of Michigan (Michigan survey).2 Respondents in the SPF are asked to forecast inflation in the Consumer Price Index (CPI) and inflation in the Personal Consumption Expenditures (PCE) Price Index over the next ten years. Since the baskets used to measure CPI and PCE inflation are not exactly the same, the expectations of the two can differ.3 Respondents in the Michigan survey are asked to forecast price changes in the next five to ten years, without reference to any specific index. The CPI inflation forecasts in the SPF and the forecasts of overall price growth in the Michigan survey suggest three distinct regimes. First, long-run inflation expectations came down gradually during the 1990s. Next, starting around 1997, long-run inflation expectations settled at a constant level. Respondents in the SPF forecast CPI inflation at 2.5%, while households forecast a slightly higher rate of overall price growth. Finally, around 2007 in the SPF and around 2013 in the Michigan survey, inflation expectations started drifting down from their previous stable value. By the onset of the Covid-19 pandemic, expectations seem to have stabilized at a somewhat lower level than in the first decade of the 2000s. While the long-run expectations of inflation have ticked up recently, they are still at or slightly below their level back in the 2000s. The median forecasts of PCE inflation reported in the SPF, which are also reported in figure 1 and are only available starting from 2007, show no decline in expectations as the other two series do. The mean forecasts from both the SPF and the Michigan survey (not shown) behave similarly to the respective median forecasts.
1. Survey forecasts of long-run inflation
Another way of looking at inflation expectations
Economists have proposed alternative ways of measuring the degree to which long-run inflation expectations are well anchored beyond looking at their levels. One of these argues for measuring whether long-run expectations are sensitive to incoming news. The idea is that if long-run inflation expectations were anchored, they should not respond to incoming news that affects short-run inflation, at least not systematically.4 While median inflation expectations may appear relatively stable over time, as in figure 1, it need not follow that inflation expectations are insensitive to incoming news. As long as incoming news suggests only minor changes in inflation, long-run inflation expectations will appear largely unchanged even when they are sensitive to incoming news. Inflation expectations in that case could still change substantially in response to news suggesting more dramatic changes in inflation.
To measure the sensitivity of long-run inflation expectations, we can look at how these expectations co-move with short-run inflation expectations. That is, does the arrival of news that leads agents to update their expectations of inflation in the short run seem to also lead them to change their expectation of inflation in the long run? Here, we follow a similar approach to the one in Kumar et al. (2015), Dräger and Lamla (2018), and Candia, Coibion, and Gorodnichenko (2021)5 in looking at the coefficients from regressions of changes in long-run expectations on changes in short-run expectations for particular periods.
To help interpret the coefficients from these regressions, consider a simple stylized example. Suppose people anticipate inflation follows an autoregressive process with parameter $\rho$. If inflation were to rise by 1 percentage point (pp) this year, people would expect it to rise by $\rho$ pp next year, ${{\rho }^{2}}$ pp two years from now, and so on. If we asked survey participants for their expectations of average inflation over the next ten years, their answer would depend on $\rho$. Suppose people receive news that inflation over the next year will rise 1 pp. If $\rho$ were zero, meaning agents expect inflation to be unaffected beyond the current year, their expectation of average inflation over the next ten years should rise by 0.1 pp. Hence, a coefficient of 0.1 in our regression would correspond to the case where people don’t expect any change in inflation going forward and inflation expectations at long horizons are completely anchored. A regression coefficient above 0.1 would mean people anticipate that the higher rate of inflation over the next year would persist more into the future. Inflation expectations at long horizons in this case would be only partially anchored. For example, a regression coefficient of 0.4 would imply $\rho =0.77$, and that inflation five years out will be about 0.25 pp higher. In the extreme, a regression coefficient of 1 would imply $\rho =1$ and inflation expectations that remain elevated forever—expectations would be completely unanchored.
Time-series evidence
We begin with time-series evidence. Figure 2 reports the coefficients from rolling five-year regressions of the change between consecutive surveys in mean and median SPF forecasts of CPI inflation over the next ten years on the change in the mean and median SPF forecast for inflation over the next four quarters. The coefficient in quarter t corresponds to the coefficient from the regression using data over the next five years, i.e., between $t$ and $t + 20$.
2. Regression coefficient of $\Delta$ 10-year forecast on $\Delta$ 1-year forecast in aggregate SPF data
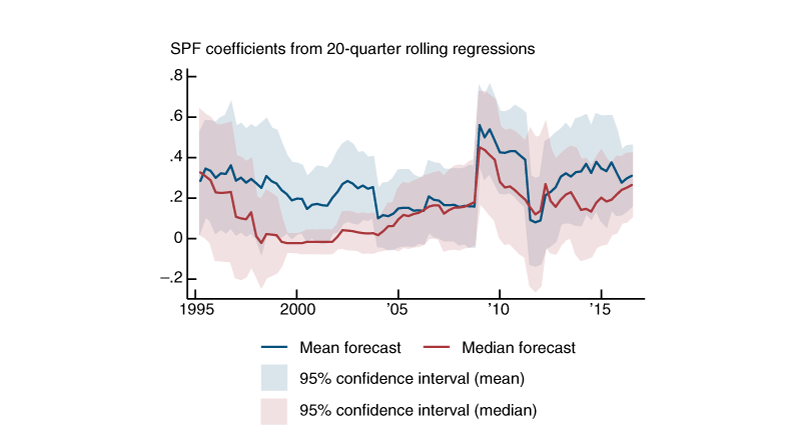
In the 1990s, as mean and median long-run forecasts of CPI inflation in the SPF were falling, the changes in mean and median long-run expectations became less synchronized with changes in the corresponding short-run expectations. Even before long-run inflation expectations had fully settled to a near-constant level, these expectations appear to have become more anchored in the sense of being less sensitive to news about inflation over the short run. However, unlike the stability suggested by the data on levels, the sensitivity of long-run inflation expectations did not remain low, and it eventually reverted to its levels of the mid-1990s. This increased sensitivity suggests there was a risk at the time that long-run inflation expectations could have moved significantly away from the level they had settled to, but the incoming news did not lead to big revisions in short-term inflation forecasts and the level of long-run inflation expectations remained relatively stable.
Figure 2 also reveals how the sensitivity of long-run inflation expectations can change quickly. The spike in the figure is driven by the fact that starting in 2009, long-run expectations started moving in tandem with short-run expectations. In contrast, in 2008 mean and median long-run expectations remained flat as short-term expectations fell 100 basis points. However, given the modest changes in short-run inflation expectations around 2009, this higher co-movement did not have much effect on the level of long-run expectations in figure 1.
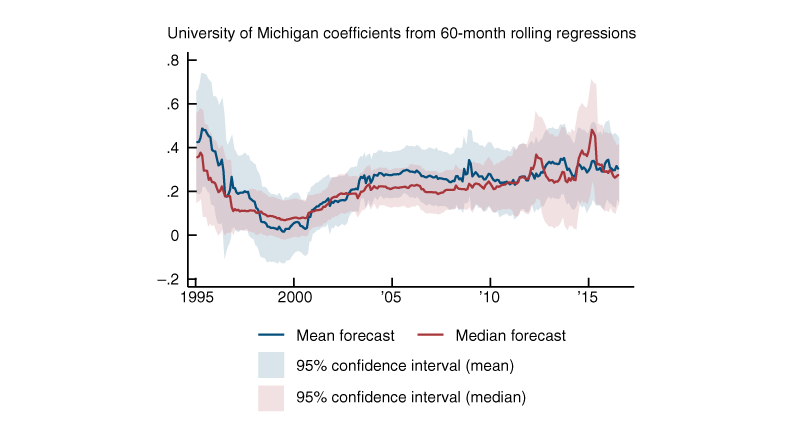
Figure 3 reports the results for the same exercise using inflation expectations from the Michigan survey. The overall pattern is qualitatively similar to what we find in the SPF: Long-run inflation expectations over the next five to ten years became less sensitive to news that moved short-run expectations in the early part of the sample as mean and median household expectations declined, but eventually became more sensitive to such news, at levels that are on par with the levels of sensitivity we observe in the first part of the sample.
3. Regression coefficient of $\Delta$ 5–10-year forecast on $\Delta$ 1-year forecast in aggregate Michigan survey data
Panel data evidence
A limitation of time-series regressions, such as those in figures 2 and 3, is that they may reflect spurious compositional effects. For example, if the composition of the sample shifts toward more bullish survey respondents, the mean long-run and short-run expectations would both rise even if long-run expectations for each respondent were well anchored. Likewise, the median long-run inflation and short-run expectations may correspond to different individuals.
Fortunately, both the SPF and the Michigan survey have a panel dimension that allows us to look at the changes in individual expectations. In principle, we could regress the changes in individual expectations from each survey and report the time series for the coefficients. However, since the number of respondents who can be tracked across surveys is limited, we smooth the results by pooling responses over three years of surveys. For regressions from the most recent data, the samples are necessarily truncated. Given their relevance, we report these results as well. (Coefficients based on these truncated samples with less than three years of observations are depicted with dashed lines.)
The regressions based on individual responses include time-fixed effects (dummy variables for each period included in the regression sample). As a result, these regressions rely on a distinct source of variation to identify the sensitivity of long-run expectations compared with the aggregate data underlying figures 2 and 3. To see this, suppose that each individual in the relevant survey receives a private signal about short-run inflation that only they observe. Averaging these signals would wash out the idiosyncratic variation in signals across individuals and retain only the common information about short-run inflation that moves all signals in the same direction. Since the time-series exercises in figures 2 and 3 look at how average (or median) long-run inflation expectations vary with average (or median) short-run inflation expectations, they capture only how the information that is common to all individuals affects both short-run and long-run expectations. The regressions ignore the idiosyncratic component of signals that individual survey respondents observe. By contrast, using individual data and including time-fixed effects to control for changes in the average across all respondents necessarily ignores any variation that is common to all, and instead identifies how the idiosyncratic component of the signals individuals receive affects both their short-run and long-run expectations. If the common component is not especially volatile during times of stable inflation but private signals are fairly disperse because individuals rely on very different sources in learning about inflation, the greater variation in individual data should allow us to measure the co-movement of long-run and short-run expectations in response to news more precisely.
Figure 4 reports the results from the SPF. The individual data reveal a similar pattern to the one we saw in the aggregate data. Long-run inflation expectations became less sensitive to news as the level of inflation expectations fell in the 1990s, but this did not persist. We again see a spike in the sensitivity of long-run inflation around 2009. Interestingly, the data suggest inflation expectations may be particularly sensitive to news about short-run inflation in the most recent data (which is from the survey conducted in May), although that result is based on 25 responses from a single survey.
4. Regression coefficient of $\Delta$ 10-year forecast on $\Delta$ 1-year forecast in individual SPF data
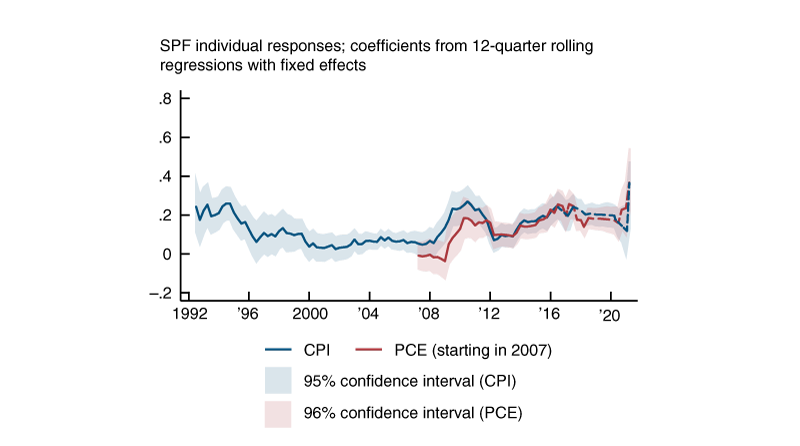
Source: Authors’ calculations based on data from the Federal Reserve Bank of Philadelphia, Survey of Professional Forecasters.
Figure 4 also reports results using data on expectations of PCE inflation. The pattern is the same as what we see for expectations of CPI inflation. This may seem surprising given the remarkable stability of the median ten-year forecast for PCE inflation in the SPF in figure 1. But this stability does not imply that most individual respondents simply pencil in 2% each survey. Some respondents do change their long-run forecasts of PCE inflation for idiosyncratic reasons, and the way they changed their expectations increasingly became more correlated with changes in their short-term forecasts.
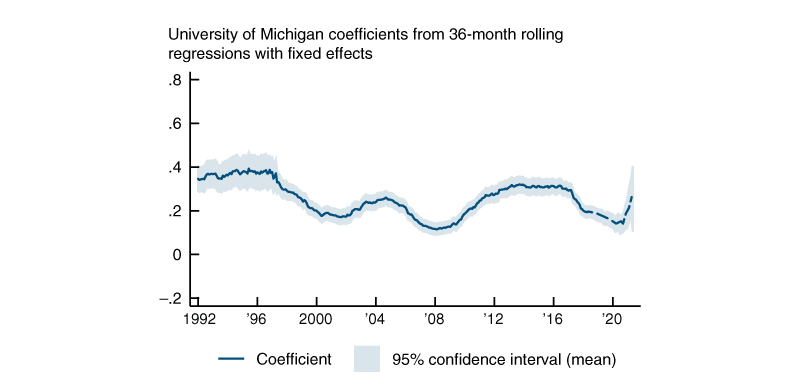
Figure 5 reports the results for the same exercise using the Michigan survey.6 The figure extends previous work by Dräger and Lamla (2018), who looked at the sensitivity of long-run inflation expectations in the Michigan survey using data ending in September 2017.7 In that sample, the sensitivity is persistent but varies between periods of high sensitivity and low sensitivity. By the end of that sample, long-run expectations had become sensitive to the incoming below-target inflation news. We find that the sensitivity of individual long-run inflation expectations to their short-run expectations fell after their sample ended. This trend toward lower sensitivity coincided with a slight decline in the level of households’ long-run expectations (figure 1). To the extent that low sensitivity reflects anchoring, this result suggests that by the onset of the Covid-19 pandemic, households’ long-run inflation expectations were becoming anchored at a somewhat lower level than in the first decade of the 2000s. Similar to the pattern in the SPF, the sensitivity appears to have shot up starting in March 2021 (the last data point in figure 5 is based on the surveys conducted in May 2021, since only aggregate data was released for June 2021). While the coefficients toward the end of the sample period are based on smaller numbers of observations in the SPF due to truncation, the Michigan survey sample includes roughly 130 observations of changes in forecasts across surveys and so is considerably larger.
5. Regression coefficient of $\Delta$ 5–10-year forecast on $\Delta$ 1-year forecast in individual Michigan survey data
Source: Authors’ calculations based on data from the Federal Reserve Bank of Philadelphia, Survey of Professional Forecasters.
The degree of sensitivity we infer from the individual data is at most 0.4 in both the SPF and Michigan survey. The sensitivity we infer using time-series data also rarely exceeds 0.4. As our previous discussion suggests, this can be viewed to mean that agents expect higher inflation today to persist substantially into future years. Recent work by Candia, Colbion, and Gorodnichenko (2021), which surveys firms rather than either households or professional forecasters, estimates the same sensitivity parameter we estimate at 0.7 for the period between the last quarter of 2018 and the last quarter of 2020. This suggests there remains the possibility that, at least for some people, including those who may be responsible for price-setting, inflation expectations may be even more sensitive to news than what we find.
Conclusion
Although the level of long-run inflation expectations has remained relatively stable since the late 1990s, evidence on the sensitivity of long-run inflation expectations to incoming news suggests the anchoring of inflation expectations may be less persistent. The sensitivity of long-run inflation expectations appears to have reverted to what it was back in the 1990s in the SPF. Sensitivity in the Michigan survey similarly rose to 1990s levels by the mid-2010s but declined after 2017 before leaping up in the most recent months. The same evidence also suggests that the sensitivity of long-run inflation expectations can change suddenly and rapidly. The greater sensitivity of long-run inflation expectations in the wake of the financial crisis, combined with low realized inflation, may well have contributed to the decline in the levels of some long-run inflation expectations before the Covid-19 pandemic. The same logic implies that long-run expectations may be responsive to news of high inflation.
Notes
1 The FOMC is the Federal Reserve’s monetary policy committee; four times a year, the Federal Reserve releases a summary of FOMC participants’ projections for gross domestic product (GDP) growth, the unemployment rate, inflation, and the appropriate policy interest rate. The summary also provides information regarding policymakers’ views on the uncertainty and risks attending the outlook. More information is available online.
2 The SPF is administered in the second month of each quarter, so the most recent data point for this survey in figure 1 is based on data collected in May 2021. The most recent data point for the Michigan survey was collected in June 2021.
3 More information on the CPI and PCE indexes and how they differ is available online.
4 For alternative definitions of anchoring, see Saten Kumar, Hassan Afrouzi, Olivier Coibion, and Yuriy Gorodnichenko, 2015, “Inflation targeting does not anchor inflation expectations: Evidence from firms in New Zealand,” Brookings Papers on Economic Activity, Vol. 46, No. 2, Fall, pp. 151–208, available online. Our notion of sensitivity corresponds to what they define as “increasingly anchored expectations.” This notion is also related to the way Carlos Carvalho, Stefano Eusepi, Emanuel Moench, and Bruce Preston define anchoring in “Anchored inflation expectations,” Australian National University, Crawford School of Public Policy, Centre for Applied Macroeconomic Analysis, working paper, No. 25/2020, revised May 2021 (originally issued March 2020), Crossref. That paper considers a model in which the public is unsure about the target rate that the central bank is aiming for. Expectations are said to be anchored when the public is reasonably confident it knows the target and their expectations of inflation in the long run coincide with this target, but are unanchored when the public is unsure about the central bank’s target and tries to infer the target from realized inflation. In the latter case, news that affects inflation in the short run will affect long-run inflation expectations.
5 Bernardo Candia, Olivier Coibion, and Yuriy Gorodnichenko, 2021, “The inflation expectations of U.S. firms: Evidence from a new survey,” IZA Institute of Labor Economics, discussion paper, No. 14378, May, available online; and Lena Dräger and Michael J. Lamla, 2018, “Is the anchoring of consumers’ inflation expectations shaped by inflation experience?,” CESifo, working paper, No. 7042, May, available online.
6 Individuals are surveyed just once, twice, and in some cases three times. We focus our analysis on the individuals who are surveyed twice with six months between interviews and use the data series PX1 and PX5 for short- and long-run expectations, respectively.
7 Dräger and Lamla (2018) don’t use time-fixed effects for their analogous figure. They do try to control for aggregate conditions later in their paper when they add year fixed effects to their regressions. Since they don’t use time-fixed effects, they do not entirely soak up common shocks. In practice it makes little difference whether or not time-fixed effects are included in the regressions.


