

In the U.S., homeownership is often described as part of the “American dream,” a way for consumers to accumulate wealth and gain other economic benefits. Almost two out of three U.S. households own the home they live in, a relatively stable amount over the last decade. Buying a home is usually the largest investment that a consumer will make, and the purchase price usually far exceeds what most can afford out of their current savings. In 2022, roughly 70% of home purchases were made with the help of mortgage financing.
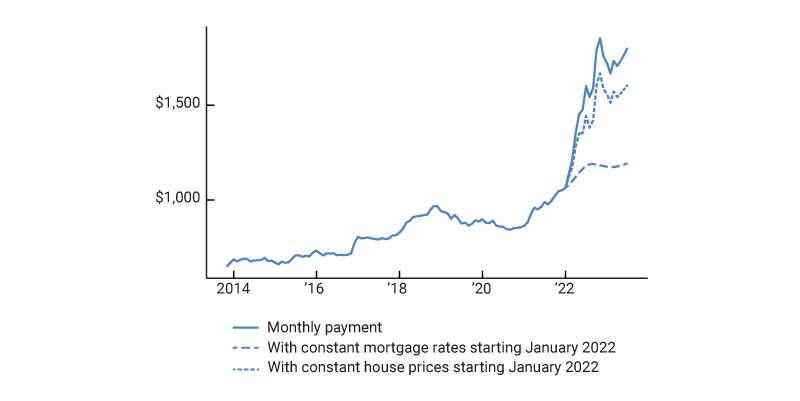
Starting in early 2022, U.S. consumers faced a rapidly changing housing market due to continued increases in home prices and a sharp rise in mortgage rates that occurred alongside increases in short-term interest rates. The decline in affordability since then has been notable. Suppose that in June 2023 the typical U.S. household purchased a typical home at the median purchase price of about $349,000, financed with a 20% principal down payment and a 30-year fixed-rate mortgage at the average national borrowing rate of 6.71%.1 This homeowner’s monthly mortgage payment toward principal and interest would total about $1,803, a 69% increase when compared to the same metric from December 2021.2 The solid line in figure 1 depicts this sharp change, the combined effect of both rate and price increases. To visualize the impact of each factor on its own, the dashed and dotted lines in figure 1 also show the paths if either monthly mortgage payment rates or home prices had stayed constant over the period while the other had continued to increase. Higher interest rates were the primary driver of higher mortgage rates, but the rise in home prices compounded the affordability challenge.
1. Monthly principal and interest payment on 30-year fixed-rate mortgage, typical home
This change mirrors those captured by the Home Ownership Affordability Monitor (HOAM) Index from the Federal Reserve Bank of Atlanta, which uses indicative measures of national median home price, borrowing rates, and income to measure the ability of a typical household to absorb the costs associated with owning a home.3 The HOAM Index shows that U.S. home ownership affordability started declining in about March 2021. Home price increases drove most of the initial decline in affordability, while the increase in mortgage rates had become the dominant factor by mid-2022.
To complement the insights from the Atlanta Fed, we analyzed individual loans from actual mortgage originations to understand the affordability picture for consumers who received new loans once interest rates started increasing in early 2022. We find that the median income of homebuyers materially increased over the period, which implies that the pool of potential homebuyers at the lower end of the income spectrum may be increasingly priced out of the market. Additionally, we find that the median income of the first-time homebuyer is now meaningfully above the median U.S. household income for the first time in ten years, suggesting that the cost of entry into the housing market is relatively high.
To examine trends from actual home purchases, we used data from mortgage loans that were packaged into mortgage-backed securities by one of three U.S. agencies—Fannie Mae, Freddie Mac, and Ginnie Mae (“agency MBS”)—and made available by eMBS, a mortgage and data analytics service. In the U.S., mortgage loans that meet certain requirements can be packaged up into mortgage-backed securities (MBS), with their principal and interest payments guaranteed by one of the U.S. agencies and sold to investors. That the government would provide such facilitation of credit is a testament to the economic importance of the housing sector.
This loan-level data is typically available on a monthly basis with less than a one-month lag, providing timely and granular insights into changes in affordability for borrowers.4 By comparison, the Home Mortgage Disclosure Act (HMDA) data, a database with a larger set of actual mortgage loan originations that also includes loans not securitized into agency MBS, is only available by mortgage origination year and is finalized with about a one-year lag.
Unlike the HMDA data, the eMBS data set allows us to explore the differences between first-time homebuyers and repeat homebuyers, an important distinction. The first-time homebuyer represents the marginal new entrant to the U.S. housing market, responsible for between 40% and 50% of all home purchases each year.5 In contrast to repeat homebuyers, who are at least partially hedged against home price fluctuations with wealth derived from home equity, first-time homebuyers are exposed to both mortgage rate increases and home price appreciations (Sinai and Souleles, 2004; Paciorek and Sinai, 2010).
Our data set uses first-lien loans for owner-occupied homes purchased between December 2013 and May 2023 securitized into agency MBS. It includes the loan amount, mortgage rate, and debt-to-income (DTI) ratio. The DTI ratio is the total of an individual borrower’s monthly debt payment obligations, including mortgage, credit card, and other loans, divided by their monthly income.6 This information allows us to calculate the home purchase price and estimate the buyer’s income for each loan in our data set.7, 8 For simplicity, we only include purchases financed with a 30-year fixed-rate mortgage, which comprises about 94% of loans.9 Our data set comprises about 20 million loans in total, including about 11 million loans made to first-time homebuyers. We estimate that our data set represents about 45% of all mortgage loans made for home purchases over the period.10
Using our eMBS data set to extrapolate national trends does come with some caveats:
- We can only estimate borrowers’ income—the data give us a strong basis for estimating income, as we observe DTI ratios alongside a large component of those debt payments in the form of principal and interest payments on a mortgage. Also, the median income level and distribution of our homebuyer income estimates using data from 2019 through 2022 is similar to median level and distribution of income data reported in HMDA data for similar loan types.
- This data set only includes buyers who were successful in purchasing a home. It does not give us insight into “almost” homebuyers—consumers who wanted or attempted to purchase a home but were unsuccessful for any reason, including affordability.
- Within the universe of successful home purchases, this data set excludes home purchases that did not require mortgage financing. We assume that all-cash buyers do not face the same affordability challenges of the typical consumer who must borrow money to purchase a home.
- This data set also excludes home purchases that were securitized in the private market (“nonagency”) rather than one of the three U.S. agencies. It is possible that borrowers who obtain loans securitized into nonagency MBS have lower incomes than the borrowers in our data set.11 Loans securitized by nonagency MBS generally represent about 5% of all securitized loans.
- Finally, our data set does not include mortgage loans that were not securitized at all, but instead held on banks’ or other lenders’ balance sheets. Such mortgages generally represent about 35% of all mortgage loans each year (Fuster, Lucca, and Vickery, 2022).
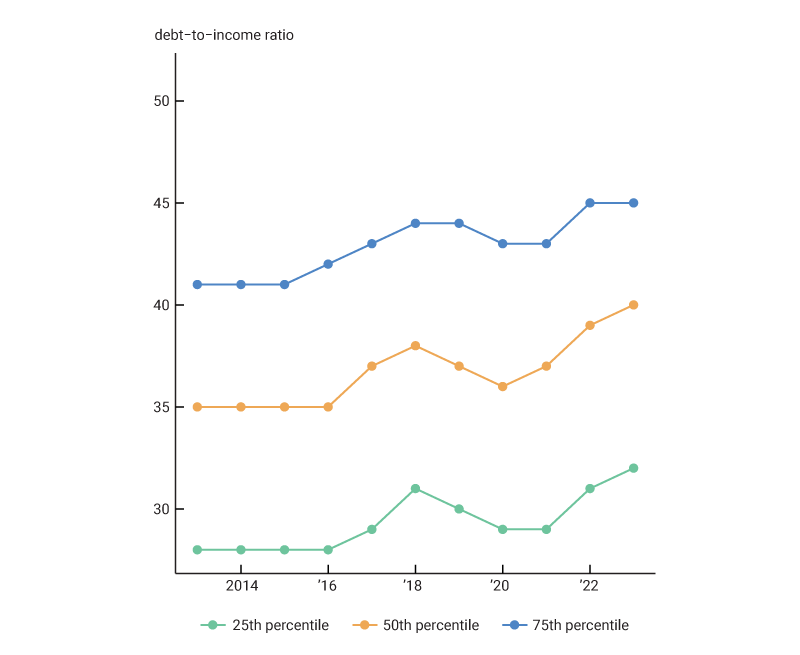
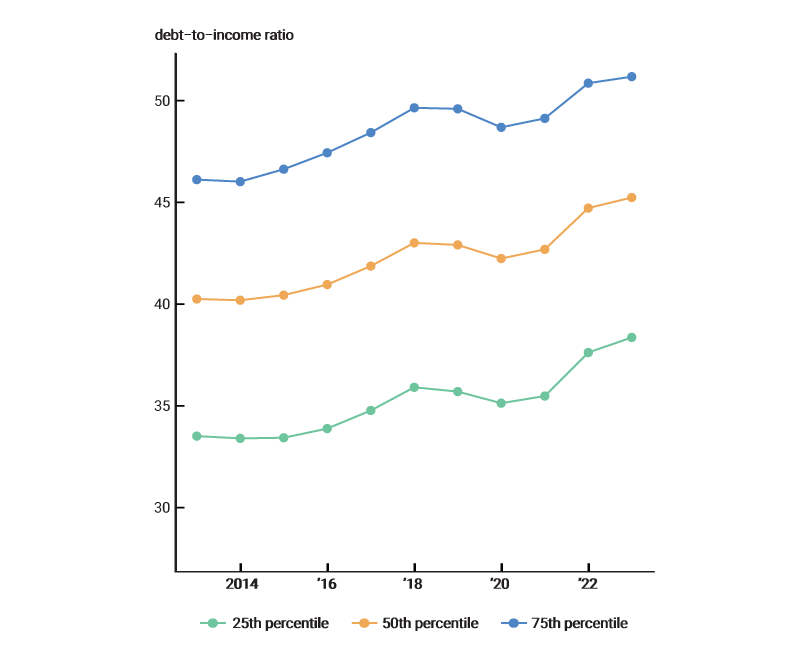
To understand current consumer affordability dynamics, we examine trends in the DTI ratio of borrowers. This measure of affordability allows us to compare the expense burden of a mortgage and other debt payments to the total income available to pay for them. Figure 2 shows the trend in DTI ratios for loans securitized by the three U.S. agencies—Fannie Mae and Freddie Mac, which are government-sponsored enterprises, and Ginnie Mae, which is part of the U.S. government. For both agency types, the distribution of DTI ratios—marked by its 25th, 50th, and 75th percentiles—started increasing noticeably in 2020.12 Since then, the median homebuyer has put about 3 percentage points more of their income toward debt repayments.
We now explore three potential mortgage-loan-related drivers of the increase in DTI ratios starting in 2022—higher home prices, higher mortgage rates, and lower incomes.13 Figure 3 illustrates how these three factors have evolved over time, using both indicative measures and actual transaction data from loans in our data set.
2. Debt-to-income ratios of borrowers by U.S. agency type
A. Fannie Mae/Freddie Mac
B. Ginnie Mae
- All else being equal, if consumers started buying higher-priced homes, they would take on larger monthly payments, putting upward pressure on the debt component of the DTI ratio. Panel A shows our calculation of median home prices from mortgages in our data set alongside data from the Zillow Home Value Index (ZHVI) for top- , mid- , and low-tier homes.14 Since the start of 2022, both our calculations and the ZHVI indicate that home prices were either flat or declining modestly, especially for higher-priced homes. This factor does not explain the increase in DTI starting in 2022.
- Given relatively flat house prices, increases in mortgage rates should put upward pressure on DTI ratios. Panel B shows that in 2022 both indicative mortgage rate data and rates from loans in our data set increased sharply, generally around 3 percentage points. This factor is likely the main contributor to the increase in the debt component of the DTI ratio.
- A decline in income would also result in an increase in DTI ratios. However, as panel C shows, since 2022 the median imputed income of homebuyers in our data set has increased; national median indicative data from the U.S. Census Bureau’s American Community Survey (ACS) is only available through the end of 2021 but shows steady increase in nominal income over the period. Additionally, our estimate of the change in median incomes starting in 2022 using the Atlanta Fed Wage Growth Tracker data, depicted with dashed lines, suggests that median household incomes continued to increase over the period. Higher incomes should have put downward pressure on DTI ratios during this time.15 Given this trend, alongside higher DTI ratios, it appears that the impact of higher interest rates on mortgage expenses more than offset household income gains.
By comparing our set of actual mortgage loan transactions to national median figures using indicative data, we make two additional observations from figure 3 that may signal changing dynamics in the U.S. housing market, especially for first-time homebuyers.
3. Comparison of homebuyer metrics using eMBS data to national indicative series values
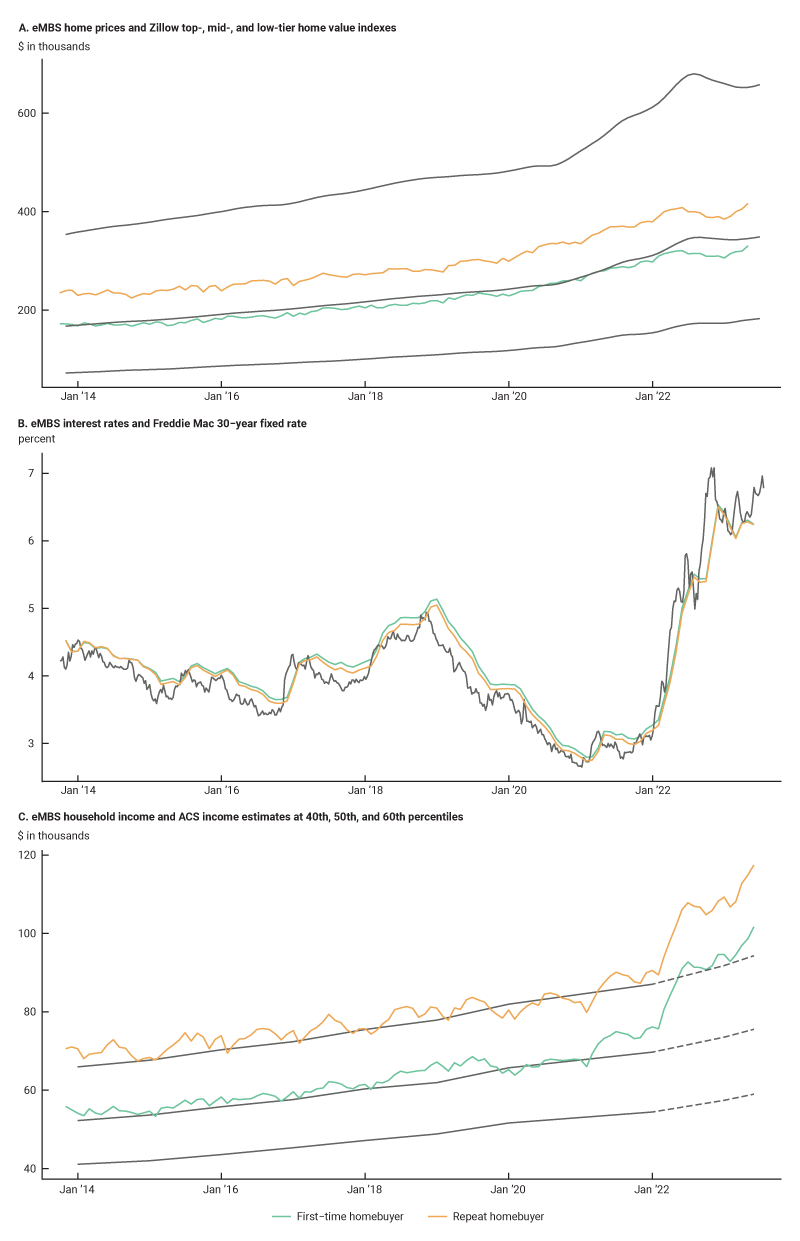
- Panel A shows that the gap between the price of homes purchased by first-time homebuyers and the ZHVI widened starting in 2022. The median purchase price for a first-time homebuyer has been on average 7.5% below the typical home value, wider than the previous typical gap of around 4%. Further analysis would be needed to understand the drivers behind this change. One possibility is that buying power of first-time homebuyers has eroded because they lack wealth gains in the form of existing home equity that could offset increased housing costs.
- Panel C shows that starting in 2021, our estimated median income of actual homebuyers accelerated from near the national median to well above the 60th percentile of the national median based on the ACS data. This means that homebuyers with below-median incomes were much more common a few years ago than they are today. This change in trend holds for both repeat and first-time homebuyers, underscoring the affordability hurdle that U.S. consumers will need to overcome just to enter the market.16
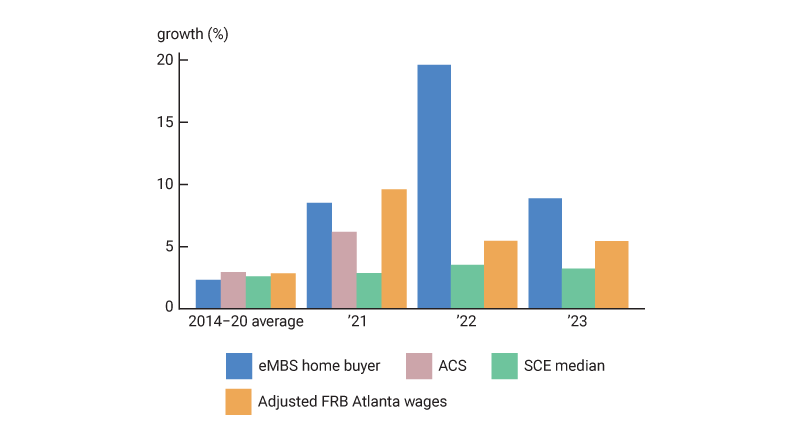
The jump in incomes for homebuyers in our data set as early as 2021 is especially striking—8.5% in 2021, 19.6% in 2022, and almost 9% in 2023 through May. Prior to 2021, actual homebuyer income growth tracked ACS estimates for the income growth of the median U.S. household. Since ACS income growth estimates in 2022 and 2023 are unavailable to provide a more recent comparison, we use two other data series for timelier proxies of median income growth and plot them alongside our median homebuyer income growth and ACS median household income growth in figure 4:
- The Federal Reserve Bank of New York’s Survey of Consumer Expectations is available through the end of June 2023. This measure points to expected annual household income growth of about 3.5% throughout 2022 and about 3.25% so far in 2023.
- The Federal Reserve Bank of Atlanta’s Wage Growth Tracker is available through the end of June 2023. We adjust their wage growth measure to account for changes in hours worked as well as the employment-to-population ratio. Our adjusted measure pointed to annualized income growth of about 5.5% in 2022 and a similar annualized growth rate so far in 2023. The dashed lines in panel C of figure 3 represent estimates of household income for 2022 and 2023 based on these growth rates.
4. Comparison of U.S. household income growth metrics
Sources: Federal Reserve Bank of New York, Survey of Consumer Expectations; Federal Reserve Bank of Atlanta; U.S. Census Bureau; and eMBs.
Although these are rough proxies for the more robustly estimated household income growth from the ACS, we see that they track the ACS-based income growth well from 2014 to 2020. Figure 4 supports our earlier observation that the jump in incomes of actual homebuyers when compared to changes in the broader population is a relatively recent phenomenon.
Conclusion
Given these proxies, it appears likely that in 2022 the income required for a home purchase increased much more than the income gains made by the median U.S. household.17 Using loan-level data in eMBS, we observe a compositional shift in who can buy a home given current home prices and mortgage rates. Those who successfully purchase homes now have relatively much higher incomes than the typical consumer.18 This suggests that households with below-median incomes are facing an even greater struggle with affordability in today’s housing market, potentially losing out on this gateway to wealth accumulation that has been a cornerstone of the American dream.
We thank Gene Amromin and Dan Sullivan for helpful comments and suggestions.
Notes
1 We use the Zillow Home Value Index (ZHVI), which represents the value of a “typical,” not median, home. See their documentation for more details. Mortgage rates are Freddie Mac’s 30-year fixed-rate mortgage weekly average, obtained via Haver Analytics.
2 This does not include additional costs, such as taxes and insurance.
3 The Home Ownership Affordability Monitor uses several data series, including median household income from the U.S. Census Bureau’s American Community Survey, the median existing home price from CoreLogic, the 30-year fixed rate mortgage weekly average rate from Freddie Mac’s Primary Mortgage Market Survey, as well as the U.S. Census Bureau-based estimates for property taxes, estimates of property insurance from SNL Financial/S&P Global Market Intelligence, and estimates of private mortgage insurance from the Federal Housing Finance Agency.
4 eMBS releases loan-level information at a high frequency. Data for loans typically start to appear around the first payment date for a mortgage loan. Since this is about 30 to 60 days after a house purchase and the corresponding mortgage origination, we typically observe mortgages from new house purchases with a two-month delay.
5 More information is available online, First-Time Buyers Did Not Drive Strong House Price Appreciation in 2021.
6 For a detailed example of debts that mortgage originators include in a debt-to-income ratio calculation, see Fannie Mae calculation definition.
7 This imputation proceeds as follows. First, we use the known loan interest rate alongside the known loan size and term to calculate the monthly principal and interest payments. We use the University of Minnesota’s Integrated Public Use Microdata Series (IPUMS), based on U.S. Census Bureau microdata, to estimate on a state-year basis: 1) the median property tax payment, and 2) median property insurance costs, each as a percent of home value. Like the Atlanta Fed, we use the average private mortgage insurance cost published by the Federal Housing Finance Agency, which we calculate as 0.5525% of the mortgage amount. Combining all of these gives a monthly mortgage payment. We can then estimate the total debt burdens consistent with our monthly mortgage payments and the figures published by the Federal Reserve Bank of New York Consumer Credit Panel data. Comparing these monthly debt payments to the debt-to-income ratio, we impute the income of the borrower. When we apply this procedure to the HMDA data, which has all the necessary inputs as well as a reported income, we find that the median imputed income for 2021 homebuyers with agency-securitized mortgages is $82,400, close to the true median in HMDA of $85,000.
8 Over the course of 2020, we note that there were substantial changes to student loan forbearance programs that might change the debt-to-income ratio; however, Fannie Mae and Freddie Mac guidelines for calculating the debt-to-income ratio make it clear that loans in forbearance still count toward debt payments. HUD guidelines did change in 2021 to potentially lower how much student debt obligations were counted, but only in certain cases. This would tend to lower observed DTIs and raise our imputed incomes.
9 Based on HMDA data, agency originations for five- , seven- , and ten-year adjustable-rate mortgages tended to be for higher-income households. This suggests that the household income composition change we observe is unlikely due to lower-income households switching to adjustable-rate mortgages between 2021 and 2022. However, we cannot rule out the reported effects being driven by a change in households deciding between a fixed- and adjustable-rate mortgage.
10 We use the Mortgage Bankers Association estimate for the total volume of purchase loan originations to derive this estimate.
11 See Urban Institute figures on nonagency MBS issuance, p. 12.
12 Each agency has different debt-to-income requirements. See the selling guides for Fannie Mae, Freddie Mac, and the HUD Housing Policy Handbook for details.
13 Consistent with our observed increase in mortgage loan-related debt starting in 2022, the Federal Reserve Bank of New York Survey of Consumer Expectations shows that of the $1.47 trillion increase in consumer debt from 2021:Q1 through 2023:Q1, $1.11 trillion came from mortgage loans. That said, DTI ratio increases could also be due to increases in nonmortgage debt payments.
14 Zillow defines a top-tier home as one in the 65th to 95th percentile in a given region. A mid-tier home is between the 35th and 65th percentiles, and the low-tier home is between 5th and 35th percentiles.
15 We used the ACS five-year estimates for median household income in this exercise.
16 Beraldi and Zhao document that from 2020:Q2 to 2022:Q1 the incomes of first-time homebuyers shifted meaningfully higher relative to that of all homebuyers. They suggest that this is mainly due to only higher-income first-time homebuyers entering the market, driven by increases in house prices during that time.
17 We validate this outsized increase with HMDA data, finding 11.8% growth in the household income of the median homebuyer from 2021 to 2022. Note that the public version of the 2022 HMDA data is subject to corrections and is not yet finalized. We limit the HMDA data to a subset of loans that are very similar to those represented in eMBS: 30-year, fixed-rate mortgages eligible to be securitized by one of three U.S. agencies for purchases of owner-occupied homes.
18 This is in line with the findings of the July 2022 FEDS Notes article by Daniel Ringo on the subject.


