

Access to financial services, including insurance, is vital for the growth and development of communities. Without banks issuing residential mortgages and business loans, it is extremely difficult for people to purchase homes and grow their businesses. Without property insurance, banks will be reluctant to provide such loans. Thus, the inability to access property insurance makes communities more vulnerable to cycles of disinvestment and decline. In this Chicago Fed Letter, I examine the Fair Access to Insurance Requirements (FAIR) plans, how they addressed the issues of insurance availability and affordability in urban areas, and the role redlining played in affected areas.
FAIR plan background and motivations
FAIR plans were first formed during the civil rights era in the U.S. to provide coverage to homeowners and business owners in communities where private insurers were unwilling to offer property insurance. Such communities were often subject to the unfairly discriminatory practice of redlining, the term stemming from the practice of banks outlining in red pen the areas on a map where they would not lend. Although redlining is commonly attributed to mortgage lending by banks—thanks to the preservation of the 1938 Federal Housing Administration (FHA) underwriting manual1 and the resurfacing of the Home Owners’ Loan Corporation’s (HOLC) so-called residential security maps in the 1980s—it has long been used to describe property insurance practices as well.2 In what follows, I document that mortgage loan redlining and property insurance redlining have a close shared history.
The Federal Housing Administration is often considered largely responsible for having institutionalized redlining in residential mortgage loan and mortgage insurance markets. However, the FHA also may have played a significant role in property insurance redlining by incentivizing insurance companies to discriminate based on race. Specifically, the FHA’s post-World War II cheap mortgage arrangements accelerated growth of suburban areas and the flight of the middle class from urban areas, which continued into the 1950s and 1960s.3 The FHA’s strict enforcement of racial covenants segregated African Americans and largely excluded them from this suburban expansion. In the 1940s insurers developed a comprehensive homeowners policy to attract these new suburban homeowners and began to abandon the traditional fire insurance business that had been the norm in urban areas.4
A 1978 congressional report on discrimination by property insurers described this process as follows: “With the flight of insurance to suburbia in pursuit of the affluent and white middle class risks, there was a tighter constriction of the inner-city insurance market … . Credit and mortgage financing hinged on the purchase of property insurance … . Many lending institutions began to follow the example of the insurance industry and refused to do business in certain neighborhoods or sections of the inner city.”5 Furthermore, the National Commission on Urban Problems tied the FHA to redlining practices in both mortgage lending and property insurance underwriting; in its 1968 report, the commission noted the following: “There was evidence of a tacit agreement among all groups—lending institutions, fire insurance companies, and FHA—to block off certain areas of cities within ‘red lines,’ and not to loan or insure within them. The net result, of course, was that the slums and the areas surrounding them went downhill farther and faster than before.”6 These facts support the argument that property insurance redlining occurred in parallel with mortgage redlining, whose origins trace back to the 1930s.
By the 1960s unavailability and high cost (unaffordability) of property insurance in urban areas had reached crisis levels. The aptly named Meeting the Insurance Crisis of Our Cities—a 1968 report produced by the U.S. President’s National Advisory Panel on Insurance in Riot-Affected Areas (also known as the Hughes Panel)—found that many property owners could not find insurers that would offer them policies, and those owners who could were often charged unaffordable premiums. A survey of approximately 1,500 businessmen and 1,500 homeowners in poor areas of six large U.S. cities, conducted by the Hughes Panel, found that over 40% of businessmen and nearly 30% of homeowners had “serious property insurance problems.” Almost 50% of the surveyed businessmen reported not having burglary and theft insurance. Around 25% of these businessmen wanted it but could not get it at any price, and around 30% also wanted coverage but found it too expensive.7 The Hughes Panel report highlighted the extent of the problem and inspired the federal legislation creating the FAIR plans.
Urban Area Plans: The predecessor to FAIR plans
Some states were aware of these issues before the federal government got involved. Before the FAIR plans, there were the “Urban Area Plans”—a name for the voluntary market8 pools that provided basic property insurance in some urban core areas, in some cases with a measure of government support. The first such program was the Boston Plan in 1960; and by December 1, 1967, Urban Area Plans had been established and active in 13 states—including the Chicago Home Inspection Plan in Illinois. The structure of these plans was quite varied, as was the degree of their success in tackling local insurance crises.9
The very first of these plans—the Boston Plan—served as the exemplar for the rest. Before the plan came to be, Roxbury (a neighborhood of Boston) was considered “blighted” and substandard in its entirety by the insurance industry. This led to a virtual absence of property insurance availability in the area. To address this need, the Massachusetts legislature proposed a program run by the New England Insurance Rating Association, with a supervisory role played by the Massachusetts Insurance Department. The rating association conducted inspections of properties on the behalf of insurance agents, brokers, and companies and reported their findings to the insurance department. The insurance department could then use these reports to determine if insurers were unfairly denying coverage to property owners in an area (Roxbury initially). The plan got off to a slow start. Most residents did not know about the new plan; many agents were using this lack of awareness to write policies at rates in excess of the standard rates and rake in higher commissions; and the few community leaders of Roxbury who were aware of the plan did not trust nor believe in its potential. In late 1961, the following solutions were employed to address these issues: 1) an educational program was started to inform residents about the plan; 2) requests for inspection were permitted by property owners, as opposed to only agents, brokers, and companies; 3) only after three companies denied an application for insurance at a standard rate could a policy be written at an excess rate; and 4) the Massachusetts Insurance Department considered suspending the license of a noncompliant broker, which prompted insurance agents and brokers to start cooperating more with the plan. After these steps were taken, the number of property inspection requests rose, while the proportion of rejected applications for property insurance fell. From its inception on October 3, 1960, through August 31, 1967, the Boston Plan received around 25,000 requests for inspection, but only 2,040 insurance applications were declined. Fire losses in Roxbury fell, and insurers were far more willing to provide coverage relative to 1960. This success is partially credited to aid from the Boston Redevelopment Authority—which included the replacement of a substantial amount of condemned properties with new low-cost housing and the fostering of property improvement through grants and low-cost loans.10
Features of redlining and the birth of state-run insurance
The Boston Plan illustrates why it is important to understand how insurance redlining and the FAIR plans interacted. Insurers, like most firms in a competitive market, are motivated to maximize profits. To achieve this, losses and exposure to potential losses must be minimized. In theory, this requires firms to perfectly discriminate individual risks and set prices accordingly. In practice, this did not happen in the voluntary market for property insurance. The insurance industry commissioned a study by the Stanford Research Institute, published in 1976, that examined the experience of the Boston Plan; that study highlighted the fact that competition did not work (i.e., it did not make property insurance available and affordable) in Roxbury.11 The market failure—redlining—was rooted in perception. In areas with more perceived high risks, insurers assessed an average risk potential that exceeded the actual risk potential for all properties in the area. In other words, their expected losses were greater than their direct losses. Since insurers had to assess new risks ex ante to price appropriately, these expectations factored into their operational decisions. The market failure stemmed from the insurers’ inability to assess properties based on their individual risks and their dismissing entire areas based on area demographics or the risk profiles of select properties in the area. The FAIR plans counteracted both by assessing properties individually, but more critically, by removing the area-based perception that influenced expected losses (those that were unverifiable upon inspection) from the property-level underwriting decision-making.
If redlining and the resulting twin issues of insurance availability and affordability served as the motivation for the FAIR plans, the civil disturbances of the 1960s were the final nudge that got the federal government to take action. Given the scale of property damage incurred across the country in the 1960s, were insurers justified in avoiding redlined and riot-affected areas? For context, one of the major disturbances during the period occurred in Detroit in July 1967 and cost $132 million (roughly $1 billion in 2021 dollars) in property damages. It is important to note that redlined areas and riot-affected areas were neither identical nor mutually exclusive. Redlining can be traced at least as far back as the 1930s, when it was practiced at the federal level. There were just two major urban area riots (both in Harlem) between 1930 and the explosion of civil disturbances in the 1960s. This is to say that all redlined areas were not redlined because of past rioting history or the risk of future rioting. Indeed, in its 1938 underwriting manual, the FHA deemed “the infiltration of … inharmonious racial groups” as an “adverse influence” from which protection is necessary.12 This recommendation is tantamount to redlining. While it is perfectly rational to avoid potential losses that would be incurred in riot-affected areas, the matter of whether redlining preceded rioting or vice versa is a “chicken or the egg” question with a clear answer: Redlining at a federal level preceded the substantial nationwide rioting that insurers claimed to be avoiding; thus, this rioting cannot be used to justify redlining after the fact.13
Nonetheless, civil unrest in the form of rioting was a particular motivation for the legislation that would give life to the FAIR plans. This legislation—the Urban Property Insurance Protection and Reinsurance Act of 1968—put in place a federal incentive to address the crisis of insurance availability and affordability in urban areas. In particular, the federal government offered a subsidy for reinsurance (i.e., insurance for insurers to protect themselves from catastrophic losses) to insurers in states with participating FAIR plans (Dwyer, 1978, p. 626). This provision, reflecting the recent experience of urban riots, offered reinsurance coverage on losses from riots or civil disorders. By transferring insurance risks related to rioting from private insurers to the federal government, this provision incentivized participation by states in the FAIR plans and made insuring riot-affected areas more affordable for private firms.14
Since insurance is regulated at the state level, each FAIR plan had to be established individually by statute at the state level and activated by its state government. The corresponding legislation was initially adopted in 26 states, the District of Columbia, and Puerto Rico.15 In terms of practical implementation, the FAIR plans have functioned as private–public partnerships. The insurance policies have been written by the state-run insurers or state-run residual market insurers (SRIs) that provide property and business insurance for properties that can’t get coverage in the voluntary market. However, the funding for these policies has come from private insurers that are licensed to operate in the plan’s state and line of business (typically property and casualty insurance). The FAIR plan’s financials are pooled by and divided among these insurers proportional to each insurer’s market share for that state. In this sense, FAIR plans are “shared market plans,” pooling together funding by private insurers and underwriting as state-run entities.
The role of redlining in the insurance crisis
In a 1997 book on insurance redlining, Klein defines redlining as “unfair discrimination (i.e., discrimination that is not based on differences in cost or risk) against a particular geographic area.”16 There is evidence that redlining contributed to worse outcomes in affected communities. Research by economists at the Chicago Fed and U.S. Census Bureau found that redlining promulgated by the Home Owners’ Loan Corporation through its 1930s maps resulted in “0.2 years less of schooling, $1,500 to $6,000 (in 2000 US dollars) lower prime-age annual income, and neighborhood residences during adulthood with lower education and other socioeconomic characteristics.”17 Research by the U.S. Department of Housing and Urban Development in the late 1970s and testimony from business owners at the Federal Insurance Administration’s (FIA) 1978 New York City hearings suggested that redlining “restricts the ability of businesses to expand thereby affecting job opportunities as well.”18 Squires and Velez report in a 1987 paper how redlining led to homeowners in certain urban areas (those that were redlined) to be unfairly denied coverage by insurers based on a subjective justification or a heavily race-based justification.19
Squires and Velez (1987, p. 63) find that the practice of redlining exhibits “discriminatory nonrational economic behavior on the part of insurers,” citing strong demographic biases in the distribution of homeowners insurance policies. A 1979 report prepared by the Illinois, Indiana, Michigan, Minnesota, Ohio, and Wisconsin Advisory Committees to the United States Commission on Civil Rights found that among proxies of risks—including fire, theft, age of housing, and income—the minority composition of a given zip code area had the strongest correlation with voluntary market activity (i.e., whether or not someone was insured by a private insurer) in Chicago, Illinois: the higher the minority percentage of an area’s population, the lower the underwriting activity by private insurers there. This negative correlation retained its statistical significance even after controlling for rates of fire and theft, as well as for the relationship between income and minority status.20
Redlining was a main driver for the lack of availability of insurance in many urban areas during the 1960s. Insurers often made denials of coverage citing “environmental hazards,” defined as “any hazardous condition that might give rise to loss under an insurance contract, but which is beyond the control of the property owner.”21 Two examples of environmental hazards would be a high incidence of natural disasters like flooding and wildfires or high crime rates. However, insurers sometimes used environmental hazards to justify denial of coverage in entire neighborhoods (including individual properties with little to no material environmental risk), effectively redlining people and properties that were insurable and making insurance in these areas generally unavailable.22
To address the issue of availability, the Hughes Panel recommended that the state or its insurance industry must agree “to make essential property insurance available without regard to environmental hazards.”23 This ensured that a property could only be denied coverage based on factors within the control of the property owner, eliminating the possibility of exclusion based on geography, i.e., redlining. The panel believed that FAIR plans would end redlining and other restrictive activities.24
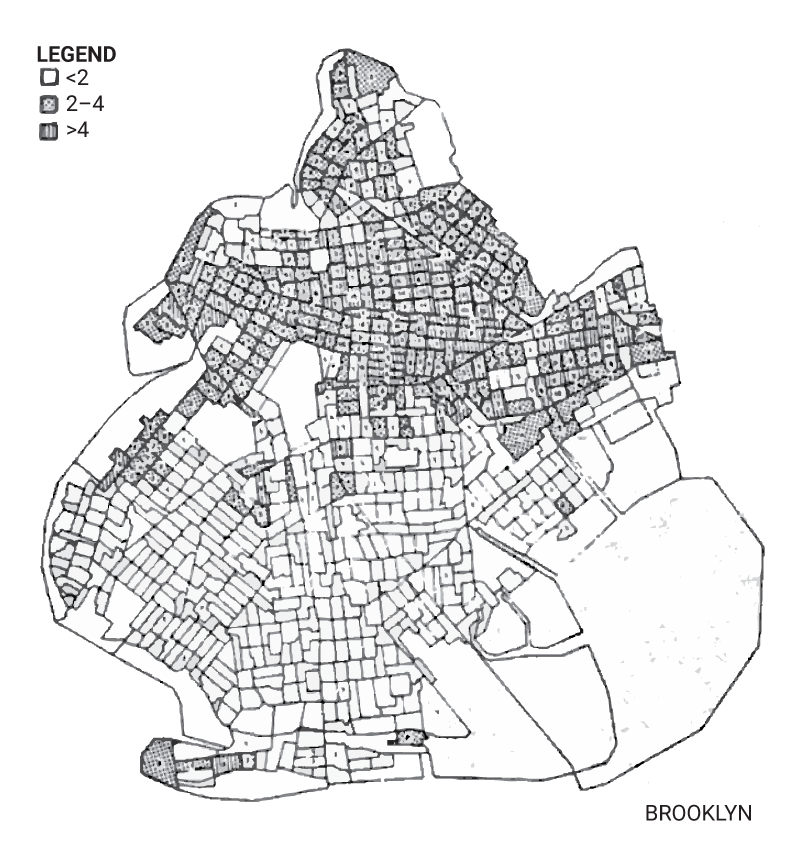
Nearly ten years after the federal legislation founding them, FAIR plans appeared to have been successful at addressing the insurance availability issue in some urban areas. Figure 1, panel A is a coverage map of 1970 census tracts in Brooklyn that displays the sample of all new and renewal insurance policies issued under the New York FAIR plan with building coverage processed from mid-October through early November 1977. The darker a tract’s shading, the higher number of FAIR plan policies were issued there. Figure 1, panel B displays the HOLC’s redlining map for Brooklyn as of April 1938; the areas in the map are graded from “first” (green) to “fourth” (red), with those in red being redlined and considered “hazardous.” These two maps display a striking similarity between areas that were redlined by the HOLC in the late 1930s (panel B) and those where the most insurance policies were issued under the New York FAIR plan in the late 1970s (panel A).
1. Brooklyn: 1977 New York FAIR plan coverage map versus 1938 HOLC redlining map
A. 1977 New York FAIR plan coverage map
B. 1938 HOLC redlining map
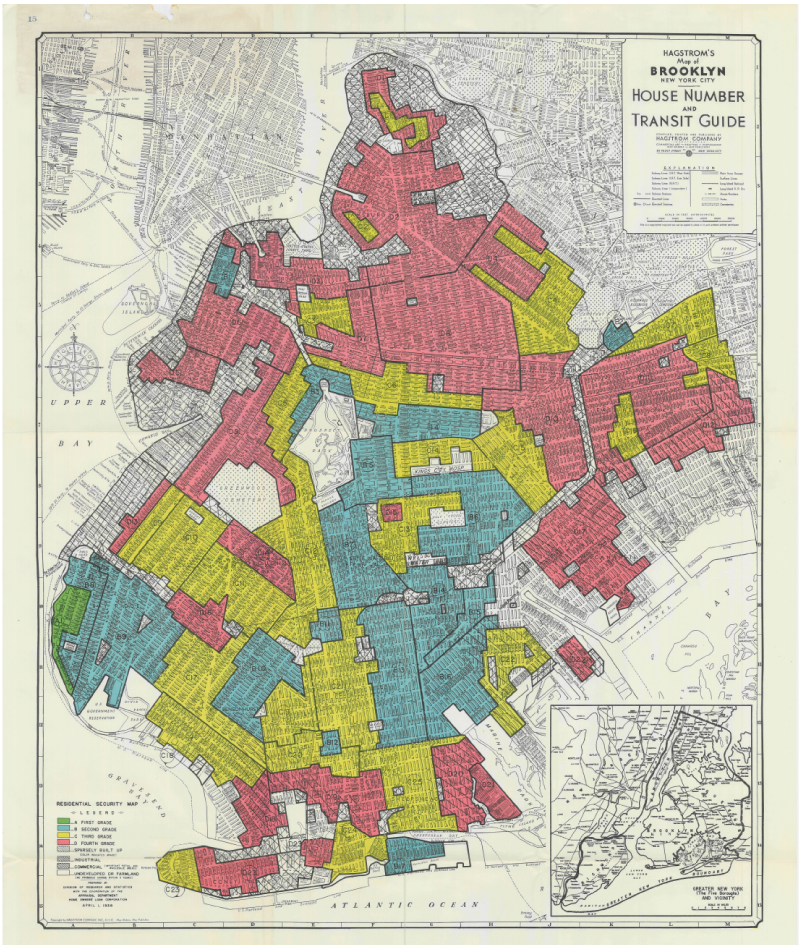
Sources: United States Congress, Senate, Committee on the Judiciary, Subcommittee on Citizens and Shareholders Rights and Remedies (1978, appendix H, p. 332); and Mapping Inequality: Redlining in New Deal America.
How FAIR plans approached the affordability issue
While the availability of insurance was a particular focus of the Urban Property Insurance Protection and Reinsurance Act of 1968, the issue of affordability was (and still is) a challenge for FAIR plans to address. FAIR plan policies were (and still are) typically more expensive than voluntary market policies while providing less coverage. Part of this difference in price was that the FAIR plans covered properties that were legitimately higher risk (Dwyer, 1978, p. 630, note 76). However, Klein (1997, chapter 3, p. 80) notes that inefficiencies in the FAIR plan rating structure can result in low-risk properties paying too much and high-risk properties paying too little. This dilemma would make affordability a point of contention in the years following the FAIR plans’ creation. The Holtzman amendment was adopted by Congress in 1978 to stabilize FAIR plan policy prices. Before the Holtzman amendment was written into law, FAIR plan policies’ rates ran 250% to 500% higher than voluntary market rates for similar properties (Dwyer, 1978, p. 630, note 76). The amendment mandated that no policy written by a FAIR plan insurer could charge an insurance premium greater than the prices that private insurers were charging in that state. Those prices were determined by the state’s insurance pricing regulatory agency. The exception was in the case where the insured property was in substandard condition, thus justifying a higher price (Dwyer, 1978, p. 629). To incentivize cooperation with the Holtzman amendment, the federal government stipulated that failure to comply with the new law would result in the loss of eligibility for federally subsidized riot reinsurance (Dwyer, 1978, p. 634). In other words, the amendment imposed a hard limit on policy prices without providing any additional incentives for private participants.
Perhaps predictably, this approach failed to fully address the challenge of affordability. Each FAIR plan and its operations were unique to its state, so the differences between FAIR plans led to a range of outcomes. For example, of the 28 states participating in the late 1970s, 11 states had FAIR plan policy rates that were higher than voluntary market rates before the Holtzman amendment. Five of those states chose not to comply with the new law and were therefore disqualified from the federal subsidy (Dwyer, 1978, p. 635). A FAIR plan’s ability to provide affordable coverage in a given state has depended heavily on that state’s regulatory agency and the rates that it sets. Naturally, the regulatory environment has varied by location as well. The fact that FAIR plans cannot discriminate against legitimate environmental hazards (such as natural disaster risk) means that some properties are insured at rates that fail to reflect their actual risk.
Unintended consequences of FAIR plans
An unintended consequence of the plans’ design not yet discussed was more insidious. For instance, there is anecdotal evidence of FAIR plans incentivizing arson in poor communities. Beryl Satter’s book Family Properties offers the example of Al Berland, a Chicago slumlord who collected $350,000 in insurance by August 1970 after fires had broken out in 47 of his buildings. A notorious arsonist, Berland was known as “a torch” by the Chicago Police Department. He would go on to collect over $800,000 in fire insurance until his arrest in 1974.25 Despite being well intentioned, the design of the FAIR plans may have incentivized this criminal behavior by not accounting for the fact that neglected properties would get FAIR plan insurance policies that reimbursed construction costs that were higher than the market value of the insured properties at the time.
This anecdote about Berland highlights a key pitfall with the FAIR plans. Designing FAIR plans to ignore environmental hazards appears to have been an effective way of identifying areas affected by redlining and addressing the insurance availability issues there. However, not enough was ever done to distinguish areas that were being discriminated against based on demographics from areas that were subject to significant risk of large losses. This would change the very nature of FAIR plans in the future. As of today, many FAIR plans claim to insure climate risk, having shifted away from their original mission of urban area coverage.
Conclusion
In closing, the FAIR plans were created to counter the pervasive practice of redlining that disenfranchised countless communities for several decades. Their central role was to end the property insurance crisis—redlining in particular—and expand property insurance access. Evidence suggests that FAIR plans effectively ameliorated the insurance availability issue in redlined areas. However, the insurance affordability issue and some unintended consequences were never effectively addressed. Nonetheless, FAIR plans provide an instructive example of the capacity of the government to remedy market failures.
Notes
1 Federal Housing Administration, 1938, Underwriting Manual: Underwriting and Valuation Procedure Under Title II of the National Housing Act, Washington, DC: U.S. Government Printing Office, available online.
2 University of Illinois at Chicago Circle Campus, Urban-Suburban Investment Study Group, 1977, Redlining and Disinvestment as a Discriminatory Practice in Residential Mortgage Loans, Washington, DC: Department of Housing and Urban Development, Office of Assistant Secretary for Fair Housing and Equal Opportunity, part 2, section 1, p. 4, available online.
3 Joanne Dwyer, 1978, “FAIR plans: History, Holtzman and the arson-for-profit hazard,” Fordham Urban Law Journal, Vol. 7, No. 3, p. 618, note 8, available online.
4 United States Congress, Senate, Committee on the Judiciary, Subcommittee on Citizens and Shareholders Rights and Remedies, 1978, Rights and Remedies of Insurance Policyholders: Hearings Before the Subcommittee on Citizens and Shareholders Rights and Remedies of the Committee on the Judiciary, United States Senate, Ninety-Fifth Congress, Second Session, Washington, DC: U.S. Government Printing Office, appendix A, p. 227, available online.
5 United States Congress, Senate, Committee on the Judiciary, Subcommittee on Citizens and Shareholders Rights and Remedies (1978, appendix A, pp. 227–228).
6 National Commission on Urban Problems, 1968, Building the American City: Report of the National Commission on Urban Problems to the Congress and to the President of the United States, Washington, DC: U.S. Government Printing Office, p. 101, available online.
7 President’s National Advisory Panel on Insurance in Riot-Affected Areas, 1968, Meeting the Insurance Crisis of Our Cities: A Report by the President’s National Advisory Panel on Insurance in Riot-Affected Areas, Washington, DC: U.S. Government Printing Office, pp. 2–3, available online.
8 The term voluntary market used throughout this article refers to the collection of private insurers that write insurance policies and their policyholders, excluding both those who do not have policies with those insurers and state entities (that is, voluntary market is interchangeable with insurance industry or insurers broadly).
9 President’s National Advisory Panel on Insurance in Riot-Affected Areas (1968, pp. 56, 75).
10 President’s National Advisory Panel on Insurance in Riot-Affected Areas (1968, pp. 56–61).
11 Barbara Casey, Jacques Pezier, and Carl Spetzler, 1976, The Role of Risk Classification in Property and Casualty Insurance: A Study of the Risk Assessment Process, 3 vols., Menlo Park, CA: Stanford Research Institute, as referenced in United States Congress, Senate, Committee on the Judiciary, Subcommittee on Citizens and Shareholders Rights and Remedies (1978, pp. 193).
12 Federal Housing Administration (1938, part 2, section 9, paragraph 935).
13 The terms riot and rioting appear throughout this article because they were used in many of the primary sources I consulted.
14 It is worth noting that the FAIR plans stopped offering riot reinsurance in 1982 because of financial mismanagement and political discord (Elston Carr, 1993, “Cancellation spurs call for new riot insurance program,” Los Angeles Times, April 9, available online; and Myron Struck, 1982, “Reagan wants U.S. out of riot-insurance business,” Washington Post, May 7, available online).
15 Law review editors, 1971, “The central city insurance crisis: Experience under the Urban Property Protection and Reinsurance Act of 1968,” University of Chicago Law Review, Vol. 38, No. 3, article 10, p. 673, available online.
16 Robert W. Klein, 1997, “Availability and affordability problems in urban homeowners insurance markets,” in Insurance Redlining: Disinvestment, Reinvestment, and the Evolving Role of Financial Institutions, Gregory D. Squires (ed.), Washington, DC: Urban Institute Press, chapter 3, p. 43, available online.
17 Daniel Aaronson, Daniel Hartley, Bhashkar Mazumder, and Martha Stinson, 2023, “The long-run effects of the 1930s redlining maps on children,” Journal of Economic Literature, Vol. 61, No. 3, September, p. 860, Crossref
18 United States Congress, Senate, Committee on the Judiciary, Subcommittee on Citizens and Shareholders Rights and Remedies (1978, appendix A, pp. 267–268).
19 Gregory D. Squires and William Velez, 1987, “Insurance redlining and the transformation of an urban metropolis,” Urban Affairs Review, Vol. 23, No. 1, pp. 65–66. Crossref
20 Illinois, Indiana, Michigan, Minnesota, Ohio, and Wisconsin Advisory Committees to the United States Commission on Civil Rights, 1979, Insurance Redlining: Fact not Fiction, Washington, DC: United States Commission on Civil Rights, pp. 34–36, available online.
21 12 U.S.C. § 1749bbb-2(a)(4), quoted in Dwyer (1978, pp. 624–625).
22 President’s National Advisory Panel on Insurance in Riot-Affected Areas (1968, pp. 6–7).
23 12 U.S.C. § 1749bbb-9(a)(2), quoted in Dwyer (1978, p. 624).
24 President’s National Advisory Panel on Insurance in Riot-Affected Areas (1968, p. 10). Insurance redlining was widespread, even nearly a decade after many of the FAIR plans had been established; for instance, at a National Insurance Advisory Board meeting held on January 7, 1977, it was noted that “there seemed to be a general agreement that redlining (or ZIP CODE underwriting) is being practiced on a countrywide basis by most insurers,” as reported in that meeting’s minutes, quoted in United States Congress, Senate, Committee on the Judiciary, Subcommittee on Citizens and Shareholders Rights and Remedies (1978, p. 257).
25 Beryl Satter, 2009, Family Properties: How the Struggle over Race and Real Estate Transformed Chicago and Urban America, New York: Henry Holt / Metropolitan Books, pp. 335–337.


