

Introduction
Not every city in the U.S. has Chicago’s rich history of Black middle class neighborhoods. But as places in the city have become increasingly unequal, Black middle class neighborhoods have come to feel like an endangered species. The current pandemic is likely to make the challenges even more difficult. This article analyzes data on key aspects of the changes that have taken place in the last few decades in traditionally middle-income/middle class minority neighborhoods of Chicago. We find that while Black middle class neighborhoods on the South and West sides of Chicago have been in decline, they differ in terms of the economic hardship facing their populations. We also report on a variety of interventions that are helping to make these places neighborhoods of choice and opportunity. These strategies include businesses, nonprofits, and others investing in local talent and local assets to tell new stories about their neighborhoods; residents, by way of grass-roots efforts, advocating to create more responsive systems for safety and economic development; local intermediaries working with city and county government to support healthy housing markets; and a public sector committing to long-term investments in both the physical and commercial environment.
I. A discussion on prioritizing neighborhood investment
The vitality of middle class neighborhoods, including those home to large shares of ethnic/minority households, is one of the things that has made Chicago great over its history. Middle class neighborhoods, however, are on the decline across the United States, and in Chicago, the loss has been particularly striking within Black communities.
For a long time, many neighborhoods on the South and West sides of Chicago were places of choice for Black middle class families. Increasingly, however, the residents of these neighborhoods have had relatively less access to opportunities compared to middle class White neighborhoods. Data show that minority middle neighborhoods fall behind on several dimensions, including poverty exposure, school quality, and labor market engagement. These disadvantages have made minority middle neighborhoods more economically vulnerable, creating disincentives for residents to remain.
Research has shown that the segregation of opportunities and neighborhood (dis)amenity are associated with and/or account for net population loss, especially among middle class working age, and young adults and families with children in those communities.1 Neighborhoods with less opportunity face slower housing recovery and weaker housing markets. Within some metros, including Chicago, home values tend to remain flatter (or fall) in places where minority households tend to purchase homes. Researchers found that as of 2015, Chicago’s majority Black zip codes were twice as likely as majority White zip codes to have homes worth less than they were in 2004.2 In the Chicago metro, homes in neighborhoods with predominantly Black buyers in 2017 had average values 22 percent below 2006 levels.3
Likewise, the segregation of middle class job opportunities can be traced as far back as the 1960s, when researchers report that structural shifts in industries led to a loss of middle-skilled jobs in many neighborhoods.4 Today, the bulk of jobs in the city of Chicago are located in the Loop area or in North Side neighborhoods. For example, in 2016, up to 700,000 jobs were located within a 30-minute train or bus ride from the Loop and North Side, compared to just 50,000 jobs located within a 30-minute commute on public transit from the South Side.5 Unemployment has been a particular challenge to people in their early twenties. Around 40 percent of Black 20- to 24-year-olds in Chicago were out of work and out of school, compared with 7 percent of White young adults in that same age group, according to a Great Cities Institute report.6 Some researchers argue that the lack of economic opportunities is a cause of elevated youth violence that ravages neighborhoods on the South Side, reinforcing the cycle of disinvestment and displacement of businesses and population.7
Even so, it is important to recognize that communities on the South and West sides of Chicago are not a monolithic or an undifferentiated group in terms of economic hardship facing the population. While many poor families may live in these tracts, the neighborhoods have also been home to large shares of middle-income families as well as the top 20 percent of Black earners. These communities also have a greater number and percent of home purchase loans made to Black residents than other parts of the city.8 The challenge is how to make these places not only neighborhoods of choice, but also neighborhoods of opportunity. Understanding Chicago’s minority neighborhoods from analysis of data and cross-disciplinary research is therefore important to evaluate both the drivers of change and points of intervention to help support these communities.
In response to these challenges, the Federal Reserve of Chicago (with the Greater Chatham Initiative and the Metropolitan Planning Council) convened policymakers, practitioners, and researchers in a forum in November 2019 to engage in an informed discussion about investing in traditionally minority middle class neighborhoods, with the goal of identifying ways to safeguard the housing market, and retain and attract middle class residents. More specifically, the purpose was to consider actionable, place-based interventions to restore value to disinvested neighborhoods, and capture the benefit of investment for existing residents.
At the conference, a research panel featured experts who spoke to the geographic, economic, and social spaces that ethnic and minority populations have carved out in Chicago, and what forces have both fueled and challenged their success. A second panel of experts discussed issues facing the housing market. They discussed strategies that encourage residential demand in minority and low/moderate and middle-income markets, including activities, programs, and policies related to the disposition of vacant property; the promotion of homeownership; and the equitable assessment of property taxes. A third panel of experts focused on the importance of “place-keeping” and public safety, and efforts underway to increase commerce and investment so as to attract residents and visitors. This approach has been guided by new research calling on cities to make long-term investments (vs. short-term infusions) in economically weaker neighborhoods to generate transformative change.9 Investments in keeping with this strategy include infrastructure like parks, school buildings, and community development organizations that focus on housing and physical redevelopment to reduce signs of physical disorder,10 as well as the commercial environment and main street of a neighborhood so that businesses create accessible jobs for neighborhood residents.11 This strategy also calls for investments in public services relating to safety and policing strategies,12 the integration of formerly incarcerated individuals into the labor market, and resident organizations that engage and support homeowners and renters to facilitate greater social cohesion.13
We organize the reminder of this article into two main sections. The next section draws from data and research to describe key aspects of the changes taking place in traditionally middle-income/middle class minority neighborhoods of Chicago. This includes data that describes the residential sorting of Black middle class families; shifts in neighborhood income composition; and disparities in neighborhood characteristics, which show the correlation between segregation of neighborhood opportunities and loss of Black population across those neighborhoods. Part III summarizes insights we glean from conference participants on how to address these issues.
II. Data analysis
Residential sorting of Black middle class families
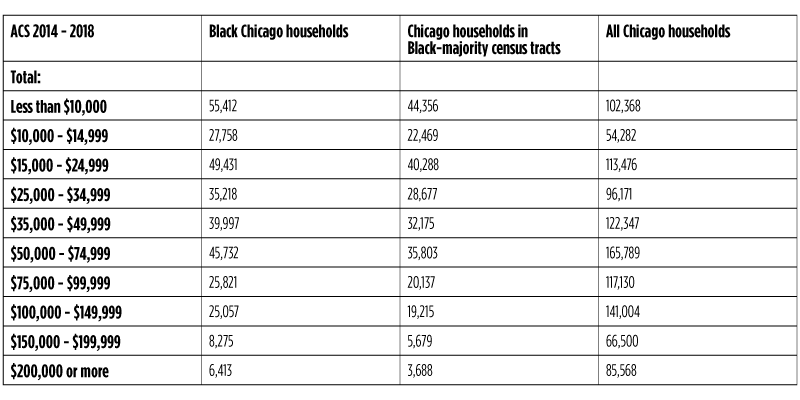
Neighborhoods on the South and West sides of Chicago are home to large shares of middle-income earners (figure 1). While median household income is lower for Black households than for other racial/ethnic groups in Chicago ($33,351 in 2018), more than 79 percent of Black households with incomes between $35,000 and $50,000 (a middle-income range) lived in a neighborhood in which at least half of the population is Black. In fact, three out of four Black households in Chicago earning above $75,000 lived in majority-Black neighborhoods as well (tables 1 and 2). These include communities such as Austin on the far West Side, and Roseland, Auburn Gresham, and South Shore on the South Side.
Figure 1. Location of Black middle class households in Chicago (2018)
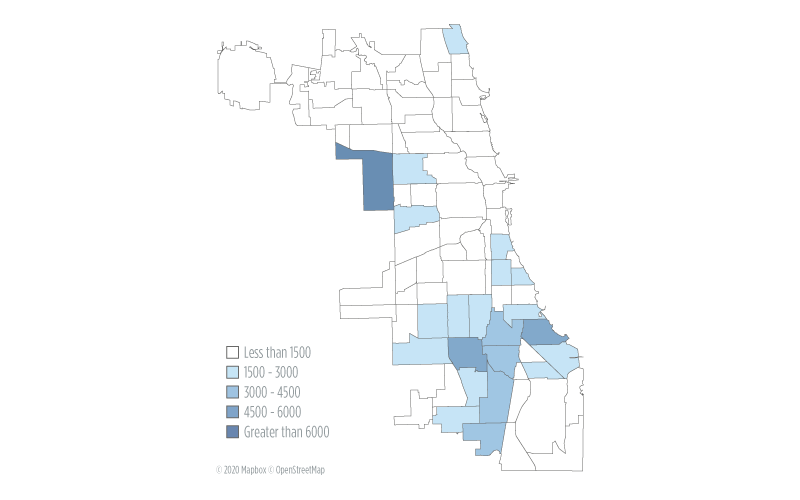
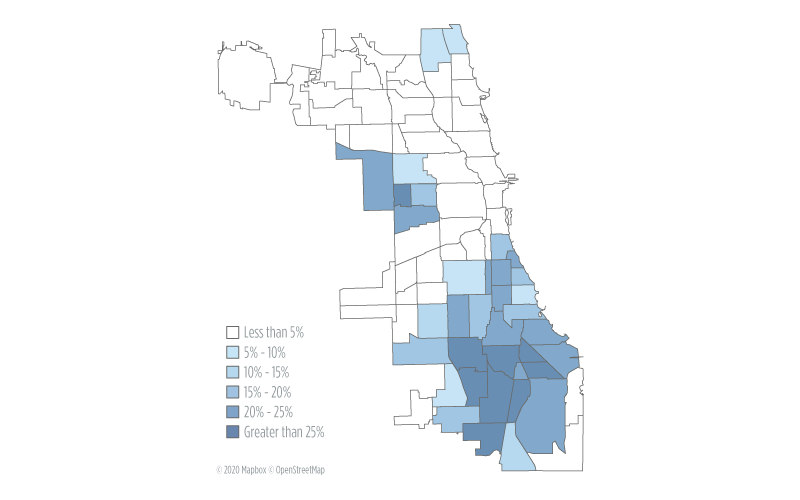
Table 1. Median household incomes in Chicago and Cook County
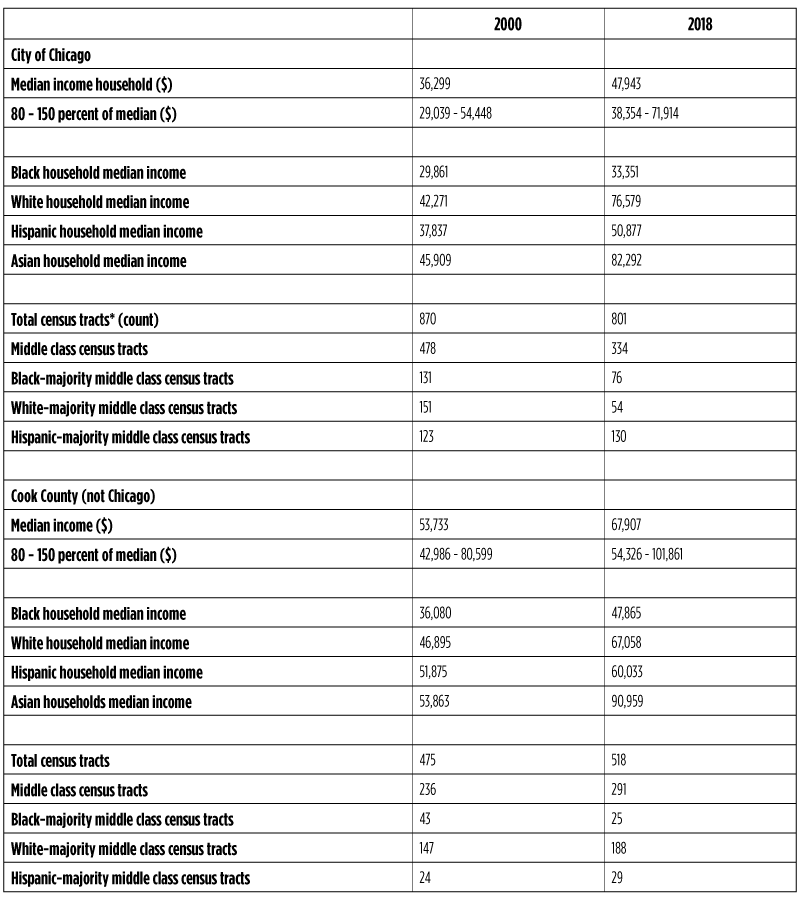
Table 2. Incomes of Black households and households in Black-majority census tracts in Chicago
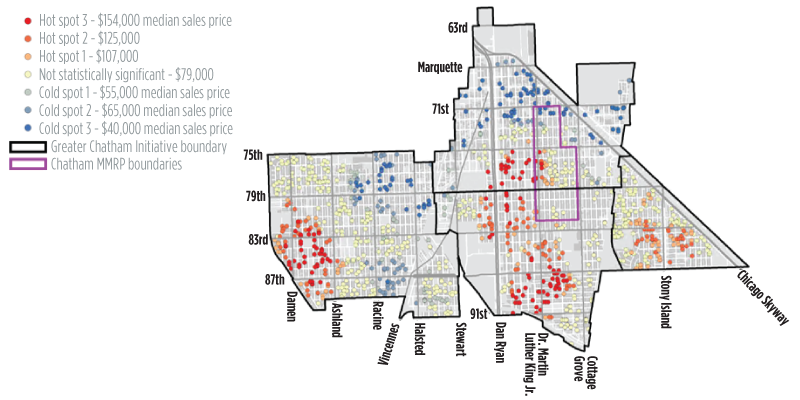
Likewise, South and some West side communities have greater numbers and shares of home purchase loans made to Black residents in the city (figure 2). Black homebuyers made up about 10 percent of home purchases in Chicago between 2012 and 2017;14 but two-thirds of all homebuyers in majority-Black neighborhoods were black. Otherwise put, 70 percent of all Black homebuyers in Chicago bought in majority-Black communities. An analysis of home sales at the community-area level also shows a range of home prices and sales activity in predominantly Black neighborhoods. While prices in many majority-Black areas of Chicago have yet to return to levels from before the 2008 recession, an analysis at the sub-community level shows emerging pockets of high demand. A study of the Greater Chatham area (Chatham, Auburn Gresham, Avalon Park, and Greater Grand Crossing) on the South Side, for example, shows several areas labeled as “hot spots” insofar as properties in these parts of the community are selling above the median per-square-foot price of the Greater Chatham area as a whole (figure 3).
Figure 2. Mortgage originations to Black homebuyers, top 20 Chicago community areas (2012-2017)
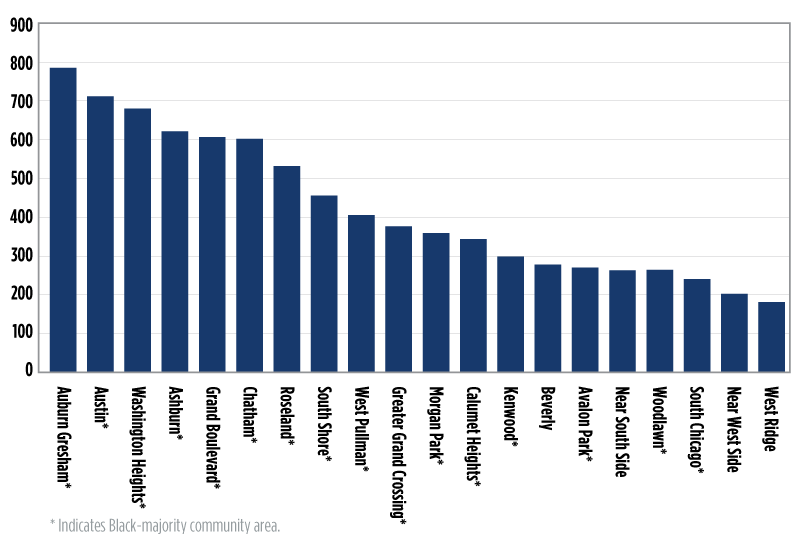
Figure 3. Hot spot analysis, 2018
This mix of housing markets, spanning from distressed to ‘hot,’ contradicts the image of the South and West sides as vast places of uniform desolation.15 While many Black middle class residents have migrated from Black neighborhoods, the majority of Black middle class households in Chicago continue to sort into Black-majority neighborhoods. These areas represent places of choice for people with a broad spectrum of educational attainment and socioeconomic status. As previous research has shown, nationwide, Black communities are somewhat unique in the degree to which Black families’ neighborhood selection is not necessarily predicated on the income level of residents.16 In addition to the social and cultural capital majority minority places offer families, these communities have the advantage of proximity to the city’s downtown, its amenities, and its jobs. An understanding of these patterns does more than correct for the negative stereotyping that reinforces disinvestment and the legacy of devaluation of Black places; these location patterns have implications for the role of placemaking policies. Persistent spatial sorting by race highlights the need to understand which policies are effective at creating long-run gains throughout diverse ethnic minority neighborhoods (Neumark and Simpson, 2015).
Shifts in household income composition of neighborhoods
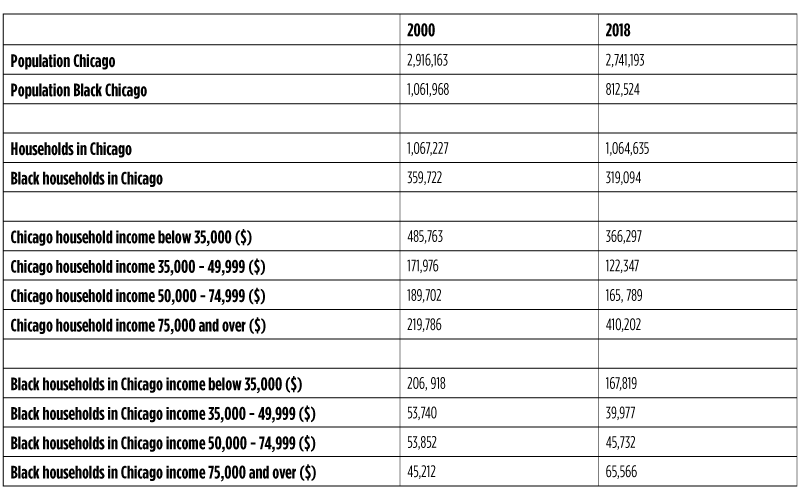
Between 2000 and 2018, Chicago lost almost 250,000 Black residents (table 3). This continues a trend of decline since the 1980s when the Black population of Chicago peaked at 1.2 million. Indeed, the outmigration of Blacks has played a large part in Chicago’s overall net (170,000+ person) population loss over this period.
Table 3. Black population and number of households in Chicago
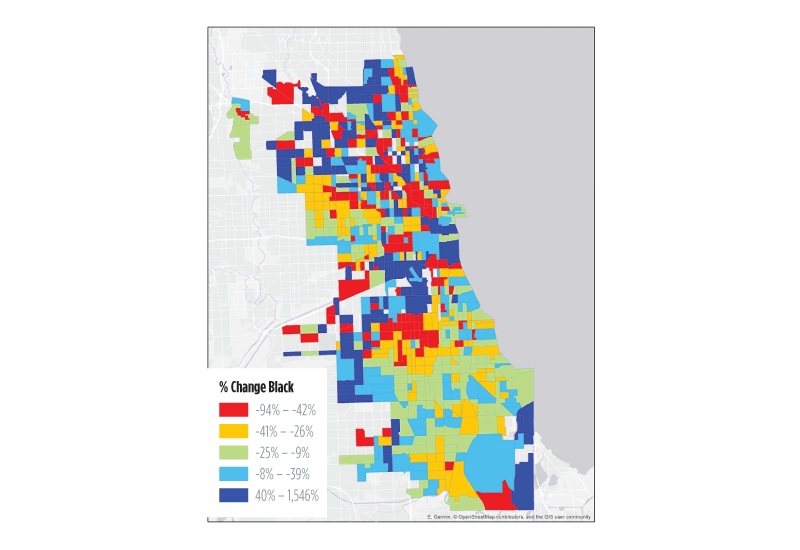
As it is known, some loss of Black neighborhood population has reflected a shift to other parts of the city and region. In the six counties that make up the Chicago metro, 901 census tracts gained Black population while 795 lost Black population (Cooper, 2019). In the city of Chicago, the predominantly Black community areas of Englewood, Chatham, Greater Grand Crossing, and South Chicago saw relatively large decreases in the overall number of households, with reductions of up to 25 percent in these neighborhoods (figure 4). The handful of majority-Black areas that gained population include Oakland and the Near South Side.17 Census tracts across the region that have gained Black population since 2000 have been associated with lower shares of poor families; lower shares of single parent households; and higher percentages of White, foreign-born, and Latino families.18
Figure 4. Percent Black population change in Chicago, (2000-2017)
The largest numbers of exiting Black households from the city have been those with incomes under $35,000; yet 40 percent of Black households exiting the city had middle class incomes between $35,000 and $75,000 as well (table 3). The number of Black households making $100,000 or more have increased modestly in the city, but nowhere near quickly enough to offset the losses. In addition, based on analysis of census data, those leaving are largely families with children. Black population losses in the city are almost entirely confined to two age ranges—35 to 54 and 19 and under (Zotti, 2019).
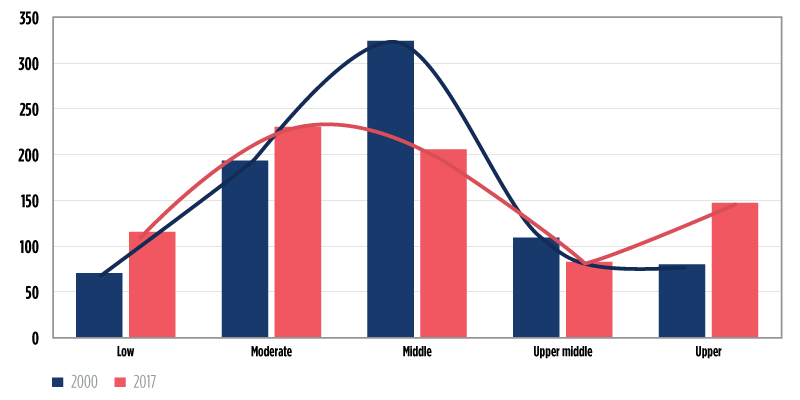
As a consequence, the landscape of neighborhoods has changed. According to analysis by Mallach (2019), Chicago has lost about a third of its “middle” neighborhoods since 2000. The share of middle- and upper-middle census tracts, with incomes at 80 percent to 150 percent of the city median, dropped from 55 percent to 37 percent of the city’s total. By contrast, the city’s low- and moderate-income census tracts, with incomes no higher than 80 percent of the city median, grew by about 30 percent. Meanwhile, upper-income neighborhoods, defined as at least 150 percent of the city median, expanded by 76 percent between 2000 and 2017 (figure 5).
Figure 5. Distribution of census tracts by income range 2000 and 2017
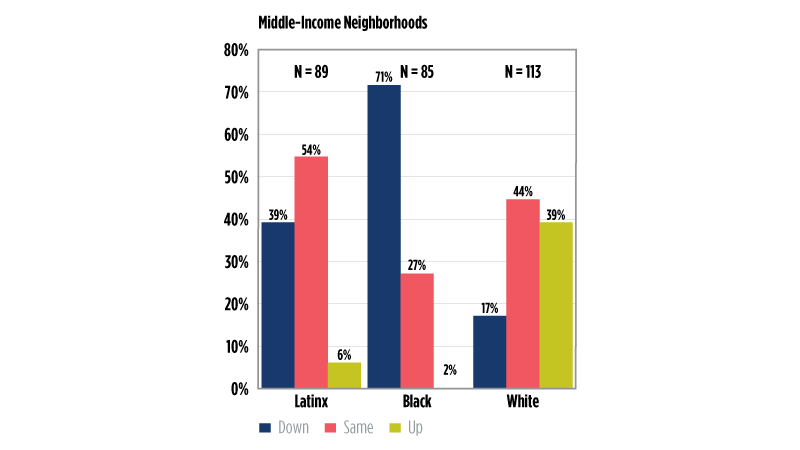
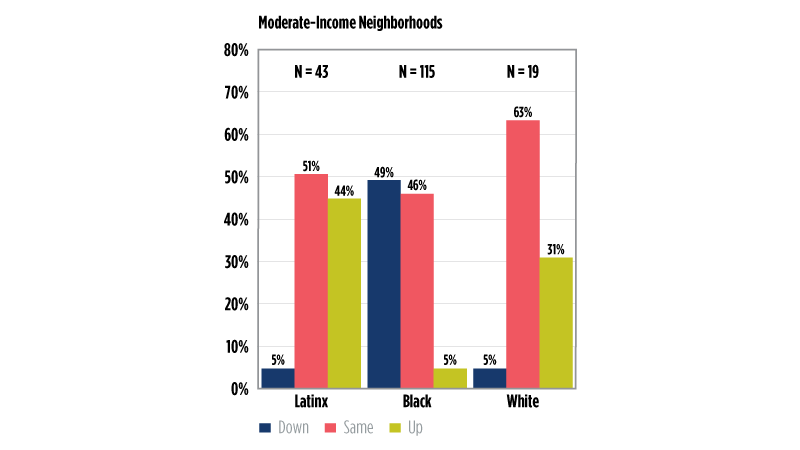
The squeeze of the middle has been tighter yet in majority minority neighborhoods. About a third (35 percent) of the census tracts that started as Black middle-income in 2000 remained middle-income by 2017, while 63 percent fell to low- or moderate-income (figure 6).19 Only 2 percent of Black middle-income census tracts moved upward. This is a clear contrast with predominantly White middle class neighborhoods. Almost 40 percent of the predominantly White middle class neighborhoods had moved upwards between 2000 and 2017, and had become upper middle or upper-income neighborhoods. Predominantly Hispanic neighborhoods were in-between, although relatively few of them moved upwards and more had stayed stable in the middle.
Figure 6. Trajectories of neighborhoods, 2000-2017
Put differently, about 10 percent of both census tracts (76/801) and community areas (8/77) in Chicago were both “middle class” (80 percent to 150 percent of median income) and majority-Black as of 2018. By contrast, in 2000, 15 percent of census tracts and 19 percent of community areas were Black middle class places. In 2018, Hispanic-majority tracts were more likely to be middle class in Chicago than either majority-Black tracts or majority-White tracts. In greater Cook County (not including Chicago), 56 percent of census tracts were middle class compared to 42 percent in the city of Chicago, but majority-Black tracts were still a small share of those in 2018. Outside of the city, about 65 percent of middle class tracts had a majority-White population.
Segregation of neighborhood opportunities
Middle class status differs for many Black neighborhoods insofar as it does not translate as directly into spatial advantage and spatial separation from high-poverty areas. Sociologists including Pattillo (2005), Logan (2011), Sharkey (2014), and others have noted that minority middle class households live in markedly less affluent neighborhoods than their middle class White peers.20 Non-poor Blacks live in neighborhoods with lower socioeconomic status, higher crime, lower property values, more pollution, and more physical blight than Whites with similar economic status.21 In Chicago, for example, affluent Blacks (with incomes above $75,000) lived in neighborhoods more than twice as poor as the average White household (17.9 vs. 8.3) between 2005 and 2009. Affluent Hispanics too lived in poorer neighborhoods than did average White households, although there were less extreme values for Hispanic households than for Black households, and there were more cases where affluent Hispanics lived in neighborhoods whose poverty level was fairly close to that of the average White neighborhood.22
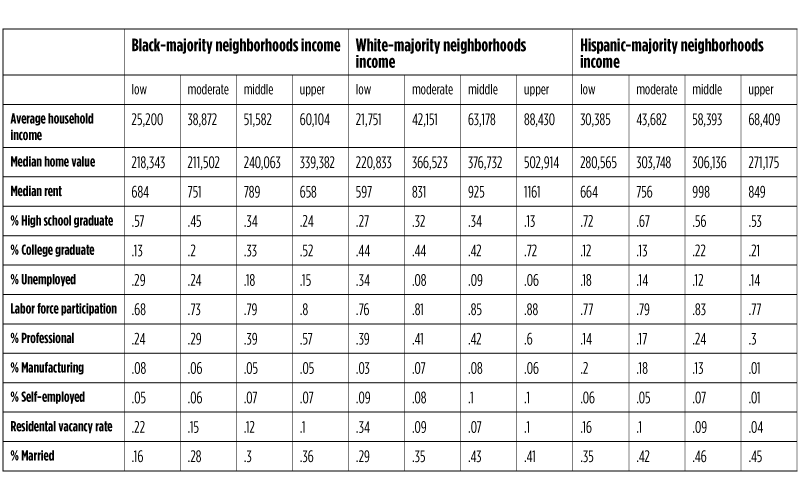
Our analysis of the city of Chicago data from the census ACS shows that not just low- to moderate-income, but also middle-income Black neighborhoods lag behind White counterparts in terms of most socioeconomic and labor market measures. Middle-income Black neighborhoods show a relative disadvantage in educational attainment, employment, home values, and residential occupancy rate (table 4).
Table 4. Socioeconomic and labor market measures of neighborhoods in the city of Chicago
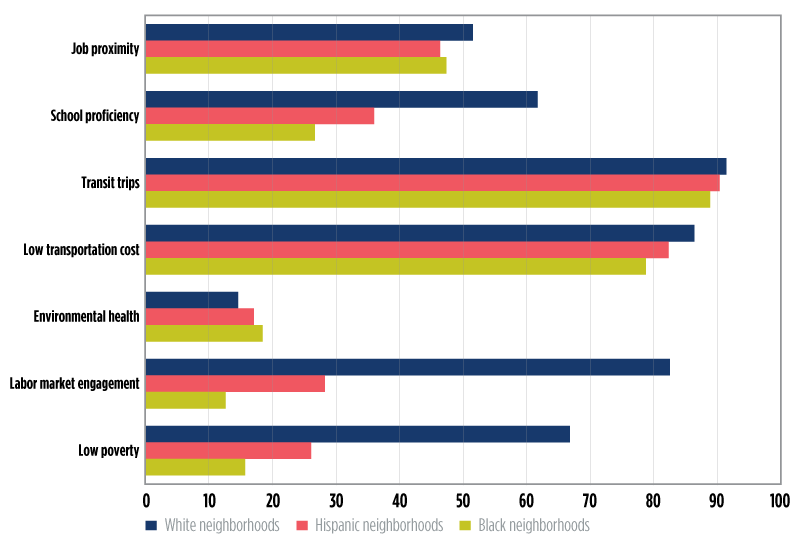
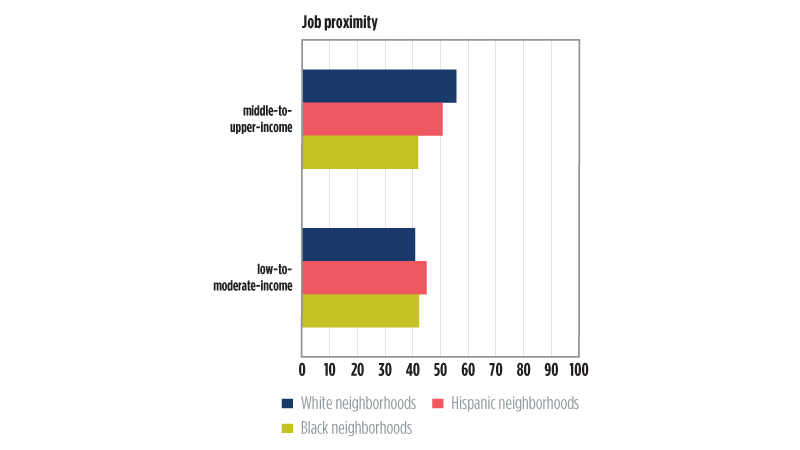
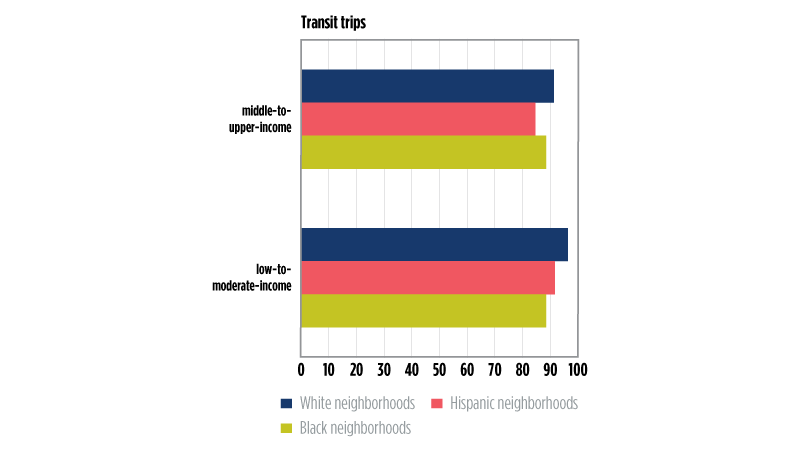
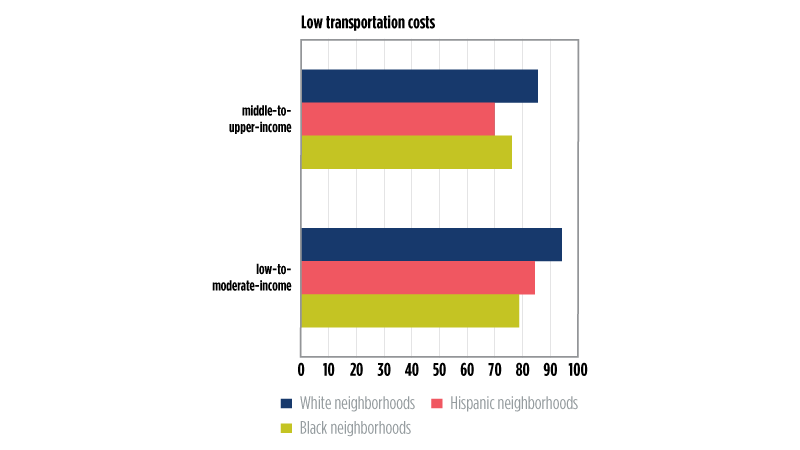
Further, across all income levels, predominantly Black (and Hispanic) neighborhoods tend to have relatively less access to opportunity compared to predominantly White neighborhoods. We define “neighborhood opportunity” as a series of measures related to jobs, education, transportation, and environment health. Figure 7 reports indices of those opportunity indicators for the city of Chicago. (The x-axis in the figures shows indices ranging from 0 to 100, where the closer to 100, the higher the “opportunity”). The results show that the largest gap in opportunity for residents of Black and Hispanic neighborhoods relates to low poverty exposure. In addition, we find gaps in opportunity in terms of the intensity of labor market engagement and school quality. The differences related to transportation accessibility are less significant, as these indices are relatively high for all neighborhoods in the city. The disparity in terms of job proximity (with respect to the larger region or larger employment center) is also relatively small across neighborhoods of different races and ethnicities.
Figure 7. Access to neighborhood opportunities in Chicago
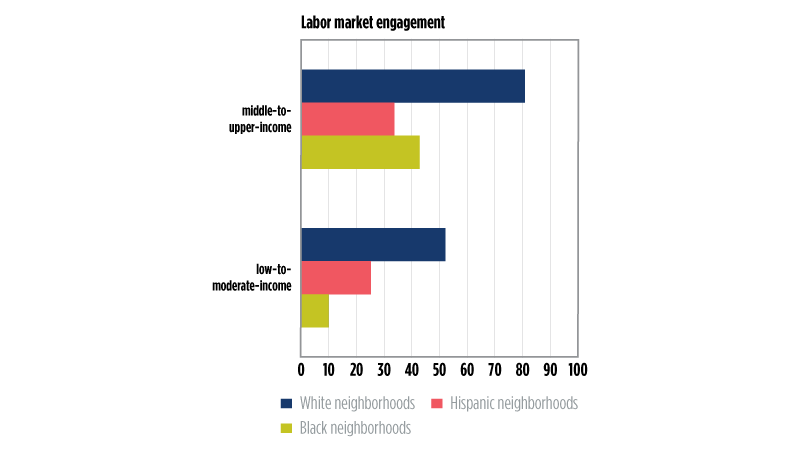
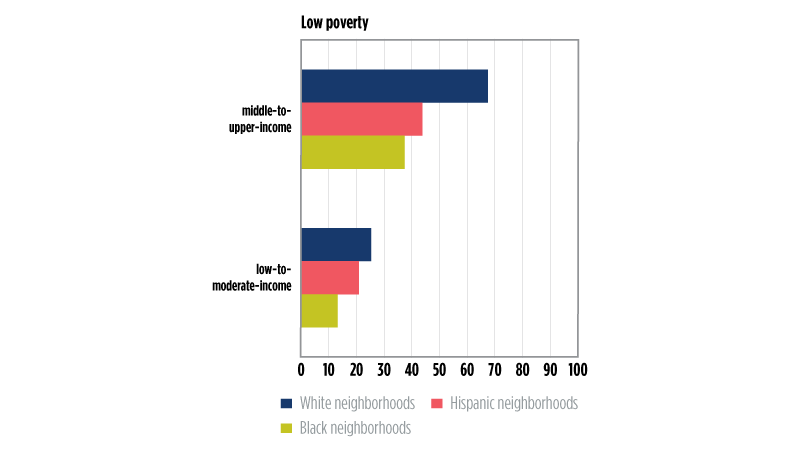
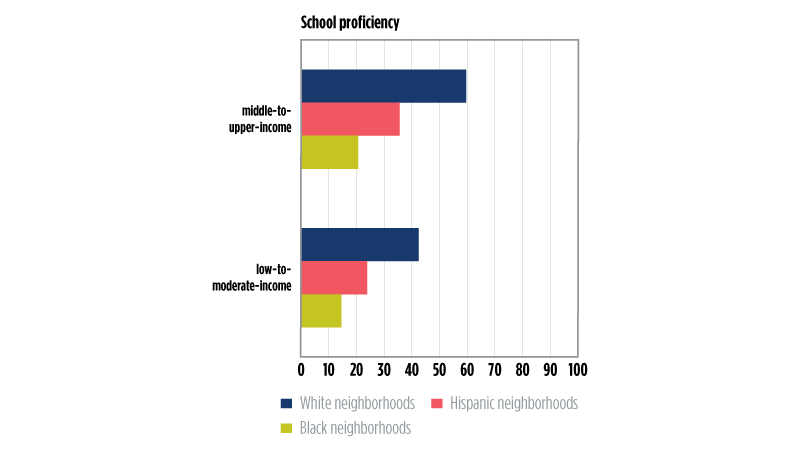
When we analyze further opportunity indices by neighborhood income (low/moderate vs. middle/upper income), the results show that ethnic/racial disparities persist, even for more affluent neighborhoods (figure 8). If we compare those opportunity measures, based on the ratio of these indices as reported in the figures, middle/upper-income Black neighborhoods are only about half as likely to have opportunities in terms of low poverty exposure and labor market engagement, relative to White neighborhoods. In terms of school quality/proficiency index, Black middle class neighborhoods are just above one-third that of White middle class counterparts.
Figure 8. Access to opportunities by neighborhood race/ethnicity and income class
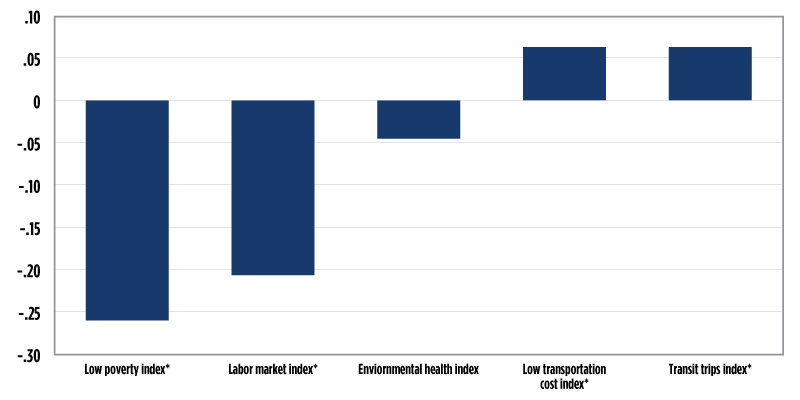
Finally, we conduct a brief analysis between the census tracts in the city of Chicago that have lost Black population between 1990 and 2010 with various neighborhood opportunities indicators to gauge a potential relationship between those factors and residential stability. Consistent with previous research, we find a significant negative relationship between a place having lower poverty and higher labor market engagement, and a loss of Black households (figure 9). In other words, places with more employment and lower poverty are associated with less population loss. We also see a significantly positive relationship between transit trips (public transportation availability) and low transportation costs, and a loss of Black households.
Figure 9. Correlation between Black population decline and neighborhood opportunities in the city of Chicago
The inequality of opportunity in Chicago neighborhoods, even those that are middle- and upper-income, gives credence to the idea that middle class status means something different for Blacks in predominantly Black neighborhoods. In general, majority-Black communities, which are home to economically-mixed Black households, face unique challenges in being able to offer residents the same access to jobs and middle class amenities as in non-Black neighborhoods. To the extent that – as a growing body of research has shown – the neighborhood one lives in affects one’s well-being and ability to thrive (Chetty et al., 2018; Turner and Gourevitch, 2017), residents of all incomes in majority-Black neighborhoods may be disadvantaged by greater exposure to poverty and less access to labor market opportunities and higher-quality schools.
III. Insights and recommendations from panelists
We now turn to recommendations from the participants at the forum. We organize the recommendations into four main themes, which are 1) to generate positive narratives about place; 2) to create mechanisms to promote collective efficacy; 3) to support policies that aid a healthy housing market; and 4) to make “catalytic” public-sector investments. While panelists spoke from differing perspectives, these themes reflect a consensus that a combination of personal ownership, an embrace of cultural assets, community collaboration, and investment in infrastructure are needed to alter the trajectory of minority middle class neighborhoods.
Generate positive narratives about place
According to panelists, an important challenge for many (current and former) minority middle class neighborhoods relates to the messaging around and perceptions about place. For people to want to put themselves in the neighborhood, they need to have confidence about the investment. This is why the stories that people tell about their neighborhoods influence decisions about whether to stay or go, whether to send kids to neighborhood schools, and whether to get involved in communal life.24 Part of the work for organizations supporting minority middle class neighborhoods is to make people feel that staying or moving in is a logical decision. It is to give people assurance that the investments they are making will pay off.
As panelists noted, narratives of place are based, in part, on what people think about their physical surroundings. For this reason, many advocates of (current and former) minority middle class neighborhoods make a point of highlighting the infrastructure and amenities that are easily accessible to residents and businesses. They make note of the houses and apartments that cost less than in other neighborhoods, the ability to get downtown on public transportation, the nearby parks and beaches, the freight rail and interstate highways access, and the large tracts of under-utilized land for industrial and manufacturing purposes. The relationship between the physical environment and the neighborhood narrative informs the way that organizations like the Greater Chatham Initiative practice “tactical urbanism.” In addition to promoting the historic bungalows and well-rated public elementary schools, the Greater Chatham Initiative upgrades sidewalks to encourage outdoor dining spaces, commissions murals to beautify boarded-up walls, and organizes seasonal events to enhance the images that people see every day. These organizations recognize that the quality of material assets figures not only into the calculation of property values, but into the level of satisfaction felt by neighborhood residents.
Narratives also evolve from the sense of community that people derive from interacting with their neighbors. This insight, offered by panelists, helps explain why organizations like The Silver Room in Hyde Park, and Urban Juncture in Bronzeville, invest heavily in placemaking (and place-keeping) activities as a way to build networks and confidence in their communities. The Silver Room is ostensibly a retail store, but it functions as a space for art exhibitions, fashion shows, and book signings. Urban Juncture manages a business incubator, a shipping container “mall” and a community garden. The mission of both organizations is to counter a deficit view of minority neighborhoods. Urban Juncture has worked for over a decade to set up artistic and commercial attractions on a stretch of 51st Street that had been virtually abandoned. The Silver Room has grown its annual block party into an extravaganza drawing 50,000 or more. These efforts go beyond improving the streetscape. As panelists explained, celebratory spaces that reflect the tastes and culture of the surrounding population are designed to give residents a greater sense of belonging. Building an infrastructure for emerging entrepreneurs, or giving vendors a chance to sell at local events, has an inspirational quality that makes people ask what else can be done for the community. The creation of economically productive and culturally-relevant spaces raises the profile of local talent and gives people a new lens to interpret the assets of place.
Create mechanisms to promote collective efficacy
Invoking the South Shore neighborhood of the 1970s and 1980s, panelists issued a reminder of what neighborhoods can accomplish through collective efficacy. In that era, the largely minority middle class residents of South Shore managed to prevent the South Shore Bank from abandoning the neighborhood; they stopped the city from tearing down the South Shore Country Club; and they voted to close taverns on 75th Street and the surrounding blocks.25 These accomplishments were made possible by individuals leveraging their self-interest into community action. Homeowners and business people fought for these causes because preserving the reputation of their neighborhood, and being part of a middle class place, were at the core of their identities.
Although collective efficacy has waned in many current and former middle class neighborhoods, a number of nonprofits are attempting to harness the power of vigorous public engagement to promote community oversight and self-determination. The Little Village Environmental Justice Organization, for example, is funneling the collective will of its residents to push back against the siting of pollution-producing industry facilities in its neighborhood. As its executive director explained, the purpose of this advocacy is to usher in a different kind of economic opportunity that helps residents achieve a middle class life. While the city has indicated that it promotes diversified job creation by rezoning industrial land, many of the places that the city has designated as industrial receiving corridors are also neighborhoods with the greatest exposure to air pollution and other environmental health hazards.26 The message from the Little Village Environmental Justice Organization is that advocates can do more than call out the policies they do not like. To support minority middle class communities, advocates must get a seat at the economic planning table and put themselves in position to exert their will onto the community.
The Policing Project, a multi-city initiative focused on police accountability, is another type of organization that gives the community an oversight role in improving individual quality of life.27 Piloted in a handful of areas in Chicago, The Policing Project sets up a formal framework for residents to channel concerns and demands as they relate to neighborhood public safety. As panelists explained, the disconnect between law enforcement and the community is often reinforced by traditional administrative structures. The job of a patrol officer is distinct from someone in a specialized unit, which is distinct from someone in plain clothes, and so on. The Policing Project turns this model upside down by setting up multiple points of contact between officers and members of a community. Two officers are assigned to work in a particular neighborhood and encourage neighbors to reach out to them directly to get the services they need. In this way, neighborhood policing decisions flow not from the desks of supervisors or district officers, but from coordination between the people and the officers in the community. To be sure, cultivating this kind of trust involves building upon social networks within the community itself. But, according to panelists, it is a model that requires officials to listen to how the community wants to be policed, and by extension, to respond in a way that is expected and pre-determined by the community.
Modify tax policy to preserve homeownership
The hope for many advocates of middle minority neighborhoods is that residents will stay in their homes, new buyers will be attracted to their neighborhoods, and investments in homeownership will pay off. Making subsidy available for repairs and upkeep, legalizing accessory dwelling units, and re-examining criteria for creditworthiness are some of the housing-related recommendations that panelists offered for expanding homeownership in middle neighborhoods. Panelists also saw a role for nonprofits to organize homebuyer trolley tours, realtor information sessions, and other events to broaden exposure to the housing market, as other cities have done to attract people to middle class neighborhoods. As a general matter, many of the experts agreed that the sheer quantity of under-utilized land in Chicago allows for the potential of a large-scale public sector-led intervention. The re-establishment of the Department of Housing gives an impetus for the city to study the scope of resources required to transform vacant city-owned land in a way that is sensitive to the context of all neighborhoods.
Panelists also suggested that much could be gained from reforms to the system of property taxation. Some advocated for the creation of a Community Land Trust, a vehicle for subsidizing homeownership, to make properties more affordable to both prospective buyers and existing homeowners.28 Likewise, panelists suggested the creation of a ‘Community Preservation Zone’ that would allow property tax exemptions at the neighborhood level in certain parts of the city. As panelists spun the idea, the exemption would apply to long-time residents of a neighborhood, it would accrue with the number of years living in the same place, and it could potentially be passed down to the next generation of the same family.
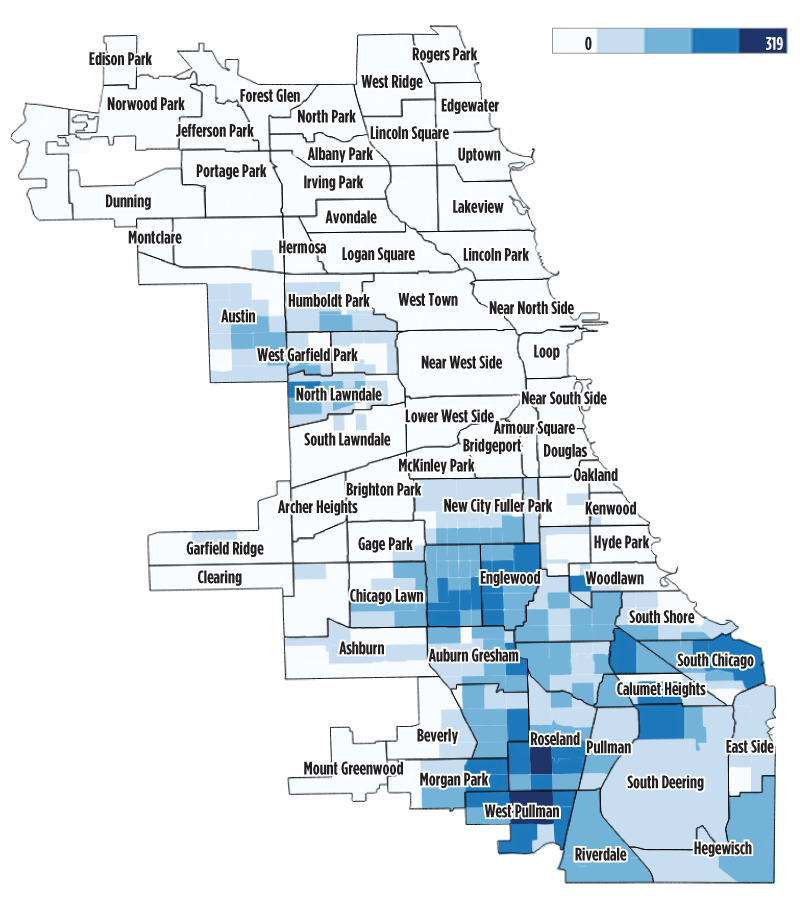
Panelists took particular aim at the county’s system of tax sales, also referred to as “scavenger” sales. The current system, according to presenters, works against the goal of helping long-time residents stay in their homes. First, the county makes it more difficult for property owners to get current on tax debts by requiring that the balance be paid in its entirety, while penalty interest and fees continue to accrue with partial payments. Second, a system which relies on property tax buyers to compensate for the shortfall in taxes paid29 is vulnerable to abuse, allowing tax buyers to demand homeowners pay as high as 18 percent in interest on their debt (to the tax buyer). Third, the county is permitted to auction underlying properties after three unsuccessful attempts to sell the taxes. Since tax buyers are less likely to buy debts in lower-income neighborhoods, investors can often pick up tax-delinquent properties in these places for pennies on the dollar. Finally, the system results in property ownership becoming increasingly cloudy. By permitting tax buyers to trade their tax certificates in the market, the chain of transactions makes it difficult to establish clear title, and further complicates the process of turning around vacant properties for redevelopment. In 2019, for example, 13,670 homes in Chicago were listed in the city’s tax sale, disproportionately concentrated on the city's South and West sides (figure 10).30
Figure 10. Residential properties for tax sale
Overall, panelists highlighted the importance of ensuring a system of fair property tax assessments in minority neighborhoods, insofar as previous research has shown broad-based, regressive taxation (practices) in lower-priced areas of the city.31 In addition, panelists suggested that better-formulated repayment plans could lower costs for delinquent homeowners, which in turn could help the county improve the accuracy of its cash flow projections. More predictable tax collections may help the county find lower-cost sources to fund the tax shortfall (i.e., the capital markets), as is done in many other states. As a broader point, discussion participants noted the importance of transparency and communication regarding the tax-sale system.
Make catalytic public sector investments
Public-sector investment may not be a groundbreaking idea when it comes to supporting neighborhoods, but prioritization and alignment have become buzzwords in the city’s latest plan to revitalize the South and West sides. That was the message of Commissioner Maurice Cox in explaining INVEST South West, a $750 million initiative for taking action in under-invested neighborhoods. “Prioritization” means concentrating investment so as not to spread the funds too thin. “Alignment” refers to the participation of twelve city departments that are apportioning part of their budgets to this project, and which are responsible for planning and coordinating assignments across city agencies. The ten neighborhoods first-in-line are Englewood, Auburn Gresham, North Lawndale, Austin, Humboldt Park, Quad Communities, New City, Roseland, South Chicago, and South Shore.
Table 5. Neighborhoods designated for INVEST South West Initiative
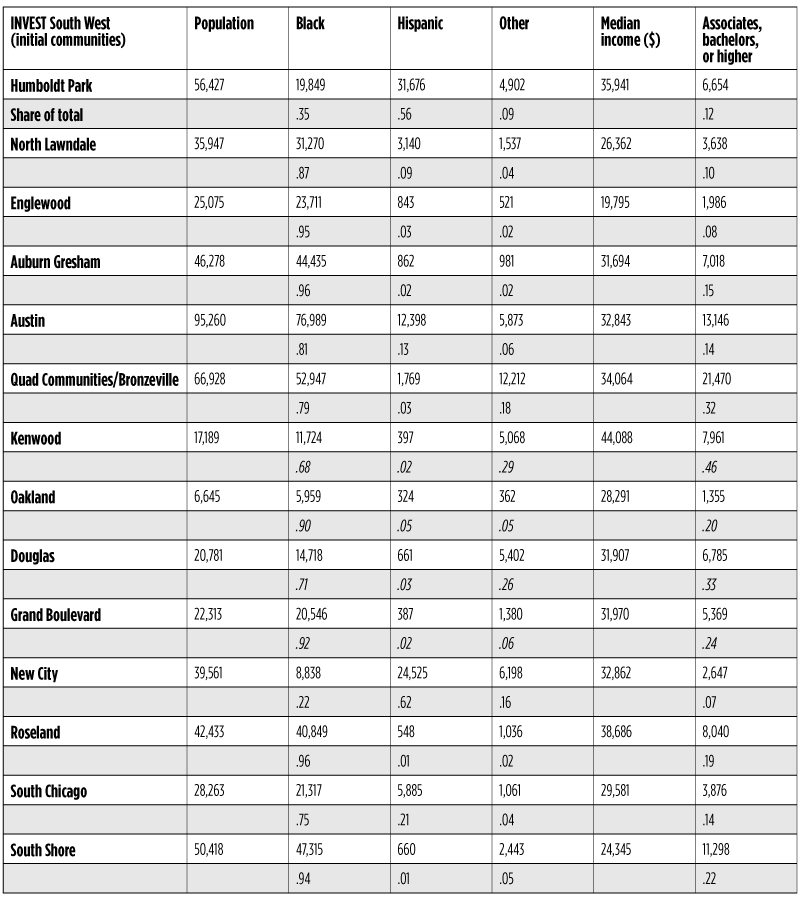
To be sure, the scope of the city’s initiative is broader than a middle neighborhood agenda. The ten areas taking part in the roll-out are a diverse group, with median incomes ranging from less than 50 percent to more than 80 percent of the Chicago median. Education levels also vary widely, ranging from 8 percent to 32 percent of the community population with at least an associate’s degree. (About 29 percent of the citywide population has at least an associate’s degree.) The criteria for selection, according to the city, include places that have at least one active commercial area, places where a community-based organization has a proven track record, and places where the community has already completed some type of quality of life plan.32
Nonetheless, the initiative meshes with the goal of revitalizing minority middle class neighborhoods. The initial focus is on “re-activating” commercial corridors that historically served as entry points into these neighborhoods. These corridors are (or have the potential to be) gathering spots for local businesses, pedestrian activity, access to transportation and quality of life amenities. The city’s plan includes repurposing empty storefronts to pair these spaces with transit-accessible, affordable housing. The city is also casting a wide net when it comes to securing the money to complete this work. As the commissioner noted, the city is hoping that public funds will leverage resources from community development financial institutions, philanthropies, banks, and corporations. Ultimately, with this high-profile initiative, the city is sending a message that it has the political will, at least at the moment, to draw resources back to these communities.
IV. Conclusion
Not every city in the U.S. has Chicago’s rich history of minority middle class neighborhoods. But as the neighborhoods of Chicago have become increasingly unequal, the middle class has come to feel like an endangered species, particularly in minority communities. The recent pandemic is likely to make the challenges even more difficult. Neighborhoods where homeownership rates and home values are already lower may find themselves even more vulnerable to housing market shocks. Neighborhoods with less vibrant small business sectors may find that these businesses have fewer resources to withstand a period of economic loss, and fewer relationships with bankers to access the funds that the government and other entities have made available. Neighborhoods with large shares of working class households, including those in the health care sector and other essential services, may also find themselves disproportionately exposed to the risk of contagion.
A “one-size fits all” strategy, particularly in the current environment, is therefore unlikely to reverse the decline of minority middle class neighborhoods. Minority middle class neighborhoods will likely need to pull from a variety of place-based interventions. These include jobs programs for particular workers; partnerships between large anchor institutions and area small businesses; and, if the public budgets allow, the physical redevelopment of neighborhood infrastructure like parks, school buildings, and community development organizations. In addition, as forum participants suggested, some improvements may result from more intensive marketing of the local housing stock. Some may come from reforms to the property tax system. Some may come from supporting organizations that build social networks within communities. Some may come from better coordination between public and private sector investors, including the designation of a lead organization or point person to marshal the necessary resources into selected neighborhoods. And some may come by changing perceptions of risk and value in minority neighborhoods. Regardless of the approach, forum participants made clear that a guiding principle of any strategy must be to trust the talent and vision of community members. The design of any intervention must work to minimize displacement and ensure that the future benefit and value of investments are captured by existing residents.
SOURCES
Aliprantis, D., and D. R. Carroll, 2018, “Neighborhood dynamics and the distribution of opportunity,” Quantitative Economics, Vol. 9, pp. 247–303.
Anderson, M. B., and C. Sternberg, 2012, “Non-White Gentrification in Chicago’s Bronzeville and Pilsen: Racial Economy and the Intraurban Contingency of Urban Redevelopment,” Urban Affairs Review, Vol. 49, Issue 3, pp. 435–467, available at https://journals.sagepub.com/doi/abs/10.1177/1078087412465590?journalCode=uarb.
Badger, E., 2012, “How Black Gentrifiers have Affected the Perception of Chicago’s Changing Neighborhoods,” Bloomberg CityLab, available at https://www.citylab.com/equity/2012/12/how-black-gentrifiers-have-affected-perception-chicagos-changing-neighborhoods/4233.
Baum-Snow, N., and D. Harley, 2016, “Accounting for Central Neighborhood Change, 1980-2010,” Federal Reserve Bank of Chicago, working paper, No. 2016-09, available at https://www.chicagofed.org/publications/working-papers/2016/wp2016-09.
Baum-Snow, N., D. Harley, and K. O. Lee, 2019, “The Long-Run Effects of Neighborhood Change on Incumbent Families,” Federal Reserve Bank of Chicago, working paper, No. 2019-02, available at https://www.chicagofed.org/publications/working-papers/2019/2019-02.
Berry, C., “Estimating Property Tax Shifting Due to Regressive Assessments: An Analysis of Chicago, 2011 to 2015,” University of Chicago, Harris Public Policy, Center for Municipal Finance.
Büchel, K., D. Puga, E. Viladecans-Marsal, and M. von Ehrlich, 2019, “Calling from the outside: The role of networks in residential mobility,” working paper, wp 2019_1909, CEMFI.
Chetty, Raj, Nathaniel Hendren, Maggie R. Jones, and Sonya R. Porter, 2018, “Race and Economic Opportunity in the United States: An Intergenerational Perspective,” working paper, Cambridge, MA: Equality of Opportunity Project.
Cooper, Daniel, 2019, “Our Equitable Future: Delivering on the Promise of a City of Neighborhoods,” Metropolitan Planning Council, September 4, available at https://www.metroplanning.org/news/8771/Our-Equitable-Future-Delivering-on-the-Promise-of-a-City-of-Neighborhoods.
Cordova, T. L., and M. D. Wilson, 2017, “Abandoned in their Neighborhoods: Youth Joblessness amidst the Flight of Industry and Opportunity,” Great Cities Institute, University of Illinois at Chicago, available at https://greatcities.uic.edu/2017/01/29/abandoned-in-their-neighborhoods-youth-joblessness-amidst-the-flight-of-industry-and-opportunity.
Cordova, Teresa, Matthew Wilson, and Jackson Morsey, 2016, “Lost: The Crisis of Jobless and Out of School Teens and Young Adults in Chicago, Illinois and the U.S.,” Great Cities Institute, University of Illinois at Chicago.
De Coster, S., K. Heimer, and S. M. Wittrock, 2006, “Neighborhood Disadvantage, Social Capital, Street Context, and Youth Violence,” The Sociological Quarterly, Vol. 47, No. 4, pp. 723–753.
Galster, George, 2016, “The Case for Intervention in Middle Neighborhoods,” On the Edge: America’s Middle Neighborhoods, ed Paul C. Brophy, The American Assembly and the Federal Reserve Bank of San Francisco: New York.
Institute for Housing Studies at DePaul University, 2016, “The Uneven Housing Recovery Is More Uneven for Some,” July, available at https://www.housingstudies.org/blog/uneven-housing-recovery-more-uneven-some.
Jain, S., and A. K. Cohen, 2013, “Behavioral Adaptation Among Youth Exposed to Community Violence: A Longitudinal Multidisciplinary Study of Family, Peer and Neighborhood-Level Protective Factors,” Prevention Science, Vol. 14, No. 6, pp. 606–617.
Landry, B., and K. Marsh, 2011, “The Evolution of the New Black Middle Class,” Annual Review of Sociology, 37:373-94.
Logan, John R., 2011, “Separate and Unequal: The Neighborhood Gap for Blacks, Hispanics and Asians in Metropolitan America,” Russell Sage Foundation American Communities Project of Brown University, July.
Mallach, A., 2019, presentation at the conference, Preserving Chicago’s Middle Neighborhoods, Federal Reserve Bank of Chicago, November 15.
Neumark, D., and H. Simpson, 2015, “Place Based Policies,” Chapter 18 in Handbook of Regional and Urban Economics, Vol. 5, pp. 1197–1287
Ottenberg, E., 2019, “Gentrification, School Closings, and Displacement in Chicago,” The American Prospect, available at https://prospect.org/education/gentrification-school-closings-displacement-chicago.
Pattillo, M., 2005, “Black Middle-Class Neighborhoods,” Annual Review of Sociology, Vol. 31:305-329.
Rotella, C., 2019, The World is Always Coming to an End: Pulling Together and Apart in a Chicago Neighborhood, University of Chicago Press 2019.
Seal, D., A. Nguyen, and K. Beyer, 2014, “Youth Exposure to Violence in an Urban Setting,” Urban Studies Research, Vol. 2014, Article ID 368047, available at https://www.hindawi.com/journals/usr/2014/368047.
Turner, Margery Austin, and Ruth Gourevitch, 2017, “How Neighborhoods Affect the Social and Economic Mobility of Their Residents,” Washington, DC: US Partnership on Mobility from Poverty, Urban Institute.
Sharkey, Patrick, 2013, Stuck in Place: Urban Neighborhoods and the End of Progress toward Racial Equality, Chicago: University of Chicago Press.
Sharkey, Patrick, 2014, “Spatial Segmentation and the Black Middle Class,” American Journal of Sociology, Vol. 119, No. 4, pp. 903–954. JSTOR, available at www.jstor.org/stable/10.1086/674561.
Sharkey, Patrick, 2018, Uneasy Peace: The Great Crime Decline, the Renewal of City Life, and the Next War on Violence, New York: W.W. Norton.
van der Klaauw, W., G. Koșar, and T. Ransom, 2019, “Understanding Migration Aversion Using Elicited Counterfactual Choice Probabilities,” Federal Reserve Bank of New York Staff Report No. 883, April.
Robert Weissbourd, 2016, “Understanding Middle Neighborhoods as Vital Parts of Regional Economies,” On the Edge: America’s Middle Neighborhoods, ed Paul C. Brophy, The American Assembly and the Federal Reserve Bank of San Francisco: New York.
Zonta, Michela, 2019, “Racial Disparities in Home Appreciation,” Center for American Progress, July, available at https://cdn.americanprogress.org/content/uploads/2019/06/27074704/BorrowersOfColor-report.pdf.
Zotti, E., 2019, “Chicago is losing its black middle class. Can it get it back? Chicago Sun-Times, available at https://chicago.suntimes.com/crossroads/2019/10/4/20895771/chicago-losing-black-middle-class-ed-zotti-city-crossroads.
NOTES
1Aliprantis, D., and D. R. Carroll, 2018, “Neighborhood dynamics and the distribution of opportunity,” Quantitative Economics, Vol. 9, pp. 247–303. Baum-Snow, N., and D. Harley, 2016, “Accounting for Central Neighborhood Change, 1980-2010 (Revised November 2019),” Federal Reserve Bank of Chicago, working paper, No. 2016-09, available at https://www.chicagofed.org/publications/working-papers/2016/wp2016-09. Baum-Snow, N., D. Harley, and K. O. Lee, 2019, “The Long-Run Effects of Neighborhood Change on Incumbent Families,” Federal Reserve Bank of Chicago, working paper, No. 2019-02, available at https://www.chicagofed.org/publications/working-papers/2019/2019-02.
2Institute for Housing Studies at DePaul University, 2016, “The Uneven Housing Recovery Is More Uneven for Some,” July 26, available at https://www.housingstudies.org/blog/uneven-housing-recovery-more-uneven-some.
3Zonta, M., 2019, “Racial Disparities in Home Appreciation,” Center for American Progress, July, available at https://cdn.americanprogress.org/content/uploads/2019/06/27074704/BorrowersOfColor-report.pdf.
4This historical perspective was taken from https://www.theatlantic.com/business/archive/2018/03/chicago-segregation-poverty/556649.
5Córdova, T. L., and M. D. Wilson, 2017, “Abandoned in their Neighborhoods: Youth Joblessness amidst the Flight of Industry and Opportunity,” Great Cities Institute, University of Illinois at Chicago, January 29, available at https://greatcities.uic.edu/2017/01/29/abandoned-in-their-neighborhoods-youth-joblessness-amidst-the-flight-of-industry-and-opportunity.
6Cordova, Teresa, Matthew Wilson, and Jackson Morsey, 2016, “Lost: The Crisis of Jobless and Out of School Teens and Young Adults in Chicago, Illinois and the U.S.,” Great Cities Institute, University of Illinois at Chicago.
7Seal, D., A. Nguyen, and K. Beyer, 2014, “Youth Exposure to Violence in an Urban Setting,” Urban Studies Research, Vol. 2014, Article ID 368047, available at https://www.hindawi.com/journals/usr/2014/368047. Jain, S. and A. K. Cohen, 2013, “Behavioral Adaptation Among Youth Exposed to Community Violence: A Longitudinal Multidisciplinary Study of Family, Peer and Neighborhood-Level Protective Factors,” Prevention Science, Vol. 14, No. 6, pp. 606–617. De Coster, S., K. Heimer, and S. M. Wittrock, 2006, “Neighborhood Disadvantage, Social Capital, Street Context, and Youth Violence,” The Sociological Quarterly, Vol. 47, No. 4, pp. 723–753.
8Cooper, D., 2019, “Our Equitable Future: Delivering on the Promise of a City of Neighborhoods,” Metropolitan Planning Council, September 4, available at https://www.metroplanning.org/news/8771/Our-Equitable-Future-Delivering-on-the-Promise-of-a-City-of-Neighborhoods.
9Sharkey, Patrick, 2018, Uneasy Peace: The Great Crime Decline, the Renewal of City Life, and the Next War on Violence, New York: W.W. Norton.
10Sharkey, Patrick, 2013, Stuck in Place: Urban Neighborhoods and the End of Progress toward Racial Equality, Chicago: University of Chicago Press.
11Weissbourd, Robert, 2016, “Understanding Middle Neighborhoods as Vital Parts of Regional Economies,” On the Edge: America’s Middle Neighborhoods, ed Paul C. Brophy, The American Assembly and the Federal Reserve Bank of San Francisco: New York.
12Galster, George, 2016, “The Case for Intervention in Middle Neighborhoods,” On the Edge: America’s Middle Neighborhoods, ed Paul C. Brophy, The American Assembly and the Federal Reserve Bank of San Francisco: New York.
13Sharkey, Patrick, 2013, Stuck in Place: Urban Neighborhoods and the End of Progress toward Racial Equality, Chicago: University of Chicago Press.
14This reflects homebuyers who purchased homes with a mortgage between 2012 and 2017.
15See interactive map of property transactions on the South Side of Chicago, available at https://instituteforhousingstudies.carto.com/builder/0fe582f2-1fb5-11e7-8171-0e233c30368f/embed.
16Research based on national data by economists at the Federal Reserve Bank of Cleveland has found (in their terms) there remains much friction to mobility. That is, racial places are not homogeneous along the lines of income. Blacks and other ethnic minority groups tend to be very likely to sort into black neighborhoods due to non-pecuniary factors, including family and social networks. See Bruchel et al. (2019) and van der Klaauw et al. (2019).
17Anderson, M. B., and C. Sternberg, 2012, “Non-White Gentrification in Chicago’s Bronzeville and Pilsen: Racial Economy and the Intraurban Contingency of Urban Redevelopment,” Urban Affairs Review, Vol. 49, Issue 3, pp. 435–467, available at https://journals.sagepub.com/doi/abs/10.1177/1078087412465590?journalCode=uarb. Badger, E., 2012, “How Black Gentrifiers Have Affected the Perception of Chicago’s Changing Neighborhoods,” Bloomberg CityLab, available at https://www.citylab.com/equity/2012/12/how-black-gentrifiers-have-affected-perception-chicagos-changing-neighborhoods/4233. Ottenberg, E., 2019, “Gentrification, School Closings, and Displacement in Chicago,” The American Prospect, available at https://prospect.org/education/gentrification-school-closings-displacement-chicago.
18Cooper, D., 2019, “Our Equitable Future: Delivering on the Promise of a City of Neighborhoods,” Metropolitan Planning Council, September 4, available at https://www.metroplanning.org/news/8771/Our-Equitable-Future-Delivering-on-the-Promise-of-a-City-of-Neighborhoods.
19In Mallach’s analysis, predominantly black and Hispanic neighborhoods are those with 60 percent or more of the population.
20Landry, B., and K. Marsh, 2011, “The Evolution of the New Black Middle Class,” Annual Review of Sociology, 37:373-94.
21Sharkey, Patrick, 2014, “Spatial Segmentation and the Black Middle Class,” American Journal of Sociology, Vol. 119, No. 4, pp. 903–954, JSTOR, www.jstor.org/stable/10.1086/674561. Citations for this finding based on Logan and Alba 1993; Alba, Logan, and Bellair 1994; Sampson and Wilson 1995; Logan and Stults 1999; Adelman et al. 2001; Adelman 2004; Flippen 2004; Pattillo 2005; Downey and Hawkins 2008; Sharkey 2009; Crowder and Downey 2010.
22Logan, John R., 2011, “Separate and Unequal: The Neighborhood Gap for Blacks, Hispanics and Asians in Metropolitan America,” Russell Sage Foundation American Communities Project of Brown University, July.
23U.S. Environmental Protection Agency (EPA), 2014, “National Air Toxics Assessment,” available at https://www.epa.gov/national-air-toxics-assessment.
24Rotella, Carlo, 2019, The World is Always Coming to an End: Pulling Together and Apart in a Chicago Neighborhood, University of Chicago Press.
25Rotella, Carlo, 2019, The World is Always Coming to an End: Pulling Together and Apart in a Chicago Neighborhood, University of Chicago Press.
26According to research from the Natural Resources Defense Council. See https://www.bettergov.org/news/interactive-map-pollution-hits-chicagos-west-south-sides-hardest.
27See https://www.policingproject.org.
28See https://www.macfound.org › Chicago Community Land Trust Fact_sheet; https://www.wsmtlaw.com/blog/community-land-trusts-and-the-effort-to-implement-affordable-housing.html; https://www.chicagofed.org/publications/profitwise-news-and-views/2016/community-land-trust-model-opportunities-and-challenges-of-preserving-affordable-housing; and https://blog.chicagocityscape.com/proposal-put-an-eligible-house-into-the-chicago-land-trust-to-lower-its-taxes-8cb112e8e4f6?gi=464d950e38fb.
29See https://www.cookcountytreasurer.com/scavengersale.aspx; https://www.npr.org/local/309/2019/05/03/719971654/cook-county-makes-millions-by-selling-property-tax-debt-but-at-what-cost; and https://www.wbez.org/shows/wbez-news/cook-county-makes-millions-by-selling-property-tax-debt-but-at-what-cost/69272607-aa91-4d1b-abfa-1aef57ea0a33.
30See https://www.wbez.org/stories/cook-county-makes-millions-by-selling-property-tax-debt-but-at-what-cost/69272607-aa91-4d1b-abfa-1aef57ea0a33.
31Berry, Chris “Estimating Property Tax Shifting Due to Regressive Assessments: An Analysis of Chicago, 2011 to 2015.”
32See https://www.chicago.gov/city/en/depts/dcd/provdrs/invest_sw.html.


