

Abstract
Introduction
Entrepreneurial activity among minority individuals has been on the rise in recent years, contributing to an increase in jobs and economic growth (Bernard and Slaughter, 2004). Minority-owned firms, however, continue to face many challenges, particularly those related to access to start-up funding and expansion capital that undermine their longevity or survivability. As minority entrepreneurs increase their presence in the business sector, their success or failure reverberate even more into the broader economy. Policymakers need timely information in order to design effective policies to help address the needs of firms that are viable.
We analyze trends in minority self-employment and small business growth, as well as business start and exit dynamics. We also analyze available data to gauge the trends in financing and resources used by business owners for start-up and expansion of their ventures. The analysis is primarily descriptive, and we rely on publically available data and previous studies to document trends, discuss the factors behind them, and parse their potential implications.
Trends in self-employment
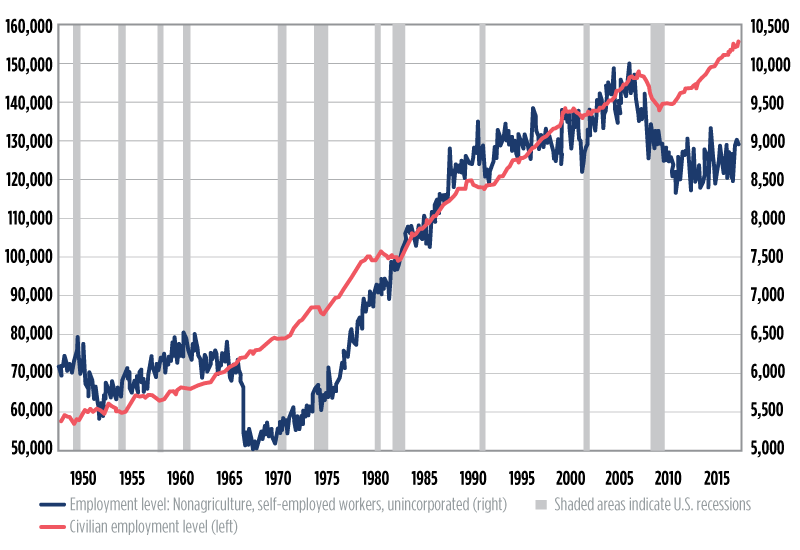
To gain a broader perspective, we begin by looking at the trends in self-employment and wage employment, using data from the Current Population Survey (CPS) by the Bureau of Labor Statistics.1 The trajectory of self-employment tracks general economic growth and decline, with a tendency of expanding during periods of economic growth, and contracting during recessionary periods (figure 1).2 Both wage and self-employment took similar-sized hits during the Great Recession. The recovery, however, has been uneven. Wage employment surpassed the level that preceded the economic downturn. By contrast, self-employment declined further, and as of 2018, was 4 percent lower than its level in 2007.
Figure 1. Trends in the number of wage employment and self-employment (thousands of persons)
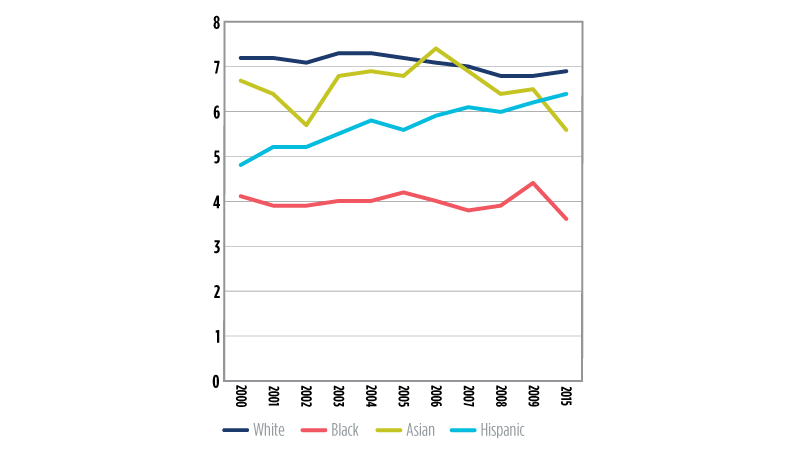
Minority self-employed is a growing share of all self-employed. Looking at the trends in the percent of self-employed workers with unincorporated businesses (figure 2), since 2000, the gap has been diminishing for Hispanics relative to whites and Asians. Hispanics saw a 27 percent increase in (unincorporated) self-employment between 2000 and 2015. The percent of self-employed blacks with unincorporated businesses has been relatively steady, hovering around 4 percent, with some slight increases during the 2001 and 2008 recessionary periods.3
Figure 2. Percent of workers self-employed with unincorporated businesses, by race/ethnicity
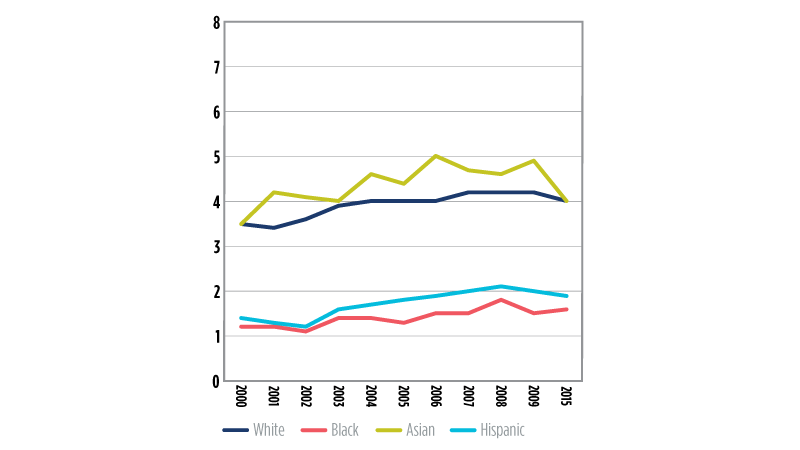
The rate of self-employment for workers with incorporated businesses increased over time for all the groups, although a gap remained for Hispanics and blacks relative to Asians and whites (figure 3). From 2000 to 2015, on average, more than 4 percent of white and Asian workers were self-employed with incorporated businesses, compared to about 2 percent of Hispanic and just about 1 percent of black workers.
Figure 3. Percent of workers self-employed with incorporated businesses, by race/ethnicity
Trends in business ownership and characteristics of minority businesses
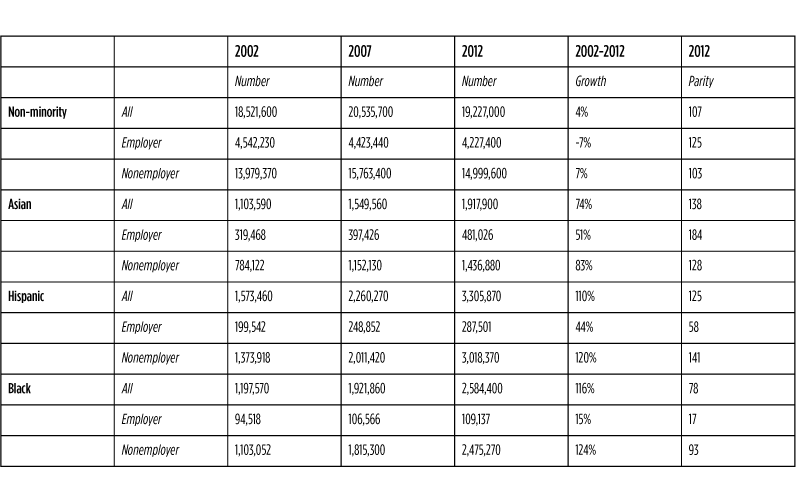
Based on data from the Survey of Business Owners (SBO),4 minority small business formation (for both employer and nonemployer businesses) has increased in recent decades. Between 2002 and 2012, Asian-owned businesses increased by 74 percent, while Hispanic- and black-owned businesses more than doubled (table 1). Over that 10-year period, in spite of the growth, black-owned businesses remained severely underrepresented, especially in firms with paid employees, based on calculations of parity of black businesses relative to that population share.5
Table 1. Number, growth and representation of ethnic/minority businesses
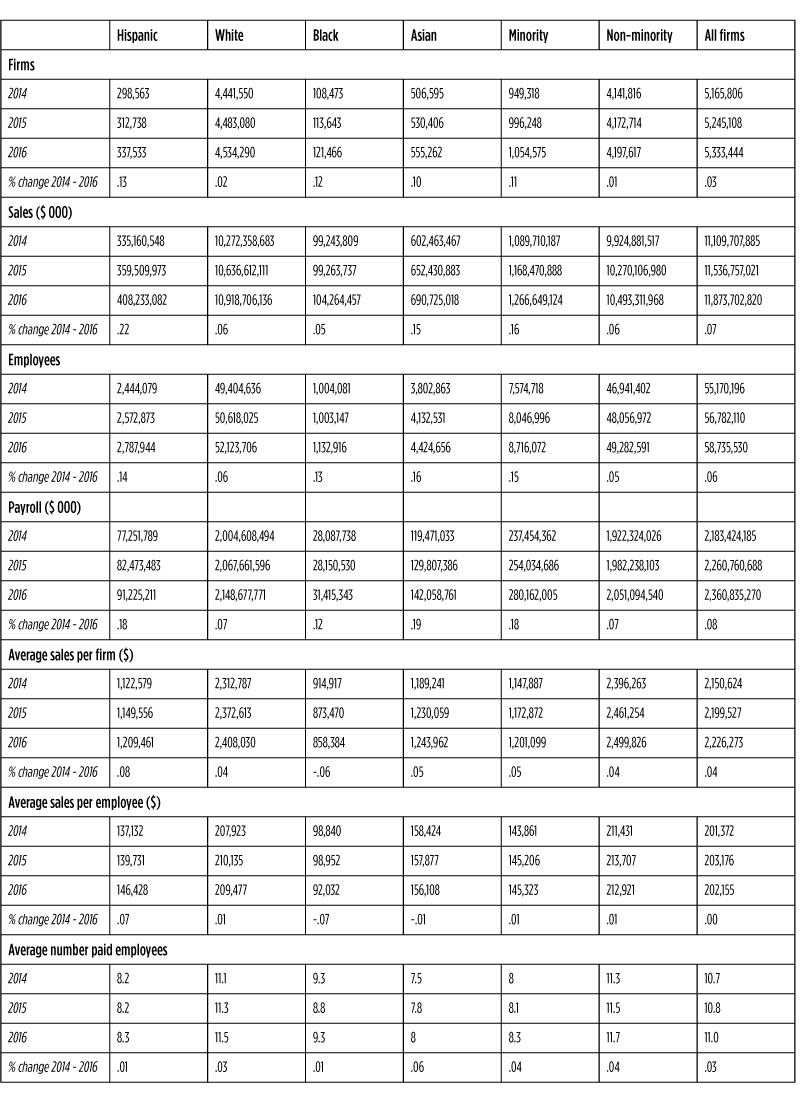
Additional data from the Annual Survey of Entrepreneurs (ASE) show growth in the number of minority employer businesses, post the Great Recession (table 2). Between 2014 and 2016, minority employer businesses increased by 11 percent. In addition, their receipts or revenues and the number of workers they employed, increased. More than half of the minority-owned firms with paid employees were Asian-owned. The total number of black-owned firms, as well as their revenues and payroll, also increased. Of note, however, the average black-owned firm had lower revenues in this three-year span of data. This could be due in part to new entries, as black-owned firms tended to be newer. Based on the 2016 ASE, 14 percent of black-owned employer businesses had been in existence for less than two years, compared to 9 percent of all employer firms.6
Table 2. Characteristics of business and race/ethnicity of owners
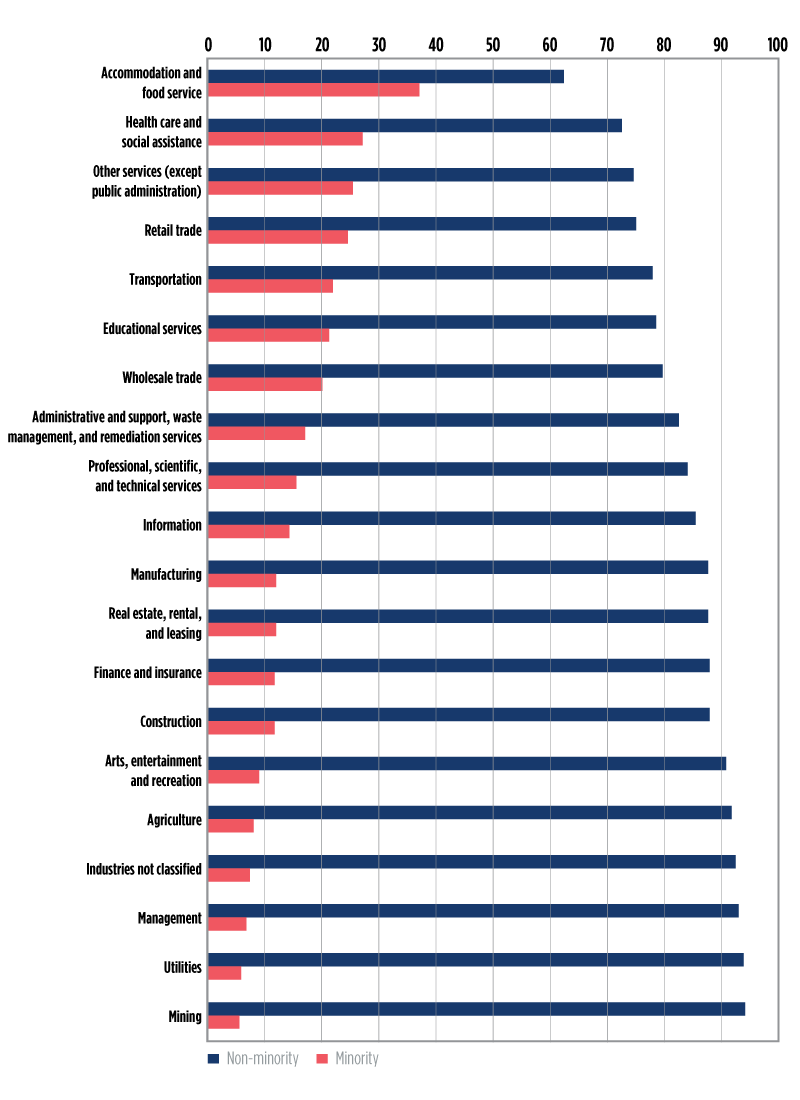
The industries with the largest number of employer firms were the professional, scientific and technical services, and construction sectors.7 Non-minority firms have large concentrations in those sectors. In contrast, among minority-owned employer firms, the accommodation and food services, health care and social assistance, retail trade, and transportation sectors were the most common (see appendix for the industry distribution of firms by minority status). At the time of this analysis, high-frequency data show that these are among the industries “most at risk” to be affected by disruptions in demand, shutdowns, and layoffs due to the COVID-19 virus.8
Entry and exit dynamics
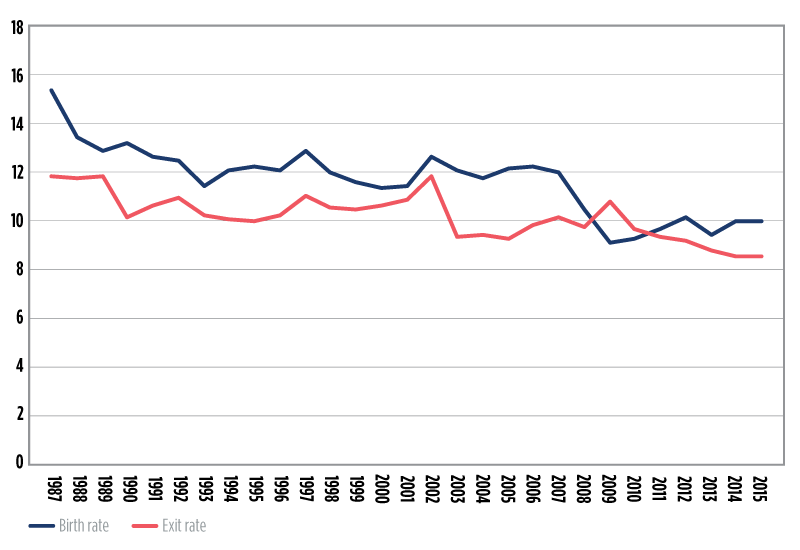
In this section, we examine various datasets and rely on previous literature to assess how business entry and survival dynamics have played for different groups. Previous research has sounded the alarm regarding recent trends in starts and exits for businesses in general (e.g., Davis and Hatiwanger, 2014). Data from the Census Bureau’s Business Dynamic Statistics (BDS)9 show that the entry rate of U.S. firms has been on a decline over the last few decades (figure 4). During and immediately following the Great Recession, the exit or failure rate exceeded the entry rate for the first time in at least two decades. The entry rate was again higher starting in 2012. However, the gap between the entry and the exit rates has narrowed (figure 4).10
Figure 4. Entry and exit rates of employer firms
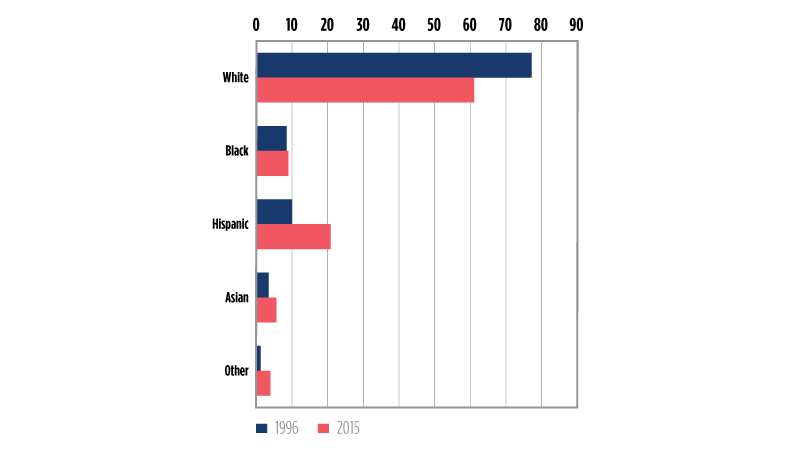
The Census BDS data does not provide information by minority group. However, various other data sources allow us to gain insights into differences in business starts by group. Analysis based on the Kauffman Foundation’s Annual Startup Activity Index suggests that minority business starts have been on the rise, even as overall (white-owned) business starts have declined, although the definition of startup is different for the two data sources. According to the Kauffman data, as of 2015, minorities started about 40 percent of new small businesses, which is nearly twice the percentage compared to 20 years ago. Hispanic entrepreneurs’ new business starts accounted for 21 percent, up from about 10 percent in 1996. Asian businesses’ start rate also doubled, from 3 percent to 6 percent of all business starts. The trend for black business starts was somewhat flat, remaining just above 8 percent of all starts during these years. White business starts declined from 77 percent of all new businesses in 1996 to 61 percent in 2015 (figure 5).
Figure 5. Index of startup activity, by race/ethnicity
While we do not have current data on business exits by race/ethnicity, an analysis of business survival over the years points to a less-than-positive picture for minority firms. An earlier study using data from the 1997 Survey of Minority-Owned Business Enterprises (SMOBE),11 a data source that has since been discontinued, estimated that the survival and expansion rates for minority-owned employer firms were 4 percentage points lower than for non-minority employer firms (Lowrey, 2005). According to that study, the survival rate for non-minority businesses and for Asian businesses was 73 percent; however, for Hispanics it was 69 percent, and for blacks it was 61 percent.
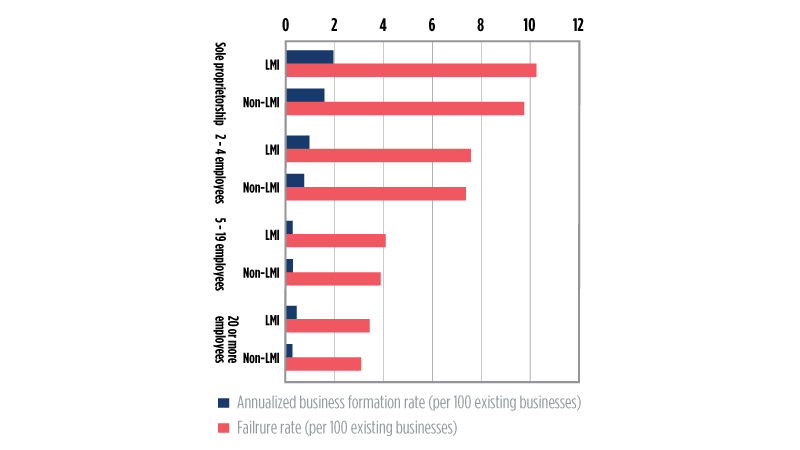
A more recent study focusing on selected cities with relatively large representations of minority businesses found that failure rates were slightly higher for small businesses in low- to moderate-income (LMI) and higher minority neighborhoods between 2012 and 2016 (figure 6). Further, differences in failure rates were significantly correlated with smaller-sized firms (sole proprietary/nonemployer), as well as with firms in certain low-entry cost services industries, which tended to be more common in LMI and minority neighborhoods (Toussaint-Comeau, Newberger, and O’Dell, 2019).
Figure 6. Formation and failure rates, by size of businesses and location
Small business credit
We turn next to an analysis of trends in the sources of credit used by minority business owners to start or expand their businesses, using available data. Several publications have studied the issue of access to credit from various perspectives (e.g., Cagetti and De Nardi, 2006). The existing literature suggests that access to credit has been particularly challenging for small young firms (Lofstrom and Wang, 2009; Freeland and Keister, 2014).12 Over the past decade, there have also been numerous studies on minority-owned businesses and access to credit, though this line of research remains limited due to a dearth of relevant data. However, a common finding based on available evidence is that the major constraint limiting the growth, expansion, and wealth creation of small firms – especially minority-owned businesses – is inadequate capital (Fairlie, 2006).
To contextualize the period of analysis, we present information on credit conditions after the Great Recession. While small business credit returned to normal levels after 2014, the increase was mostly in larger commercial and industrial/business lending (e.g., loans to larger firms to finance working capital and capital expenditures). By contrast, small business lending (i.e., loans $1 million or less) remained constrained.13 One of the factors contributing to constrained credit has been the collateral needed to secure these loans. According to the Survey Terms of Business Lending (STBL), 93.4 percent of the value of loans under $100k in 2017 was secured by collateral, compared with 85 percent for the same value of loans in 2007.14 To the extent that minority-owned firms have less collateral and are relatively smaller-sized businesses, as we have seen, these conditions suggest widened disparity between majority and minority entrepreneurs in accessing credit during this period.
Sources of start-up capital
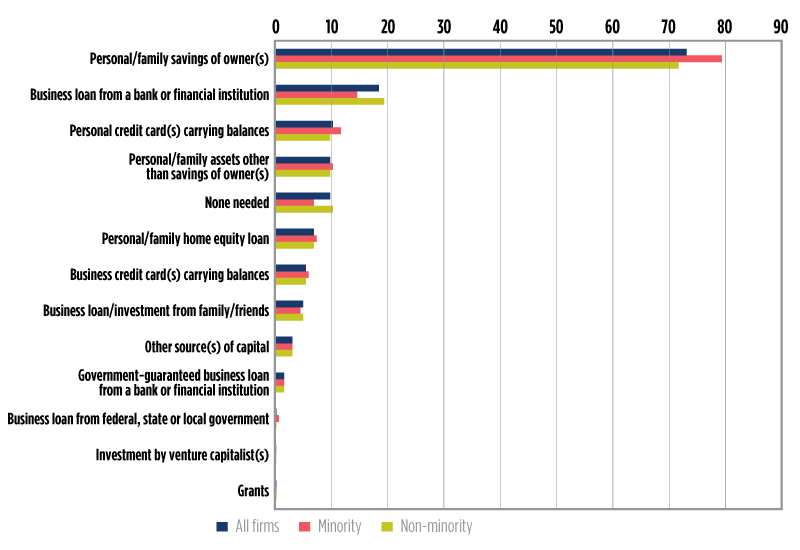
Respondents to the 2016 ASE indicated that the most common type of financing used to start or acquire a business was self-financing from personal savings; 73 percent of all businesses started using self-financing from savings. This percentage was higher still for minority-owned firms; 79 percent compared to 72 percent for non-minority (figure 7). Among minority business owners (not shown in table), Asians were the most likely to use owner self-financing, followed closely by Hispanics, then blacks (Robb, 2018).
The difference in self-financing is likely an indication of wealth disparities between different racial and ethnic groups. Based on data from the Survey of Consumer Finances (SCF), black and Hispanic families have considerably less wealth on average than white families. Asians have a higher net worth than black and Hispanic families, but lower net worth than white families (Dettling et al., 2017). According to that same data source, the white-black and white-Hispanic gap in median net worth increased between 2013 and 2016, despite the large (proportional) gains in the minority population. With less wealth and assets, minority firms may lack the collateral required for traditional financing (Fairlie and Robb, 2016).
Traditional financing from banks was the next most common form of capital, with 19 percent of all businesses using this source. The overall use of banks/financial institutions as a source of start-up capital was lower for minority firms (15 percent) than for non-minority firms (20 percent) (figure 7). The Federal Reserve 2017 Small Business Credit Survey (SBCS) found similar credit utilization differences for minority-owned firms relative to whites.15
Figure 7. Sources of start-up financing (percent of businesses)
Amount of start-up capital used by owners
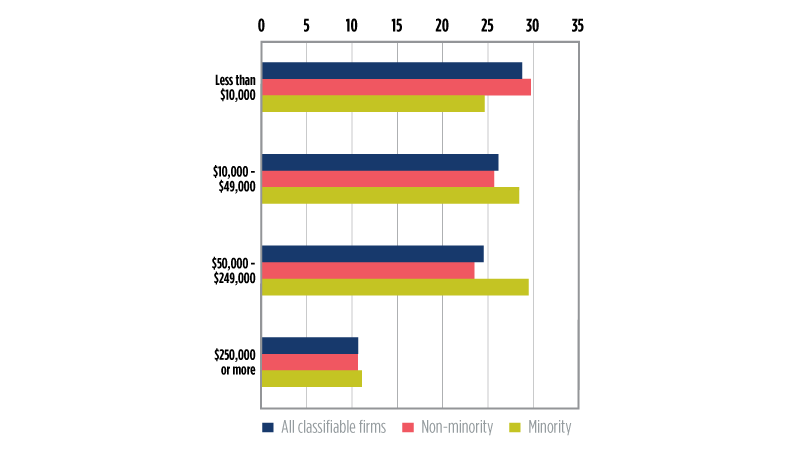
The amount of start-up capital used by a business varies widely (McManus, 2017). According to calculations based on the 2015 ASE, just under 60 percent of both minority and non-minority business owners start with less than $50,000, while only about 10 percent of owners, minority and non-minority, use $250,000 or more to start a business (figure 8).
Figure 8. Percent of business owners with start-up capital, by minority group and amount of capital used
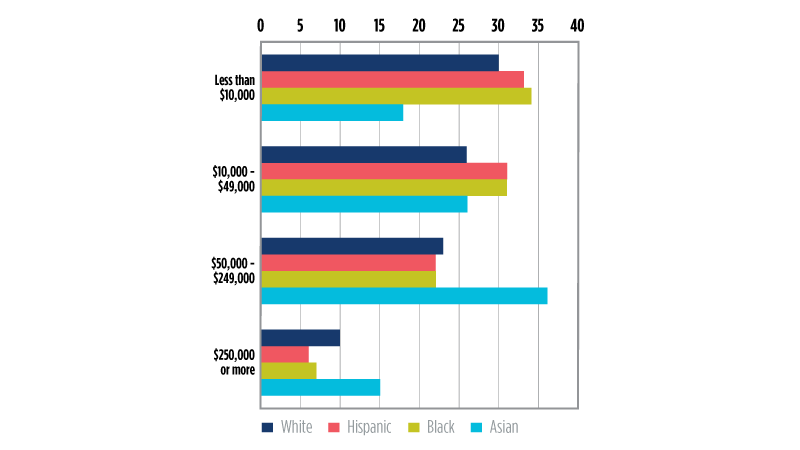
Looking further at race/ethnicity (figure 9), Asians are more likely to use larger amounts to start businesses. Among all groups, Asians (52 percent) use amounts of $50,000 or more as start-up capital, followed by whites (34 percent). By comparison, about a third of black and Hispanic business owners start their ventures with the least amount of capital – $10,000 or less, while only 18 percent of Asians used this amount.
Figure 9. Percent of business owners with start-up capital, by ethnic/racial group and amount of funding
Sources of capital for expansion
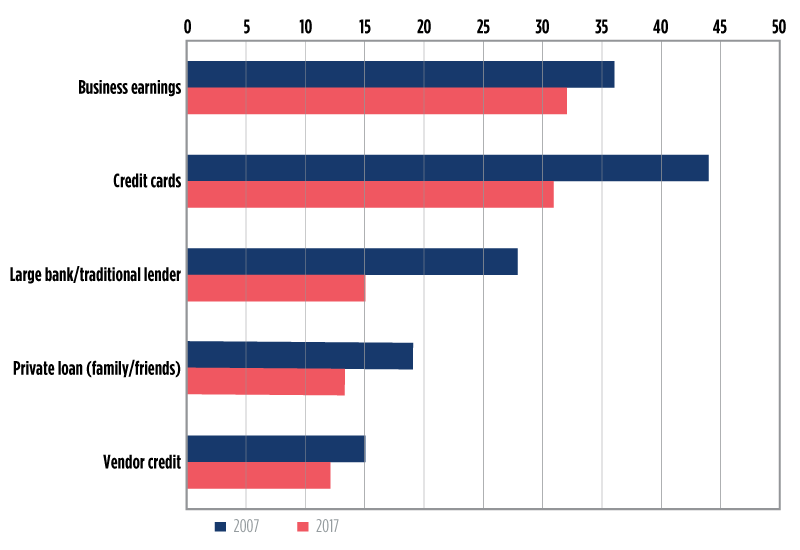
Information on the common types of financing for expansion, used by existing firms varies. For example, the SBO (figure 10) identifies the top two sources as self-financing and credit cards, whereas another survey by the National Small Business Association (NSBA) (figure 11) reports business earnings and credit cards. Interestingly, a higher percentage of small businesses were using more of each of these sources in 2007 than in 2017 (figure 11).16 Analysis by firm size from the same data source (NSBA) (not reported in figure 11) shows differences by firm size – large firms tended to rely on bank loans and business earnings while smaller firms depended on credit cards and private loans from friends and family.
Figure 10. Sources of capital used for expansion
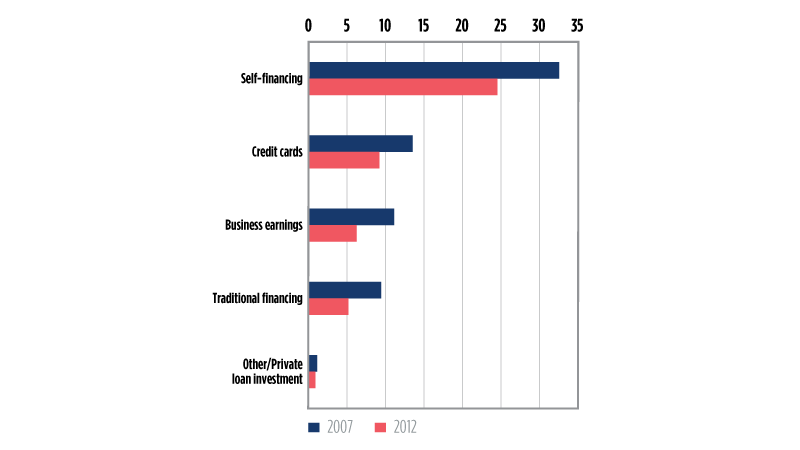
Figure 11. Top five sources of financing capital used within 12 months
Across demographic groups of business owners, Asian firms were more likely to use personal financing (as well as bank and government financing) for business expansion, compared to the other minority groups. White firms were least likely to use personal financing for expansion and most likely to use traditional bank and government financing (figure 12).
Figure 12. Sources of capital used for expansion
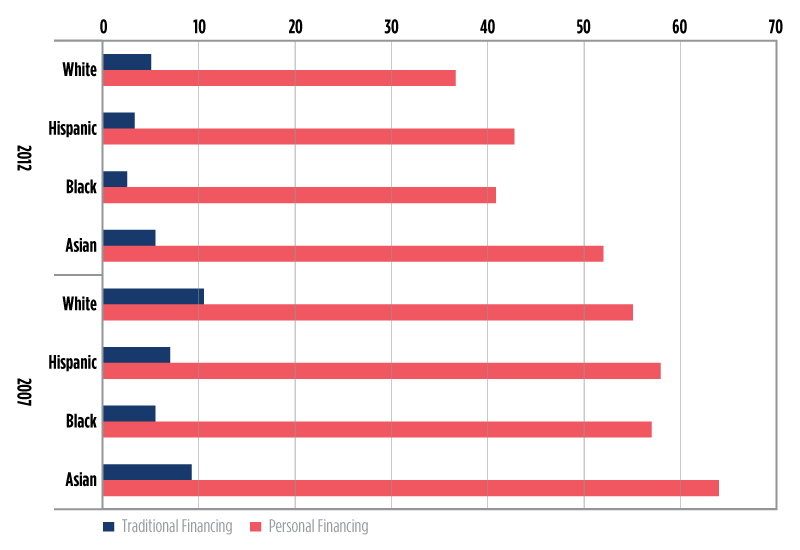
Blacks were half as likely as whites to use traditional financing to expand their businesses. According to the SBO data (figure 12), the gap remained persistent during a period of very high growth in the number of black businesses. About 5 percent of black-owned firms used traditional financing compared to 10 percent of white- and Asian-owned firms in 2007. In 2012, although a lower proportion of all businesses used expansion capital, as the credit market was still tight, the gap in traditional financing remained widest for black relative to white and Asian businesses. About 2.5 percent of black-owned businesses used traditional financing for expansion, compared to 5 percent of white-owned businesses. Hispanic businesses (7 percent) were also behind in their relative usage of traditional financing for business expansion, relative to whites and Asians (figure 12).
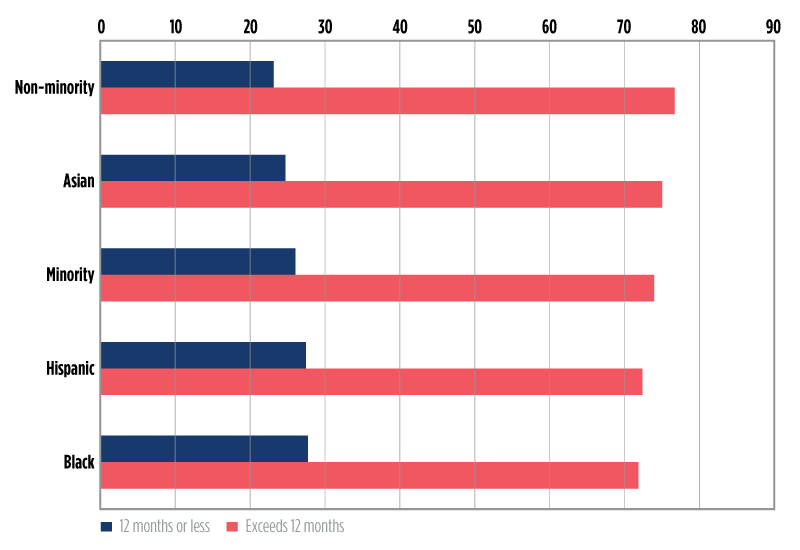
Minority employer firms have tended to be less likely to have a banking relationship. According to the 2016 ASE data, among firms with paid employees, 77 of non-minority firms and 75 percent of Asian firms had a banking relationship exceeding 12 months, prior to establishing a business account, compared to 72 percent of Hispanic and black firms (figure 13). The lesser intensity and duration of a banking relationship for minority firms is consistent with findings, based on data from the Federal Reserve Small Business Conditions Survey (SBCS), which show further disparities in lending relationship. According to an analysis of the 2016 SBCS, during a period of credit expansion, and among minority and non-minority-owned firms with the same business credit scores, approved for at least some financing, 40 percent of minority-owned firms received the full amount requested compared to 68 percent of non-minority-owned firms.17
Figure 13. Banking relationship (percent of firms with paid employees)
Summary and conclusion
Understanding the challenges facing ethnic/minority firms is essential to take the relevant targeted policy actions. This study presents a review of available data to assess the trends in self-employment propensity as well as business formation and growth of these firms. We also analyze the sources of funding, both to start and expand businesses.
The national trend in business starts in the U.S. shows a secular decline in recent decades. The reverse is true, however, for minority groups for whom there is evidence of increased activity. Consistent with overall demographic changes, we show that minority-owned businesses are becoming an increasingly significant segment of the small business landscape, contributing to employment creation. Gaps remain, however, in the representation of self-employed Hispanics and blacks with incorporated businesses. The two groups also lag behind in having parity in their representation in employer businesses, signaling unrealized potential in those larger ventures (Bahn, 2016).
In addition, even as minority entrepreneurs have a proclivity to start businesses, lower levels of wealth appear to affect a significant portion of these businesses. We find minority businesses more highly represented in industries with relatively lower entry costs, such as food services, transportation, and retail trade. New high-frequency data (at the time of completing this analysis) show that these are the industries affected most directly by low demand and low revenue during the COVID-19 epidemic.
We analyze data on resource utilization and find that reliance on formal bank credit for start-up and expansion is lower for minority groups compared to whites. In the case of black firms, the proportion that uses banks for start-up or expansion capital is half the share of white-owned businesses. We also note lesser intensity in banking/lending relationships even for minority employer firms, which in some cases do not appear to be explained by credit scores, according to some evidence. These challenges have undermined the long-term viability of minority-owned businesses. (Bates and Robb, 2014; Holtz-Eakin et al., 1994).
The results of our analysis suggest that policies that increase access to resources and financial capital remain necessary to ensure the viability of small businesses. The formal financial sector has a comparative advantage in mobilizing large amounts of funds. An improvement in banking relationships, which curbs the systematically lower utilization of bank credit by small firms, might help minority-owned businesses in particular start at sizes and expand in ways that optimize their chances of survival (Evans and Jovanovic, 1989; Cressy, 2008).
With various policies in place, such as the CRA and the Equal Credit Opportunity Act, special SBA programs that target specific demographics of businesses, and the new CARES Act of 2020, the formal financial market appears poised to support many small businesses facing the deep economic shocks affecting demand. Our analysis suggests that promoting and enhancing inclusion to resources and credit available for the expanded minority business sector remain warranted.
Appendix
REFERENCES
Bahn, K., 2016, “The ‘Entrepreneur Gap’ Facing Women and Minorities,” available at https://knowledge.wharton.upenn.edu/article/the-entrepreneur-gap-facing-womenand-minorities.
Bernard, A. B., and M. J. Slaughter, 2004, “The Life Cycle of a Minority-Owned Business: Implications for the American Economy,” Minority Business Development Agency, available at http://tuck-fac-cen.dartmouth.edu/images/uploads/faculty/andrewbernard/mbda.pdf.
Bates, T., and A. Robb, 2014, “Small-business viability in America’s urban minority communities,” Urban Studies, Vol. 51, No. 13, pp. 2844-2862.
Cagetti, M., and M. De Nardi, 2006, “Entrepreneurship, Frictions, and Wealth,” Journal of Political Economy, Vol. 114, No. 5.
Cressy, R., 2008, “Determinants of Small firm survival and growth,” The Oxford Handbook of Entrepreneurs, edited by A. Basu, M. Casson, N. Wadeson, and B. Yeung, Oxford University Press, available at https://www.oxfordhandbooks.com/view/10.1093/oxfordhb/9780199546992.001.0001/oxfordhb-9780199546992-e-7.
Davis, S. J., and J. Haltiwanger, 2014, “Labor Market Fluidity and Economic Performance,” NBER working paper No. 20479, available at https://www.nber.org/papers/w20479.pdf.
Dettling, L. J., J. W. Hsu, L. Jacobs, K. B. Moore, and J. P. Thompson, 2017, “Recent Trends in Wealth-Holding by Race and Ethnicity: Evidence from the Survey of Consumer Finances,” Board of Governors of the Federal Reserve System, available at https://www.federalreserve.gov/econres/notes/feds-notes/recent-trends-in-wealth-holding-by-raceand-ethnicity-evidence-from-the-survey-of-consumer-finances-20170927.htm.
Evans, D. S., and B. Jovanovic, 1989, “An Estimated Model of Entrepreneurial Choice under Liquidity Constraints,” Journal of Political Economy, Vol. 97, pp. 808-827.
Fairlie, R. W., 2006, “Entrepreneurship among Disadvantaged Groups: An Analysis of the Dynamics of Self-Employment by Gender, Race and Education,” The Life Cycle of Entrepreneurial Ventures, International Handbook Series on Entrepreneurship, Vol. 3, Simon Parker (ed.), Springer: New York.
Fairlie, R. W., and A. M. Robb, 2010, “Disparities in Capital Access between Minority and Non-Minority-Owned Businesses: The Troubling Reality of Capital Limitations Faced by MBEs,” U.S. Department of Commerce, Minority Business Development Agency, available at https://www.theinstitutenc.org/wp-content/uploads/2018/03/DisparitiesinCapitalAccessReport.pdf.
Fetsch, E., 2016, “Including People of Color in the Promise of Entrepreneurship,” Entrepreneurship Policy Digest, available at https://www.kauffman.org/what-we-do/resources/entrepreneurship-policy-digest/including-people-of-color-in-the-promiseof-entrepreneurship.
Freeland, R. E., and L. A. Keister, 2014, “How Does Race and Ethnicity Affect Persistence in Immature Ventures?” Journal of Small Business Management, Vol. 54, No. 1, available at https://onlinelibrary.wiley.com/doi/pdf/10.1111/jsbm.12138.
Gourio, F., T. Messer, and M. Siemer, 2016, “A Missing Generation of Firms? Aggregate Effects of the Decline in New Business Formation,” 2016 Meeting Papers 752, Society for Economic Dynamics, available at https://ideas.repec.org/p/red/sed016/752.html.
Hipple, S., 2010, “Self-employment in the United States,” Monthly Labor Review, September, available at https://www.bls.gov/opub/mlr/2010/09/art2full.pdf.
Holtz-Eakin, D., D. Joulfaian, and H.S. Rosen, 1994, “Entrepreneurial decisions and liquidity constraints,” The RAND Journal of Economics, Vol. 25, No. 2, pp. 334-347.
Karahan, F., B. Pugsley, and A. Şahin, 2015, “Understanding the 30-year Decline in the Startup Rate: A General Equilibrium Approach,” Federal Reserve Bank of New York, available at https://www.hec.ca/iea/chaires_groupes_recherche/macromontreal/conferences/20150602_Aysegul_Sahin.pdf.
Lofstrom, M., and C. Wang, 2009, “Mexican-American Self-Employment: A Dynamic Analysis of Business Ownership,” Research in Labor Economics, Vol. 29, available at http://www.academia.edu/3208043/Mexican-American_self-employment_a_dynamic_analysis_of_business_ownership.
Lowrey, Y., 2005, “Dynamics of Minority-Owned Employer Establishments, 1997-2001,” Office of Advocacy, U.S. Small Business Administration.
McManus, M. J., 2017, “Dissecting Access to Capital,” U.S. Small Business Administration, Office of Advocacy, available at https://www.sba.gov/sites/default/files/Capital_Access_Fact_Sheet_FINAL.pdf.
Robb, A., 2018, “Financing Patterns and Credit Market Experiences: A Comparison by Race and Ethnicity for U.S. Employer Firms,” Office of Advocacy, U.S Small Business Administration.
Toussaint-Comeau, M., R. Newberger, and M. O’Dell, 2019, “Small Business Performance in Industries in LMI Neighborhoods after the Great Recession: Atlanta, Baltimore, Chicago, Houston and Los Angeles,” ProfitWise News and Views, No. 3, available at https://www.chicagofed.org/publications/profitwise-news-and-views/2019/smallbusiness-performance-in-industries-in-lmi-neighborhoods-after-the-great-recession.
NOTES
1Since the late 1940s, data on self-employment have been collected as part of the Current Population Survey (CPS), the primary source of employment and unemployment in the U.S. The CPS captures people who own all types of businesses, including incorporated, unincorporated, employer, and nonemployer businesses. Side and low-hour businesses are excluded since business ownership status is defined for the main job activity and for workers with at least 15 hours of work in the survey week.
2It is difficult to understand fully the relationship between self-employment, employment, and recession and expansion of the economy using the CPS. Self-employment can be both pro-cyclical and countercyclical. During periods of downturn, both employment and self-employment may go down as people lose their businesses. At the same time, a countercyclical effect could result with the rise of unemployment as the number of people who are unemployed or part-time workers increase during a recession, and those laid off workers start businesses. An additional complication relates to how CPS data is constructed. Workers who hold two jobs, one a wage job and the other, self-employed, are classified according to the job in which they work the most hours. If the self-employment work is a secondary activity, the person would be classified as a wage or salary worker. If the person loses the wage work during a recession, he or she would still be counted as employed, but would then be classified as self-employed. As a result, during a recession, self-employment could rise even though total employment is unaffected (Hipple, 2010).
3The uptick in self-employment for blacks with unincorporated businesses during the Great Recession suggests that to some extent, some of these businesses may have started out of necessity, given higher unemployment rate for the group, compared to the overall population. Businesses that begin when the entrepreneur is unemployed and has less income or wealth tend to be more financially fragile, with lower chances of surviving (Fetsch, 2016).
4There are three major data sources that provide information on businesses and the characteristics of the owners. The Survey of Minority-Owned Business Enterprises (SMOBE), which is only available up to 1997; the Survey of Business owners (SBO), which is available for 1992, 1997, 2002, 2007, 2012; and the Annual Survey of Entrepreneurs (ASE), which provide data for 2014, 2015, 2016. The ASE is collected through a partnership of the Census Bureau with the Kauffman Foundation and the Minority Business Development Agency (MBDA). The Annual Business Survey (ABS) will replace the ASE, and the 2017 results will be released during the summer of 2020. See https://www2.census.gov/ces/wp/2015/CES-WP-15-40.pdf.
5See https://www.mbda.gov/mbe-data?year=2012&industry=All+Sectors+%280%29&minority_group=Nonminority&metrics+Actual+Value&concept=Number+of+Firms&firms=All+Firms&=Apply.
6See https://www.census.gov/programs-surveys/ase/data/tables.html. The ASE is not directly comparable to the SBO due to different methodology.
7See https://www.census.gov/newsroom/press-releases/2017/minority-ownedemployer- firms.html.
8See https://www.brookings.edu/blog/the-avenue/2020/03/17/the-places-a-covid- 19-recession-will-likely-hit-hardest.
9The Business Dynamics Statistics (BDS) provide annual data on the universe of all firms with employment since 1997. It excludes self-employment and is available with a three-year lag.
10Changes related to the demographic composition of the population and credit conditions may have played a role in the decline in start-ups. For example, there has been a notable decline in the rate of new entrepreneurs among younger individuals, ages 20 to 34. Exposure to the Great Recession may have caused these millennials to become more risk adverse. In addition, student loan debt may have hurt entrepreneurial potential. Research suggests that these start-up deficits have dampened employment growth. Since new firms tend to be an important source of job creation, these conditions may have impaired the economic recovery (Karahan, Pugsley, and Şahin, 2015; Gourio et al., 2016).
11The Census Bureau provided the Small Business Administration’s Office of Advocacy with a series of statistical tabulations that track establishments belonging to minority-owned business enterprises that responded to the 1997 Survey of Minority-Owned Business Enterprises (SMOBE). The dataset only contains information on employer establishments, and it contains no information on establishments that opened after 1997.
12Based on analysis of the Survey of Income and Program Participation (SIPP), Hispanics (specifically Mexican) entrepreneurs had a higher rate of business exits compared to whites (Lofstrom and Wang, 2009). This was due to owners having less financial capital and wealth. Another study, using data from the Panel Study of Entrepreneurial Dynamics (PSED), found that compared to whites, blacks’ business failures were linked to having less supplier credit and lacking access to other capital sources (Freeland and Keister, 2014).
13Small Business Lending in the United States, 2016, Office of Advocacy, U.S. Small Business Administration, September 2018, available at https://www.sba.gov/sites/ default/files/Small-Business-Lending-in-US-2016-Report.pdf.
14The Board of Governors discontinued the Survey of Terms of Lending/E.2 (STBL); and the final STBL was conducted on May 2017. The STBL was replaced by the Small Business Lending Survey (SBLS). See https://www.federalreserve.gov/releases/e2 and https://www.kansascityfed.org/research/indicatorsdata/smallbusinesslendingsurvey.
15See https://clevelandfed.org/~/media/content/community%20development/ smallbusiness/2016%20sbcs/sbcs%20minority%20owned%20report.pdf.
16NSBA, National Small Business Association, 2017, pg. 11, available at http://www. nsba.biz/wp-content/uploads/2012/03/2008bizsurvey.pdf.
17The Small Business Credit Survey (SBCS) is a national collaboration of the Community Development Offices of the 12 Federal Reserve Banks, aimed at providing insight into firms' financing and debt needs and experiences. The SBCS publishes reports on several topics, such as: employer firms, nonemployer firms; urban and rural employer firms, and women-owned firms. See https://www.richmondfed.org/community_development/resources/small_business.


