

The following publication has been lightly reedited for spelling, grammar, and style to provide better searchability and an improved reading experience. No substantive changes impacting the data, analysis, or conclusions have been made. A PDF of the originally published version is available here.
The revitalized Midwest economy has now been tested by a lengthy period of economic weakness.1 A recession began in mid-1990 and appeared to have bottomed out in April 1991. Since then, economic activity has slowly moved upward, but not without faltering late in 1991.2 In the past, national economic slowdowns have been harsh on the Midwest. During the 1981-82 downturn, for example, over 1.3 million people lost their jobs in the region. Most of this decline came in the manufacturing sector, where payrolls plunged by 25%, twice as fast as the national average. In the most recent recession and recovery, however, the Midwest economy behaved relatively well. In large part, this has been due to the fact that its manufacturing sector—the cornerstone of the Midwest economy—has fared better than its national counterpart since the recession began. This Fed Letter explores two key aspects of the relatively strong performance of the Midwest manufacturing sector during the recent recession and the subsequent recovery, using the Chicago Fed’s Midwest Manufacturing Index (MMI). The information incorporated in the MMI provides an opportunity to assess the roles played by industrial structure and competitiveness in shaping manufacturing activity in the new Midwest economy.3
An update on the recent recession and recovery
Perhaps the best way to examine an economic entity is to review its performance over a period of recession and recovery. Prosperity can lift results for all firms and mask underlying weakness in productivity and competitiveness. When a recession arrives, competitive forces intensify. Inefficiencies can be penalized, and firms that provide goods and services most competitively can increase their market share. The reallocation of resources that accompanies this process generates short-term hardships, but also provides the long-run mechanism producing sustainable economic growth. Faith in the market process is reinforced by looking at trends in production in the Midwest during the recent recession, compared to the national average or to previous experience. The comparison between the Midwest and the U.S. during the 1981-82 and 1990-91 recessionary periods is summarized in figure 1.
1. Production comparison
| Recession | Recovery | |
|---|---|---|
| % decline peak to trough | % recovered 8 months after trough | |
| 1981-82 | ||
| MMI | –19.8 | 50 |
| USMI | –10.7 | 66 |
| MMI* | –13.2 | 70 |
| 1990-91 | ||
| MMI | –3.4 | 115 |
| USMI | –3.7 | 55 |
| MMI* | –4.6 | 120 |
The recent downturn in the Midwest pales in comparison with the 1981-82 recessionary period. Manufacturing production in the Midwest dropped nearly twice as fast as the national average in the 1981 downturn, when the MMI declined 19.8%, compared to 10.7% for the nation, as measured by the United States Manufacturing Index (USMI). The recession in 1980 was even more dramatic. The MMI fell 19.7%, compared to 6.9% for the nation. During these hard times, manufacturing constituted a higher share of the Midwest economy than the nation. This fact, together with the relative performance of key manufacturing industries, contributed to a severe downturn in the Midwest.
In contrast, the 1990-91 recession was relatively mild for Midwest manufacturing businesses, compared to either the national average or to past experience. The MMI declined 3.4% from the cycle peak (the third quarter of 1990) to its recent trough (the first quarter of l991). Over the same interval, the comparable index for the nation fell at a slightly faster pace. These results stand in sharp contrast to the dismal showing in the early 1980s, and the reversal of fortune is even more clearly evident during the early stages of the recoveries following these two recessions. After the rather violent early 1980s episodes, Midwest production expanded faster than the national pace, but from abysmal levels. In the first eight months of the recovery that began late in 1982, the MMI recovered only about half of the production losses incurred during the downturn, a poor showing relative to the national average. In contrast, in the recovery that began early in 1991, the MMI recovered all of the losses incurred during the recession during the eight months following the trough, while the USMI recaptured only about half of its recessionary decline.
Where has the improvement come from?
An interesting and illuminating story lies underneath the aggregate production measures. Figure 1 includes a measure labeled MMI*. This index is formed by fixing the industrial structure of the Midwest manufacturing sector to a cyclically neutral base period, i.e., roughly mid-expansion. Then, the industries within the MMI are assumed to grow, not at their actual rate, but at the pace experienced by their corresponding industry in the national measure. Thus, the relative performance of the MMI* and the USMI can be determined by the difference in the industrial structure between the region and the nation. On the other hand, the difference between the MMI and the MMI* can reflect the contribution of competitiveness: the ability of regional industries to grow faster or slower than their national counterparts.4
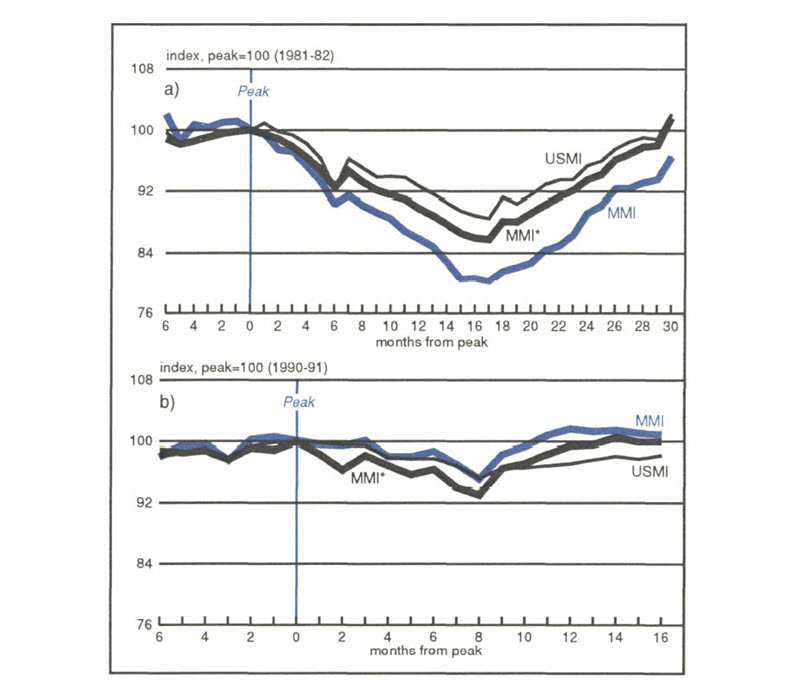
The differences between the behavior of these three indexes in the early 1980s illustrates how many Midwest manufacturers played their traditional role during a recession. During the 1981-82 downturn, as noted above, the MMI fell roughly twice as fast as the national average. At the same time, the decline in the MMI* suggests that both structural factors and competitiveness played a role in the weak performance of the Midwest manufacturing sector during this 23-month long downturn. Competitiveness appeared to dominate, as the difference between the declines in the MMI and the MMI* accounted for about two-thirds of the difference between the changes in the MMI and the USMI. During the recovery that followed, Midwest production again paled compared to the national average, regaining only about half of the recessionary decline in the first eight months of the recovery. The structure of the Midwest manufacturing sector was a positive contributor to recovery in the Midwest. Given the region’s concentration in cyclically sensitive industries, this should be no surprise. However, the marked underperformance of the MMI relative to the MMI* over this interval indicates that competitive considerations overwhelmed the structural factors, leading to the continued underachievement of the MMI relative to the national average (see figure 2a).
2. Performance over cycle
The lack of competitiveness in the Midwest manufacturing sector in the early 1980s has often been attributed to a belief that many Midwest manufacturers operated in a high marginal cost position as a result of old, inefficient plants and high labor costs. These manufacturers could be characterized as “producers of last resort,” becoming the first to experience the downturn and the last to see the upturn. The severity of the early 1980s recessions combined with increasingly fierce international competition to bring about a forceful restructuring of the Midwest manufacturing sector during the 1980s. This phenomenon was apparent within the overall sector as well as within individual industries and firms. Some diversification away from cyclically sensitive industries took place, as has been widely recognized. However, restructuring within industries and firms (much of it devoted to promoting efficiency and, thus, competitiveness), appears to have also played an important role in promoting the relative strength of the Midwest manufacturing sector in the recent recession.
The patterns underlying the path taken by the MMI in the recent recession and recovery show the Midwest manufacturing sector playing a new role. From the peak in July 1990 to the trough in early 1991, the USMI declined slightly faster than the MMI (see figure 2b). The direction of the MMI* over this period indicates that, had the Midwest manufacturing sector been structured as it was in 1988, but its industries grown only at their national rate from 1988 through 1991, the downturn in the Midwest would have been more severe than either the national average or the actual experience. The faster deterioration seen in the MMI* (relative to the USMI) indicates that concentration in cyclically sensitive industries again hurt the Midwest during the downturn. At the same time, in a reversal from previous experience, the difference between the actual Midwest results and the MMI* suggests that competitiveness contributed positively to the relative performance in the Midwest. Indeed, the effect was strong enough to offset the effect of cyclically sensitive industries dominating the Midwest industrial structure.
A closer look at structural change and competitiveness
Where did structural change and improved productivity arise? Cyclically sensitive durable goods industries comprised a smaller share of total Midwest manufacturing activity in the recent recession than in 1981-82. Specifically, the share of total production attributable to firms engaged in primary metals, nonelectrical machinery, electrical machinery, and transportation equipment manufacturing declined in the Midwest from the 1981-82 period to 1990-91 (see figure 3). At the same time, the share of production by firms engaged in food processing rose slightly, and production in the chemical industry showed a strong increase. While cyclically sensitive industries showed greater declines in share of total production in the Midwest, most remained above the national average. As a result, the industrial structure of the Midwest sharpened the decline in the region during the recent recession, although the structural change that occurred over the 1980s limited the negative impact, at least compared to the 1981-82 experience. Conversely, structural change also played a role in muting the response of the regional economy to the national recovery.
3. Structural change and relative performance
| % change in share | Performance during recessions (% change peak to trough) | |||||
|---|---|---|---|---|---|---|
| 1981-82 to 1990-91 | 1981-82 | 1990-91 | ||||
| MMI | USMI | MMI | USMI | MMI | USMI | |
| Less cyclical | ||||||
| Food | 1 | 3 | –1 | 4 | 3 | -- |
| Furniture | 1 | -- | –16 | –7 | –4 | –9 |
| Paper | -- | 1 | –6 | -- | –1 | –6 |
| Printing | -- | 1 | 4 | 5 | –4 | –3 |
| Chemicals | 6 | 1 | –14 | –7 | 8 | 3 |
| Petroleum | -- | -- | –11 | 13 | 4 | 3 |
| Rubber | -- | -- | –9 | –9 | 2 | nm |
| More cyclical | ||||||
| Lumber | -- | -- | –10 | –6 | –12 | –10 |
| Stone, clay & glass | -- | –1 | –21 | –14 | –4 | –7 |
| Primary metals | –3 | –2 | –39 | –35 | –9 | –9 |
| Fabricated metals | -- | -- | –21 | –19 | –12 | –7 |
| Nonelectrical machinery | –3 | –2 | –41 | –28 | –5 | –5 |
| Electrical Machinery | –1 | 1 | –18 | –11 | –4 | –6 |
| Transportation equipment | –2 | 1 | –17 | –13 | –14 | –9 |
| Instruments | -- | –2 | –10 | –10 | –1 | –4 |
| Miscellaneous | -- | –1 | –30 | –10 | –12 | –4 |
Why, then, has Midwest manufacturing activity begun to show strength relative to the nation? During the 1981-82 recession, growth in Midwest manufacturing production lagged the national average in 16 of its 17 industries. In the 1990-91 downturn, the shoe was on the other foot, as production in the Midwest outperformed the national average in 12 of 17 industries. The clearest evidence of improvement in relative performance came in cyclically sensitive industries. For example, production of nonelectrical machinery, a Midwest specialization, declined only 5% in the recent recession, the same pace as the national average. In the early 1980s, production in this industry fell 28% nationally, and 41% in the Midwest. The chemical industry also stands out, growing considerably faster in the Midwest than the national average during the recent recession and recovery, and accounting for a higher share of regional production than it did in 1981-82.
Impact of auto industry restructuring on the Midwest
The restructuring taking place within the auto industry illustrates how structural changes and competitive forces can interact to enhance the relative performance of industrial production in the Midwest. In the early 1980s, the financial burden of the downturn in the auto market was particularly acute for Chrysler and Ford. As a result, these companies closed plants and cut costs earlier and more aggressively than General Motors, although GM did not escape these pressures. When the market began to recover in 1983, automakers were rewarded for their efforts with higher levels of capacity utilization. While operating rates rose significantly from 1983 to 1985, GM’s rate remained nearly 10 percentage points below that for Chrysler and Ford, and 20 points below that for new “transplant” producers—domestic assembly plants owned by automakers based outside of the United States.
As the 1980s progressed, further gains in domestic market share by transplants put new pressure on the Big 3 to limit production to their most efficient plants, and cost-cutting was increasingly focused on supplier networks as well as internal facilities. At the same time that the Big 3 pruned raw capacity, they also accelerated capital spending devoted to factory modernization, leading to productivity improvement in remaining facilities. On balance, these trends probably produced gains for the Midwest economy. Perhaps most importantly, the presence of new competitive producers of high-quality cars benefited Midwest, national, and international consumers. In addition, most of the new transplant production was located in or near the Midwest. The domestic content of the cars produced in these facilities has historically been below that for the Big 3, but exchange rates, politics, and the independent and ongoing integration of domestic supplier networks with these facilities suggest that the domestically produced content of transplant autos will head higher as the 1990s progress.
However, these benefits have not come without costs. Gains in market share by transplant automakers were an important factor that pushed excess capacity at the Big 3 stubbornly higher through the latter half of the 1980s. A study by the University of Michigan estimated that nearly 70,000 jobs were lost in Michigan alone as a result of plant closings in the late 1980s,5 although state and private income maintenance programs helped offset the direct impact on regional income, easing the resource reallocation process. Industrywide competitive pressures to produce more efficiently and improve product quality are expected to result in further consolidation in the Midwest’s auto parts indust1y This process will impose short-run costs as inefficient producers lose market share, but in the long run could prompt improved competitiveness among District producers, just as the severity of the early 1980s downturns promoted the resilience of the Midwest economy during the recent recession.
Into the 1990s
The intensity of the downturn in the early 1980s in the Midwest manufacturing sector combined with other factors to prompt extensive restructuring in the region’s economy during the rest of the decade. Some of this activity took the form of realignment of production toward less cyclically sensitive industries, but a redoubled focus on productivity improvement in manufacturing also appears to have taken place. Continued restructuring in the auto industry will weigh upon a segment of the regional economy, but should also result in a stronger, more competitive Midwest manufacturing sector in the long run. Structural change and improved competitiveness over the 1980s played a role in muting the responsiveness of the Midwest manufacturing sector to the recent national recession. These same factors can be expected to play an important role in shaping an improved performance in the new Midwest manufacturing sector in the 1990s.
Notes
1 The Midwest is defined here to include Illinois, Indiana, Iowa, Michigan, and Wisconsin.
2 For a review of the national economy in 1991 and the outlook for 1992, see William J. Bergman and Robert H. Schnorbus, “1992 outlook: a question of confidence,” Chicago Fed Letter, February 1992.
3 The MMI is a summary statistic measuring output. It is determined by the value-added of industrial production in the region, using estimates of the labor and capital employed in 17 different industries at the plant level. For an overview of how it is constructed, see Philip R. Israilevich, Robert H. Schnorbus, and Peter R. Schneider, “Reconsidering the regional manufacturing indexes,” Economic Perspectives, July/August 1989, pp. 13-21.
4 For example, suppose that the USMI grows faster than the MMI over a given period. At the same time, the MMI* grows at a faster pace than the MMI, but at a slower pace than the USMI. The excess of the growth of the MMI* over the MMI can reflect competitive weakness in Midwest industries, because the MMI* includes the Midwest industrial structure with the industries growing at their national pace. The difference between the MMI* and the USMI, on the other hand, can reveal the impact of industrial structure on the Midwest. This is because the industries in the MMI* are growing at the national pace, but the mix of the industries in the MMI* is determined by their share of the Midwest economy.
5 Joan P. Crary, et. al., “The Michigan economy in 1988,” The Economic Outlook for 1988, University of Michigan, 1988.


